The interwar period was the most turbulent in the history of currency markets. The floating exchange rate era of the 1920s was marked by unprecedented foreign exchange volatility and large European currency depreciations, while the 1930s are remembered for the successive waves of speculative attacks, which eventually brought down the gold standard system (Eichengreen Reference Eichengreen1992a). The interwar years also witnessed a major transformation in the practice of foreign exchange trading with the spread of dealings by telegraphic transfer and of forward contracts. As a result, a large-scale spot and forward exchange market emerged for the first time in London. Anecdotal evidence from contemporaries suggests that currency trading became a substantial activity starting in the 1920s, as speculators sought to exploit the new profit opportunities associated with floating exchange rates (Einzig Reference Einzig1937). Economists have long debated whether foreign exchange speculation was a stabilizing or destabilizing force for exchange rates in the 1920s and 1930s (Nurkse Reference Nurkse1944; Friedman Reference Friedman1953).Footnote 1 However, while the literature on the causes and consequences of interwar currency instability is prolific, little is known about the risks, returns and nature of speculating in currencies during the dawn of the modern foreign exchange market.
This article provides a study of actual currency speculation during the 1920s and 1930s. Currency investing is often considered a zero sum activity in that one foreign exchange speculator's gain is always another's loss. Standard finance theory also holds that any profits from currency trading arise from pure chance. While currency speculation consists in betting on the future evolution of exchange rates, according to the risk-neutral efficient market hypothesis, no investor should be able to out-forecast the market on a consistent basis and the expected return from speculating in currencies should therefore be zero.Footnote 2 Yet, the high volume of speculative activity on foreign exchange markets both in the interwar years and today is difficult to reconcile with the view that currency trading yields no returns at all.
There are two kinds of currency speculators: discretionary, fundamentals-based traders who rely on their own analysis of macroeconomic variables to predict future exchange rate movements; and technical traders who seek to identify market anomalies and exploit them by following mechanical trading rules. In the latter case, the recent literature has identified a few persistent anomalies in foreign exchange markets over the last 30 years and has shown that several naïve trading rules generate substantial returns (Lustig and Verdelhan Reference Lustig and Verdelhan2007; Brunnermeier, Nagel, and Pedersen Reference Brunnermeier, Nagel and Lasse H.2009; Burnside et al. Reference Burnside, Eichenbaum and Kleshchelski2011; Burnside, Eichenbaum, and Rebelo Reference Burnside, Eichenbaum and Kleshchelski2011; Berge, Jordà, and Taylor Reference Berge, Jordà and Alan M.2011; Jordà and Taylor Reference Jordà and Alan M.2011, Reference Jordà and Alan M.2012; Lustig, Roussanov, and Verdelhan Reference Lustig, Roussanov and Verdelhan2011; Menkhoff et al. Reference Menkhoff, Sarno and Schmeling2012a, Reference Menkhoff, Sarno and Schmeling2012b).
Empirical evidence on the returns to currency speculation is however wholly based on data for the post-Bretton Woods period. In this article, we provide evidence on currency speculation in this earlier and volatile period: the 1920s and 1930s. Using a newly collected dataset of monthly spot and forward bid and ask quotations for all major currencies of the interwar period, we first report evidence on technical-based currency trading. We document the profitability of two naïve trading rules, well known to both interwar and modern speculators alike. One is the carry trade, which consists in betting on high-interest rate currencies and against low-interest rate currencies. The other is momentum—a strategy even simpler to implement than the carry trade—which consists in betting on currencies that have recently appreciated and against currencies having depreciated.
Second, we provide empirical evidence on fundamentals-based currency trading in the 1920s and 1930s relying on a unique and previously unexploited source: the trading record of the most prominent foreign exchange speculator of the time: John Maynard Keynes. Keynes’ contributions to exchange rate theory and his writings on exchange rate policy are well known to economists and economic historians. He was the first economist to publish an explicit formulation of the covered interest parity condition (CIP) and among the first to present empirical evidence on the purchasing power parity theory (PPP). He also expressed his pessimism regarding the adverse impact of the allied war reparations on the prospects for the continental European economies and currencies (Keynes Reference Keynes1919), and famously criticized the British decision to return to the gold standard at pre-war parity in April 1925 (Keynes Reference Keynes1925). It is known that Keynes speculated in currencies (Moggridge Reference Moggridge1983, Reference Moggridge1992; Skidelsky Reference Skidelsky1992). However, the nature and extent of his currency trading activity has not previously been analyzed. Between August 1919 and May 1927, and again between October 1932 and August 1939, Keynes made full use of the newly-emerged forward market to pursue a discretionary (as opposed to technical) approach to currency speculation comprising a sophisticated analysis of macroeconomic fundamentals. Although anecdotes about his speculative activities abound in the historical literature, this article is the first to analyze Keynes’ trading record in detail and in its entirety. Drawing upon archival research and compiling a comprehensive dataset of Keynes’ trades, we describe his strategy, the risks he took, and his performance.
Our first result is that speculators following technical currency strategies such as the carry trade and momentum could make substantial profits during the interwar period. Hence, the carry and momentum anomalies, identified in the modern period, were also present on the foreign exchange markets of the 1920s and 1930s. However, we also find that the returns to these technical trading rules were time varying. While performing strongly during the floating exchange rate era of the 1920s, technical trading returns were much less impressive and, in the case of the carry trade, even negative during the 1930s, as countries fought to stay on the gold standard before eventually devaluing. Following these strategies, therefore, involved traders taking substantial risks and withstanding prolonged periods of losses, a fact that might explain why their profits were not arbitraged away.
Our second result is that in the 1920s and 1930s implementing a currency trading strategy based on the analysis of macroeconomic fundamentals was challenging (even) for John Maynard Keynes. While his trading strategy yielded positive cumulative returns in both his periods of trading, on two occasions he experienced substantial losses before making a profit. In fact, Keynes would have performed more strongly during the floating exchange rates era of 1920–1927 if he had selected currencies by following a combination of the naïve technical carry and momentum rules rather than his own analysis of macroeconomic fundamentals. The second period during which he traded (1932–1939) coincided with the demise of the international gold standard system when neither technical trading strategies nor Keynes’ fundamentals-based strategy performed strongly.
Overall, our findings suggest that the returns to currency speculation varied greatly across the interwar years. During the floating exchange rate era of the 1920s, large profit opportunities existed for currency traders. This result contrasts with the risk-neutral efficient market hypothesis as applied to the foreign exchange market, but is consistent with recent findings that naïve currency speculation strategies performed well during the post-Bretton Woods floating exchange rate period.Footnote 3 In particular, traders following naïve technical strategies could outperform the fundamentals-based trader Keynes. In contrast, during the managed floating regime of the 1930s, currency speculation was a much more hazardous endeavor for both technical and discretionary traders when the success of any trading strategy crucially depended on its ability to time the main devaluation events of the decade. Our findings also suggest that predicting exchange rates based on an analysis of fundamental factors, as Keynes did, was not easily done during the 1920s and 1930s. The high variability of returns to both technical trading strategies and Keynes’ fundamentals-based strategy suggests that the positive returns earned by investors on average may well have been compensation for the risks they took.
CURRENCY SPECULATION IN THEORY AND PRACTICE
Market Efficiency and the Returns to Currency Speculation
Currency speculation consists in buying (or selling) foreign currencies in anticipation of future appreciation (or depreciation). Traders can choose to borrow and lend funds in different currencies, or, equivalently, they can deal in forward contracts whereby they buy or sell foreign currencies for future delivery at a price agreed in advance.Footnote 4 A forward contract is a bilateral contract between two counterparties: a buyer and a seller. The buyer purchases the foreign currency forward thereby taking a long position in the foreign currency in the expectation that it will appreciate more than the market anticipates. The seller takes an opposing short position in the foreign currency.
For example, let us suppose that the current spot price of one U.S. dollar on the London market is 1.10 sterling pounds (for immediate delivery) while the current forward price is 1.20 sterling pounds (for delivery in one month). The difference between the forward and spot exchange rates is called the forward premium or discount.Footnote 5 An investor who wants to speculate on U.S. dollar appreciation might decide to buy 10,000 U.S. dollars for delivery in one month at the current forward rate. When the forward contract matures, the speculator will obtain 10,000 U.S. dollars in exchange for 10,000∗1.20=12,000 sterling pounds. If, in the meantime, the spot exchange rate has risen to 1.30, she will be able to convert the 10,000 U.S. dollars just purchased into 10,000∗1.30=13,000 sterling pounds on the spot market and turn a profit of 1,000 sterling pounds. If, by contrast, the spot exchange rate has remained below 1.20, she will incur a loss. Speculating in currencies is, therefore, equivalent to a trader betting on her beliefs about the future spot rates relative to those of the market where the latter are expressed by the prevailing forward rates. A currency trader's profitability, therefore, depends on her ability to forecast currency movements better than the market.
Standard finance theory holds that currency speculation does not yield sustainable profits. According to the efficient market hypothesis, the price of an asset reflects all publicly available information about its intrinsic value (Fama Reference Fama1970). In currency markets, this implies that forward exchange rates should reflect all available information about future currency movements and represent the best possible forecasts of future exchange rates—more formally, they should be unbiased predictors of future spot rates (Dornbusch Reference Dornbusch1976; Frenkel Reference Frenkel1981; Fama, Reference Fama1984). Therefore, assuming there is an absence of private information and investors are risk-neutral, if the foreign exchange market is efficient, any differences between a currency's forward price and its future spot price are purely random and any profit from speculating in currencies arises from mere chance. Even the most brilliant economist or currency speculator should not be able to forecast better than the market on a consistent basis. Accordingly, Deirdre McCloskey (Reference McCloskey1988, Reference McCloskey1990, pp. 111–22) argues that economic expertise has little value on financial markets and, upon encountering an economist claiming to know how best to invest one's money, suggests asking: “If You're So Smart, Why Ain't You Rich?”
A further implication of efficiency in the foreign exchange market is that speculators should not expect to turn a profit from buying the high-interest rate currencies on the forward market while selling the low-interest rate ones. According to the uncovered interest parity theory (UIP), risk-neutral investors should expect high interest rate currencies to depreciate against low-interest rate currencies by the extent of the interest rate differential.Footnote 6 Arbitrage in the foreign exchange market should ensure that any departures from UIP are short-lived. Another type of interest rate arbitrage consists of speculators borrowing in a low-interest rate currency to invest in a high-interest rate currency while hedging the exchange rate risk through a forward contract. Such activity will drive the difference between the forward and spot exchange rates (the forward discount) towards the interest rate differential, ignoring transaction costs. At this point, any further arbitrage will yield zero return and the so-called CIP condition holds. This condition was first formulated by Keynes (Reference Keynes1923) in his Tract on Monetary Reform.
The Empirics of Currency Speculation
Recent empirical research has challenged the conventional view that currency speculators cannot earn sustainable profits on two fronts. First, empirical tests of the efficient market hypothesis have generally rejected the proposition that the expected return to currency speculation is zero, since forward exchange rates appear to be poor predictors of future spot rates. While CIP generally holds in the data over longer time periods, numerous studies have documented the failure of UIP at short and medium term horizons, implying that interest rate arbitrage between countries is profitable (Hansen and Hodrick Reference Hansen and Robert J.1980; Hodrick Reference Hodrick1987; Froot and Thaler Reference Froot and Richard H.1990). Second, researchers have documented the tendency of exchange rates to trend, otherwise known as momentum. Strong (weak) currencies tend to continue appreciating (depreciating) over the short and medium term without this tendency to trend being fully reflected in forward exchange rates (Levich and Thomas III Reference Levich and Thomas1993; Okunev and White Reference Okunev and Derek R.2003; Pukthuanthong-Le, Levich, and Thomas III Reference Pukthuanthong-Le, Levich and Thomas2007; Neely, Weller, and Ulrich Reference Neely, Weller and Joshua M.2009).
Currency traders mechanically exploit these two anomalies through naïve technical trading rules.Footnote 7 The carry trade systematically exploits the failure of the UIP condition by buying high-interest rate currencies and selling low-interest rate currencies on the forward market. The momentum strategy exploits the tendency of exchange rates to trend by buying currencies that have appreciated over the previous one to three months and selling those that have depreciated over the same time period. Recent research has shown that both technical strategies have generated very high returns since the end of Bretton Woods (Gyntelberg and Schrimpf Reference Gyntelberg and Schrimpf2011; Lustig and Verdelhan Reference Lustig and Verdelhan2007; Brunnermeier, Nagel, and Pedersen Reference Brunnermeier, Nagel and Lasse H.2009; Burnside et al. Reference Burnside, Eichenbaum and Kleshchelski2011; Burnside, Eichenbaum, and Rebelo Reference Burnside, Eichenbaum and Kleshchelski2011; Menkhoff et al. Reference Menkhoff, Sarno and Schmeling2012a; Jordà and Taylor Reference Jordà and Alan M.2011, Reference Jordà and Alan M.2012; Asness, Moskowitz, and Pedersen Reference Asness, Moskowitz and Heje2013) and that a large part of currency investors' performance is explained by their following one or both of these strategies (Pojarliev and Levich Reference Pojarliev and Richard M.2008, Reference Pojarliev and Richard M.2010, Reference Pojarliev, Richard M., James, Marsh and Sarno2012; Abbey and Doukas Reference Abbey and John A.2015).
Both the carry and momentum strategies are zero-investment strategies—they imply engaging in forward contracts, which only require the posting of a margin (or collateral).Footnote 8 Exactly why the profits to such strategies are not arbitraged away therefore constitutes an important puzzle and is the subject of debate in the literature. Some authors attribute this phenomenon to a market failure, known as the “limits to arbitrage,” caused by an insufficiency of trading capital or the behavior of myopic traders (Shleifer and Vishny Reference Shleifer and Robert W.1997; Lyons Reference Lyons2001; Menkhoff et al. Reference Menkhoff, Sarno and Schmeling2012b). Others argue that the returns to currency speculation represent a risk premium compensating investors for bearing non-diversifiable risks such as having to suffer substantial losses during economic and financial shocks (Lustig and Verdelhan Reference Lustig and Verdelhan2007; Lustig, Roussanov, and Verdelhan Reference Lustig, Roussanov and Verdelhan2011; Menkhoff et al. Reference Menkhoff, Sarno and Schmeling2012a).
As an alternative to such naïve technical trading rules, speculators can rely on their own analysis of fundamental economic factors to make exchange rate predictions. By tracking macroeconomic variables such as the inflation rate, the external trade balance and capital flows, the monetary policy, as well as political factors, speculators identify what they perceive as deviations of market exchange rates from their equilibrium values. Fundamentals-based traders therefore implicitly assume that publicly available information on macroeconomic and political factors is not fully reflected in market expectations—they think they can out-forecast the market (Middleton Reference Middleton2006). Whether this approach to currency investing can yield sustainable profits is debatable. Indeed, numerous studies have shown that macroeconomic variables are of little value in forecasting exchange rates over the short run. In a classic study, Richard A. Meese and Kenneth Rogoff (Reference Meese and Rogoff1983) have shown that a simple model where exchange rate changes are assumed to be random has better forecasting power than standard macroeconomic models.Footnote 9 More recently however, Yin-Wong Cheung, Menzie D. Chinn, and Antonio Garcia Pascual (2005) have argued that macroeconomic models might have some merits in predicting exchange rates and Óscar Jordà and Alan M. Taylor (Reference Jordà and Alan M.2012) show that currency trading strategies exploiting the deviations of exchange rates from their fundamental values are profitable.
CURRENCY TRADING IN THE 1920S AND 1930S
The decade following WWI saw a profound transformation of foreign exchange markets and a boom in currency speculation. The end of wartime capital controls in 1919 and the beginning of the floating exchange rate period led to a resurgence of foreign exchange activity with London becoming the major center of trading (Atkin Reference Atkin2005, pp. 40–41). At the same time, a large-scale forward currency market was established.Footnote 10 Currencies were traded by the main British and continental European banks as well as by investment syndicates (the precursors of today's currency funds) and by wealthy individuals (Einzig Reference Einzig1937, p. 144). Considerable retail investor interest in currency trading also emerged as the period progressed (Keynes Reference Keynes1923, p. 132; Einzig Reference Einzig1937, pp. 69, 145). Notable speculators in currencies in the interwar period include Winston Churchill (Clarke Reference Clarke2014, p. 148) and, of course, Keynes.
Foreign exchange trading surged in the first half of the 1920s, when investors used the new forward exchange contracts to exploit the increased exchange rate volatility. According to Paul Einzig (Reference Einzig1937, p. 69), speculation boomed in 1923–1924 when “the Forward Market attracted many thousands of gamblers in every country.” At that time, “almost anybody could walk into almost any bank and open a speculative account” (Einzig Reference Einzig1937, p. 144). It is clear that market commentators were very aware of the emerging currency trading opportunity. For example, E. G. Peake (Reference Peake1923, p. 5) analyzed whether the forward exchange rate was a good predictor of the future spot rate. His finding of only “a slight connection between the forward-over-spot quotation and the future rise and fall in the exchange” in the case of the sterling/dollar exchange rate over 1922–1923 suggested sizable profit opportunities for speculators.
The mid-1920s were marked by the stabilization of exchange rates as the German mark (1924), the British pound (1925), the French franc (1926), and the Italian lira (1927) returned to the fixed-exchange-rate gold standard regime. By 1928, all major currencies (except the Spanish peseta) had switched from floating to fixed exchange rates leaving little room for speculation (Eichengreen Reference Eichengreen1992a). As a consequence, the volume of currency trading fell dramatically (Einzig Reference Einzig1937, p. 70). Currency speculation in the forward exchange market resumed following the onset of the Great Depression in the 1930s when most countries successively threw away their “golden fetters” and switched to a managed floating regime. Britain left the gold standard in September 1931 followed by the United States in April 1933, Belgium in May 1935, and France, the Netherlands, and Switzerland in September 1936. However, activity remained subdued compared to the 1920s. The emergence of a Sterling Bloc, comprising countries pegging their currencies to sterling, as well as the adoption of exchange controls by Germany and Italy considerably reduced the number of trading opportunities down to the currencies of Britain, the United States, France, the Netherlands, Belgium, and Switzerland (Atkin Reference Atkin2005, pp. 69–72). Nevertheless, speculators still bet on exchange rates, as for example, during the attacks on the Belgian franc in March 1935–May 1935 and the French franc in June 1936–September 1936 (Einzig Reference Einzig1937, pp. 79–80).Footnote 11
There is evidence that investors used both technical and fundamentals-based analysis to speculate on foreign exchange markets during this period. Einzig (Reference Einzig1937) reports that after WWI currency speculators made use of such economic theories as the PPP condition in order to formulate their currency forecasts while Keynes, as we discuss later, is a prime example of a trader who based his strategy on fundamental analysis. There is also ample evidence that traders employed trend-following and momentum techniques. For example, one investment manual published a detailed description of profitable trend-following investment rules and targeted stock investors whose “primary objective is to make money by using intelligent understanding instead of ignorant gambling” (Gartley Reference Gartley1935, p. 1).Footnote 12
DATA
To estimate the returns to the naïve technical carry and momentum strategies, we hand-collected a monthly dataset of spot and forward bid and ask quotations against sterling for all main currencies traded in London in 1920–1939. There are nine currencies for which an active forward market existed in London (Einzig Reference Einzig1937, p. 104): the Belgian franc (BEF), the Swiss franc (CHF), the German mark (DEM), the Spanish peseta (ESP), the French franc (FRF), the Pound Sterling (GBP), the Italian lira (ITL), the Dutch guilder (NLG), and the U.S. dollar (USD). Although spot rates were published before 1920, forward rates were not and so our return estimates start in 1920, the first year in which forward rates become available. Our primary sources for exchange rate data are the Financial Times and the Manchester Guardian supplemented with data from Keynes (Reference Keynes1923) and Einzig (Reference Einzig1937, pp. 450–81) for 1920–1922. All exchange rates are expressed in units of foreign currency per sterling pound on the last trading day of each month, or, when unavailable, on the trading day closest to the month-end.Footnote 13
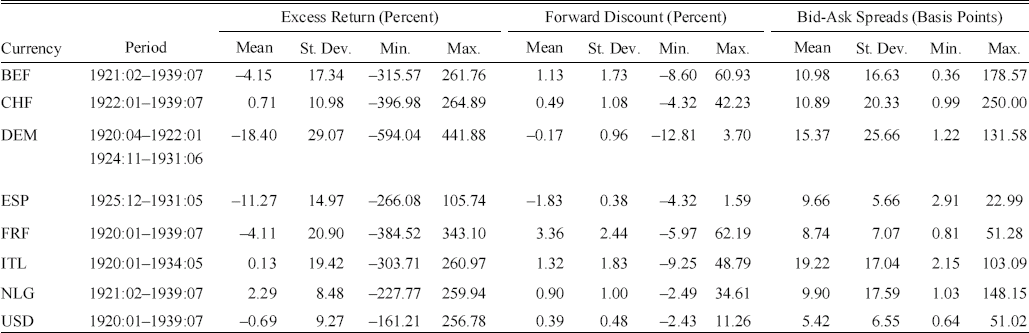
In Table 1 we summarize the descriptive statistics for each currency in the sample. Excess return is the annualized return on buying a currency this month and selling it forward next month before transaction costs. Mean excess returns vary between +2.29 percent for the NLG and −18.40 percent for the DEM. The forward discount is the annualized log difference between the one-month forward rate and the spot rate of a currency in a given month. Average forward discounts range between −1.83 percent (premium) in the case of the ESP and +3.36 percent (discount) for the FRF with most currencies trading at a small discount against the GBP on average. The bid-ask spread is defined as the difference between the price at which a foreign currency can be purchased (the ask price) and the price at which it can be sold (the bid price). Bid-ask spreads are a measure of transaction costs. The size of the spreads indicates that the foreign exchange market was relatively liquid compared to the end of the twentieth century;Footnote 14 the USD and FRF being the most liquid currencies and the ITL and DEM the most illiquid.
SAMPLE CURRENCIES 1920–1939: DESCRIPTIVE STATISTICS

Notes:
The table summarizes the mean, standard deviation, minimum and maximum of annualized log excess returns (percent), annualized one-month forward discounts (percent), and spot bid-ask spreads (basis points) for eight exchange rates against the sterling pound (GBP) in the period 1920–1939: the Belgian franc (BEF), Swiss franc (CHF), German mark (DEM), Spanish peseta (ESP), French franc (FRF), Italian lira (ITL), Dutch guilder (NLG), and U.S. dollar (USD).
Source:
See text.
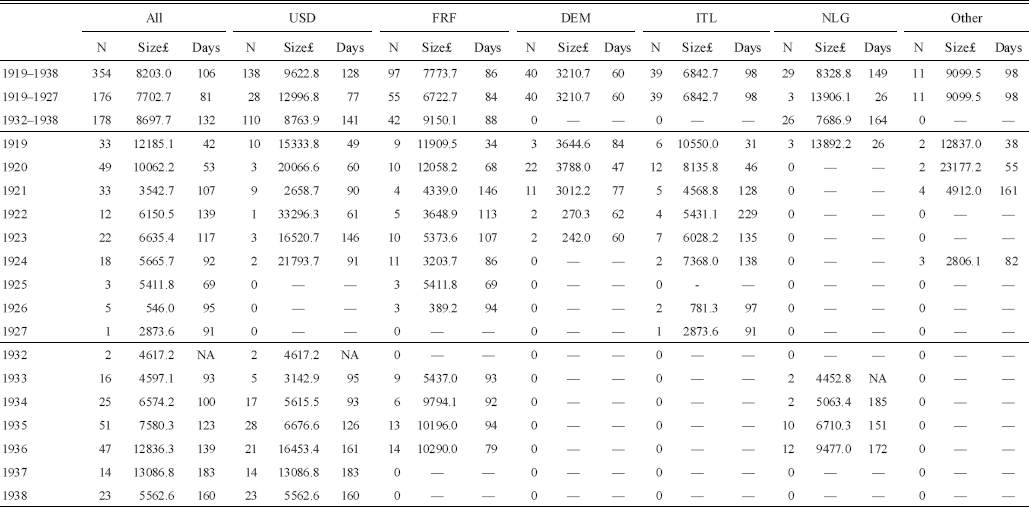
Analyzing discretionary fundamentals-based trading strategies is by its nature dependent on the existence of individual investors' trading records. In this article, we illustrate this style of currency investing for interwar currency markets through a detailed examination of the trading record of one of the most famous currency speculators of this period, John Maynard Keynes.Footnote 15 Beginning in August 1919 until May 1927 and again from October 1932 to March 1939, Keynes traded currencies on his own account. The interruption to his trading coincides with the return to the gold standard. We construct a comprehensive dataset of all his spot and forward currency trades from his personal investment ledgers kept in the archives at King's College, Cambridge.Footnote 16 Typically, Keynes would take out a forward contract to buy or sell a currency and then choose one of three possible options: (1) closing the position with a spot purchase or sale in the days immediately before the delivery date; (2) closing the position well before the delivery date; and (3) maintaining the position by renewing the forward contract. In total, we compile 354 currency trades on his personal account.Footnote 17 For each spot and forward transaction, we record the date of the transaction, the nominal value of the contract, and the exchange rate versus sterling at which he contracted. For each forward transaction, we also record the date on which delivery was to take place and from the latter we calculate the duration of each of his forward contracts.
In Table 2 we summarize all his currency trades. For each year, we report the number of trades in each currency, the average sterling value, and the average duration in number of days of the nominal forward position. In the 1920s, he mainly traded the USD, DEM, FRF, and ITL against the GBP. In the 1930s, he traded in only three currencies, the USD, FRF, and NLG against the GBP. We analyze these trades below.
KEYNES' CURRENCY TRADES, 1919–1939: DESCRIPTIVE STATISTICS

Notes:
The table reports, by calendar year in which each trade was initiated, the number of trades (N), the average trade size in pounds (Size£), and the average duration of forward contracts (Days) for all currencies traded (All) as well as for the USD, FRF, DEM, ITL, and NLG. “Other” includes rupees, Norwegian krone, and Danish krone. Keynes' last trade was initiated in 1938 and matured in 1939.
Source:
See text.
PROFITABILITY OF TECHNICAL CURRENCY STRATEGIES, 1920–1939
To estimate the extent to which currency speculators could generate profits by following technical trading rules on interwar currency markets, we compute the returns to pursuing either of the two naïve trading strategies, the carry trade and momentum, over the 1920–1939 period, both before and after transaction costs.Footnote 18 Carry and momentum strategies were each easily implementable and required only that investors look at the exchange rate quotations published in the main British newspapers in order to decide their currency trading positions. We assume investors could speculate in the nine currencies for which an active forward exchange market existed.Footnote 19
We follow the recent literature when estimating the returns to these strategies (Lustig and Verdelhan Reference Lustig and Verdelhan2007; Lustig, Roussanov, and Verdelhan Reference Lustig, Roussanov and Verdelhan2011; Menkhoff et al. Reference Menkhoff, Sarno and Schmeling2012a, Reference Menkhoff, Sarno and Schmeling2012b). On the basis of spot and forward exchange rate quotations reported in newspapers, we rank these nine currencies by either:
-
(1) their forward discount (or interest rate differential) against sterling (CARRY);Footnote 20 or
-
(2) their spot exchange rate appreciation (against sterling) over the preceding month (MOM).
We compute the returns to a strategy which goes long (buys) the two highest-ranking currencies and goes short (sells) the two lowest-ranking currencies in equal proportions on the forward market at the end of each month.Footnote 21 An important issue when estimating carry and momentum returns is to account for the costs of implementing these strategies which are measured by the spread between bid and ask exchange rate quotations. We therefore estimate the returns to currency strategies after adjusting for bid-ask spreads (see Appendix). It is important to note that quotations of bid-ask spreads published in the newspapers typically overestimate the actual spreads faced by currency dealers and investors (Lyons Reference Lyons2001).
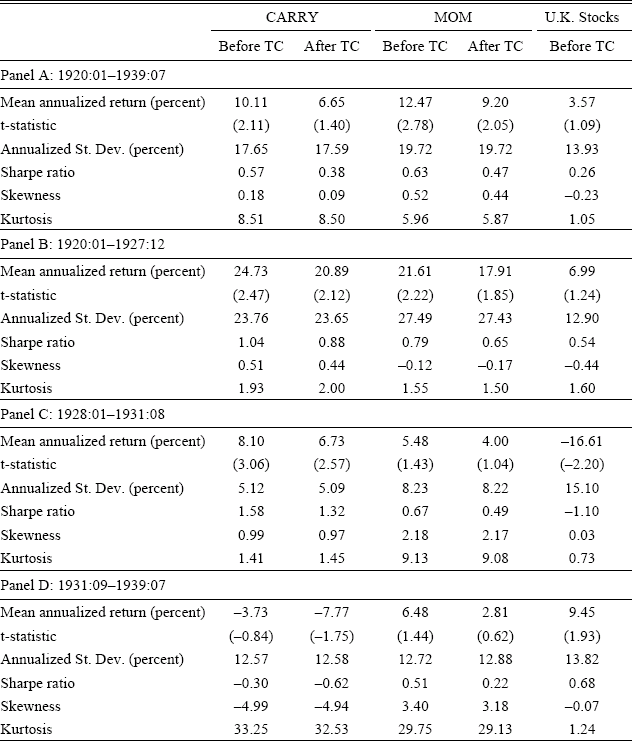
Table 3 shows the performance of each currency strategy and of the U.K. stock market for the whole period 1920–1939 (Panel A); for the floating exchange rate period, January 1920 to December 1927 (Panel B); the return to the gold standard period, January 1928 to August 1931 (Panel C); and the managed floating exchange rate period, September 1931 to July 1939 (Panel D). The performance of the U.K. stock market is proxied by the excess return on an equally-weighted 100 Share Index based on Elroy Dimson, Paul Marsh, and Mike Staunton (2002).Footnote 22 The two simple strategies CARRY and MOM generated mean annualized excess returns of 10.11 percent and 12.47 percent (before transaction costs) and these returns are statistically significantly different from zero at the 5 percent level of confidence. Moreover, their risk-adjusted performance also looks impressive. A standard measure of risk-adjusted performance is the Sharpe ratio (SR), defined as the ratio of annualized excess returns to their annualized standard deviation. CARRY and MOM exhibited Sharpe ratios of 0.57 and 0.63, respectively, over 1920–1939, higher than the Sharpe ratio available on U.K. stocks over the same period (0.26). They also compare favorably with those of the exact same strategies (0.56 and 0.24, respectively) when implemented on G10 currencies during the 1985–2012 period (Accominotti and Chambers Reference Accominotti and Chambers2014).Footnote 23
CARRY AND MOMENTUM STRATEGY RETURNS 1920–1939

Notes:
This table summarizes the performance of carry and momentum strategies implemented on a sample of nine currencies (BEF, CHF, DEM, ESP, FRF, GBP, ITL, NLG, and USD) between January 1920 and August 1939. STOCKS refers to the log excess returns on a monthly equally-weighted 100 Share U.K. equity index based on Dimson, Marsh, and Staunton (Reference Dimson, Marsh and Staunton2002). Excess returns on stocks are calculated by deducting the one-month T-bill rate from the raw total return. Log excess returns on the CARRY and MOM strategies are reported before and after transaction costs (bid-ask spreads). For each asset class and strategy, the table reports the annualized Sharpe ratio, mean annualized log return (and t-statistic), annualized standard deviation of monthly log returns, skewness, and kurtosis coefficients. The t-statistics in parentheses are based on Newey and West (Reference Newey and Kenneth D.1987)'s heteroskedasticity and autocorrelation consistent (HAC) standard errors computed using the optimal number of lags as defined by Andrews (Reference Andrews1991).
Sources:
Authors' computations (see text and Appendix).
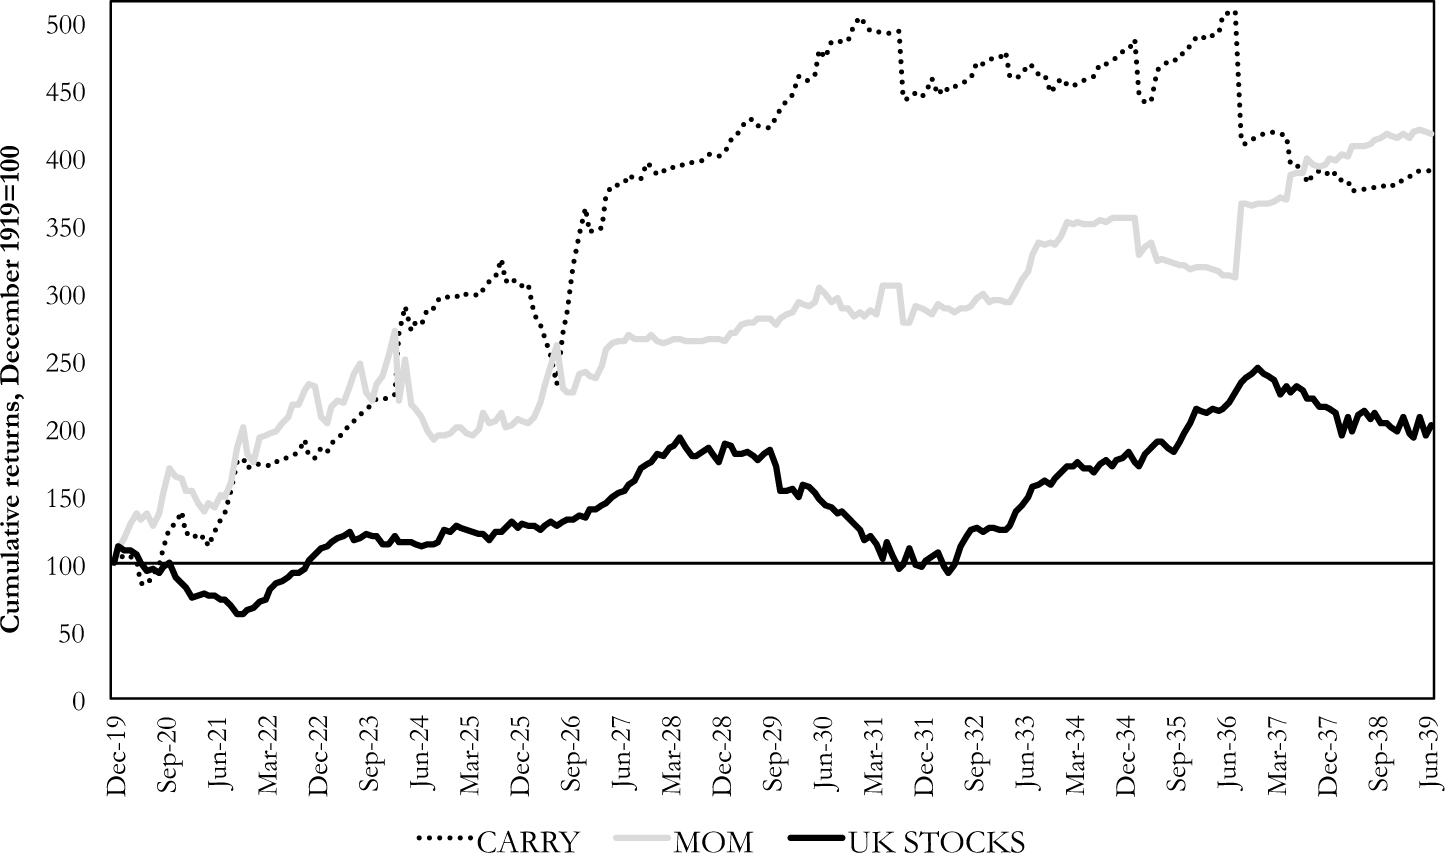
Figure 1 displays cumulative excess return indices for the CARRY and MOM strategies compared to the cumulative total returns on the U.K. equity index in excess of U.K. Treasury bill returns. To assist the comparison, we scale the returns to the two currency speculation strategies so that their volatility is equivalent to that of the excess returns on U.K. equities.Footnote 24 The results indicate that both carry and momentum strategies yielded high excess returns when implemented over the whole 1920–1939 period. Technical traders starting with £100 in December 1919 and pursuing carry and momentum strategies would have ended up with £390 and £418 respectively in July 1939, as opposed to £201 if they had invested in U.K. stocks (Figure 1).
CUMULATIVE EXCESS RETURNS TO TECHNICAL CURRENCY STRATEGIES, 1920–1939

These results indicate that, as in the post-Bretton Woods years, the returns in the interwar period to technical foreign exchange trading were high. Speculators following naïve carry and momentum rules could make substantial profits. The high profitability of technical trading rules cannot be explained by transaction costs. A comparison of the mean returns before and after transaction costs in Table 3 reveals that adjusting for bid-ask spreads reduces the mean return and Sharpe ratio of the CARRY strategy by one-third and those of the MOM strategy by only one-quarter. So what explains the strong performance of these zero-investment strategies? It might be that the foreign exchange market was simply inefficient during this period. On the other hand, Andrei Shleifer and Robert W. Vishny (Reference Shleifer and Robert W.1997) argue that the persistence of market anomalies can arise from “limits to arbitrage” due to traders not having sufficient capital and risk appetite to survive the periods of losses which can accompany any arbitrage trading.
The performance of the carry and momentum strategies, while impressive, was also variable over the interwar period. When we decompose returns into sub-periods, we find that the technical strategies performed very strongly during the floating exchange rate era of January 1920–December 1927 but much less so during the August 1931–July 1939 period, when countries struggled to stay on the gold standard and then successively abandoned it.Footnote 25 In this latter period, the carry trade generated negative returns. The momentum strategy continued to perform, but even here, the average rate of return is not statistically significant over those years (Table 3).
The performance of technical strategies during the 1930s was largely influenced by the ability of a speculator to time the large and sudden currency swings. Such swings account for both the pronounced negative skewness of the carry strategy and positive skewness of the momentum strategy. Both strategies also incurred large drawdowns in certain months. A carry trader would have made severe losses in September 1925–July 1926 (second French franc crisis), August 1931–October 1931 (sterling crisis), February 1935–April 1935 (Belgian franc crisis), and September 1936–December 1938 (collapse of the gold bloc and subsequent French franc crisis). A momentum trader would similarly have endured drawdowns in October 1920–April 1921, February 1924–September 1924 (first French franc crisis), July 1926–September 1926 (second French franc crisis), and January 1935–August 1936 (run-up before the gold bloc's collapse). Seen in this way, the high mean returns to these naïve technical strategies might have been necessary to compensate speculators for the risk of experiencing sudden and substantial losses.Footnote 26
KEYNES' CURRENCY SPECULATION STRATEGY
Keynes the Discretionary Fundamentals-Based Trader
As early as 1919, Keynes' correspondence with his then investment confidant, syndicate partner and stockbroker Oswald T. Falk clearly illustrates his focus on such macroeconomic fundamentals as expected changes in official interest rates, the level of European reparations, international trade and capital flows, and the inflation outlook when making his currency forecasts.Footnote 27 For example, when discussing prospects for the U.S. dollar/sterling exchange rate in the summer of 1919, he paid particular attention to the balance of trade: “Anything [the] US does to put the world [trade] balance less in her favour or that we do to put this balance less against us will benefit sterling in relation to [the] dollar.”Footnote 28 He also assessed the likelihood of countries being able to finance their trade deficits through foreign borrowing and followed news about European loans in London and New York.Footnote 29
While there is evidence that he closely monitored stock and commodity price indices, he did not infer his currency forecasts from a mechanistic analysis of these variables but relied on a comprehensive assessment of macroeconomic and political factors.Footnote 30 His discussion of the outlook for the German mark after WWI provides a good example of this approach: “As regards marks, prices in Germany are, I am sure, much too low in relation to other countries. This is in her favour, as it will stimulate exports and hinder imports. But her real position is so intrinsically weak, and there are so many weak foreign holders of marks, that I should certainly ‘bear’ them for choice. Something political will happen in Germany one of these days which will cause foreign holders to unload wildly.”Footnote 31 Finally, Keynes paid close attention to changes in monetary policies in the different countries. On several occasions, he discussed the likelihood of a change in the Bank of England's policy. Hence, in June 1924, he remarked on the need to be aware of the possibility of an increase in the Bank's discount rate in order to facilitate the return to the gold standard.Footnote 32
Keynes' focus on fundamentals is also clearly apparent from his writings in the 1930s. The best such example is the detailed investment note dated February 1932 that he produced for the board of a large U.K.-quoted closed-end fund on the prospects for sterling.Footnote 33 In this note, he set out his own expectations, relative to the market consensus, as to future changes in the U.K. trade account and invisibles account and in capital flows. In addition, he also discussed the interventionist policies of both the Bank of England and Bank of France, and placed great weight on the particular willingness of the former to intervene in support of sterling. The balance of capital account remained in his opinion an important determinant of exchange rates and he found it “difficult to see how a creditor country can keep its currency depreciated.”Footnote 34 Finally, changes in political conditions continued influencing his currency forecasts during the 1930s. For example, he concluded that the French government's decision to abandon the policy of internal deflation in early 1935 was something that made an “eventual devaluation [of the French franc] still more likely.”Footnote 35
Our extensive analysis of Keynes' correspondence indicates that he speculated based on his own discretionary analysis of fundamentals. At the same time, we find nothing in his papers that refers to carry or momentum trading and no suggestion that he ever considered or followed technical trading rules of any kind.Footnote 36
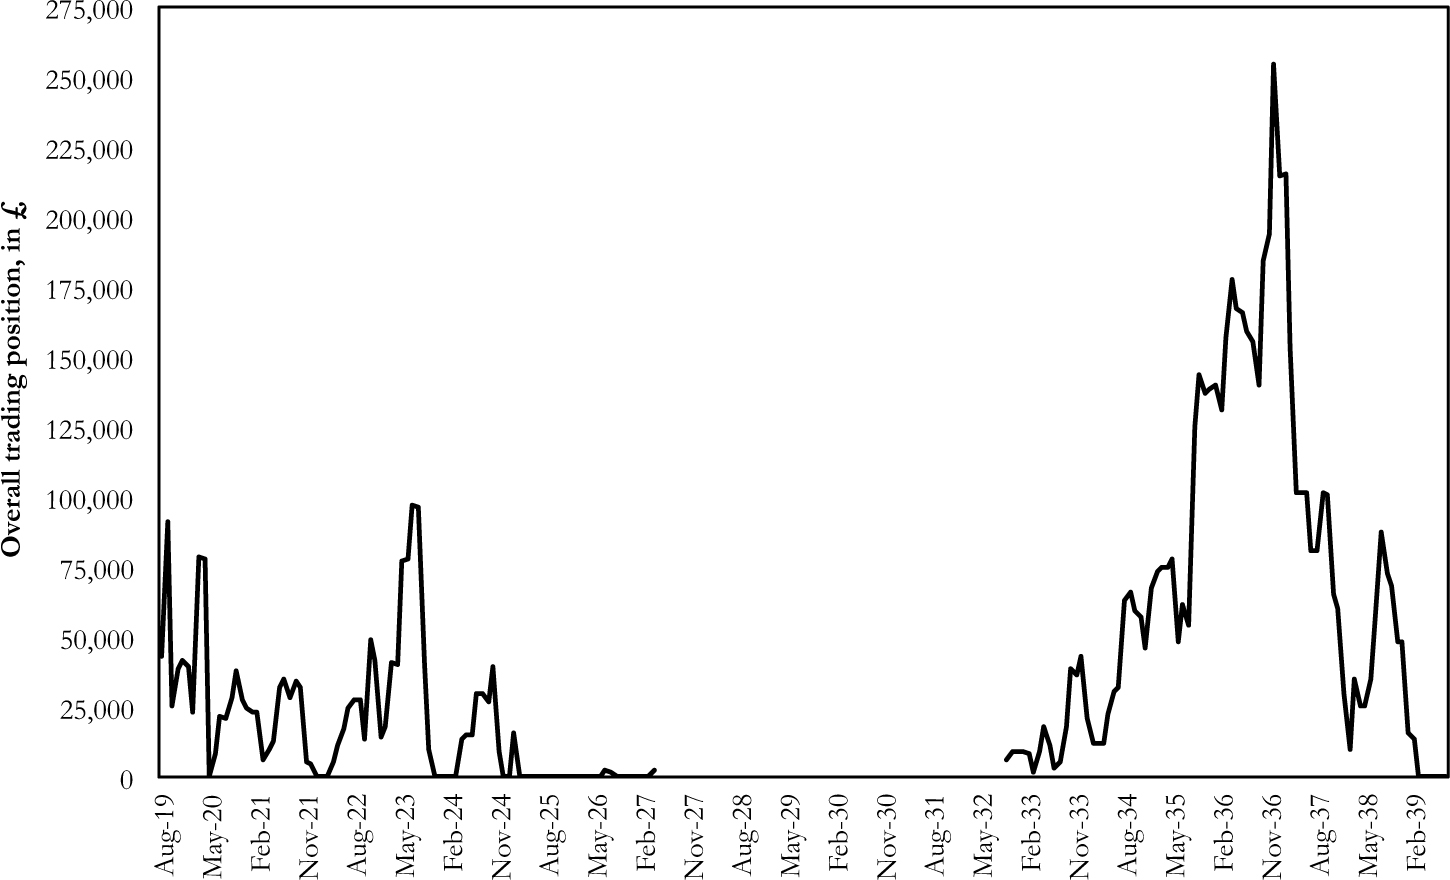
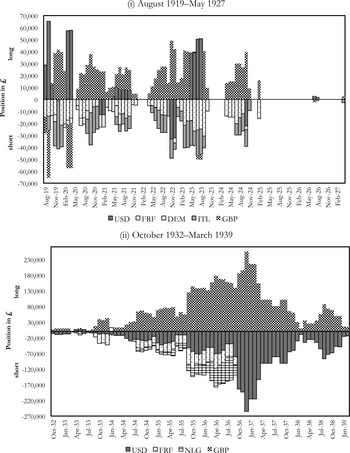
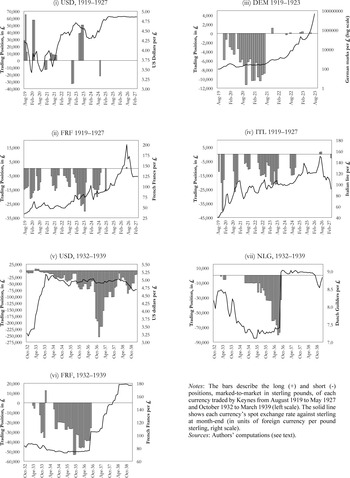
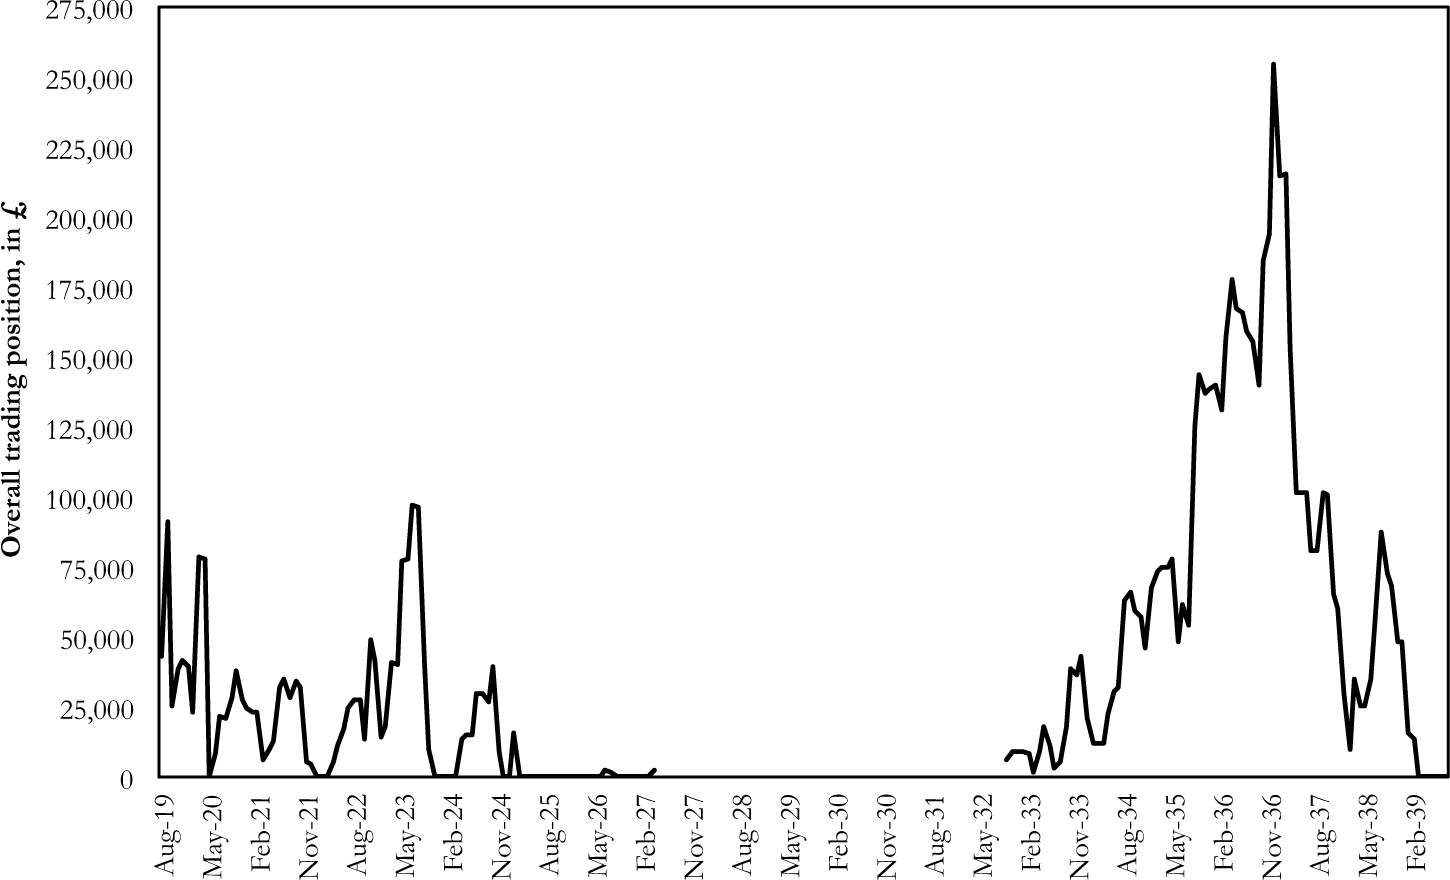
To investigate how a currency speculator such as Keynes traded in the 1920s and 1930s we begin with his cumulative gross position, obtained from summing the marked-to-market value of his long and short positions across all foreign currencies in pounds sterling at the end of each month from August 1919 to March 1939, displayed in Figure 2. His position fluctuated between zero and £100,000 over 1919–1927, peaking in August 1923. He stopped trading completely in May 1927 and returned to the market only in October 1932. Thereafter, the value of his cumulative gross position progressively increased until it reached £250,000 in December 1936. The higher level of activity in the 1930s compared with a decade earlier reflects Keynes' increased personal wealth which averaged over £150,000 in the 1930s compared to slightly more than £40,000 in the 1920s (Moggridge Reference Moggridge1983, p. 11, Table 3). From December 1936 onwards, he progressively reduced the size of his position and he stopped trading in March 1939. Out of Keynes' 354 transactions, 343 were in five currencies: the USD, FRF, DEM, ITL, and NLG. We break down his monthly positions into long (+) and short (-) by individual currency (Figure 3)Footnote 37 and plot his trading position by currency against the relevant spot exchange rate relative to sterling (Figure 4).
KEYNES' OVERALL CURRENCY TRADING POSITION IN STERLING £, 1919–1939
KEYNES' LONG AND SHORT PORTFOLIOS IN £, 1919–1939

KEYNES' TRADING POSITIONS BY CURRENCY (£)

From 1919 to 1925, Keynes consistently shorted the French franc, German mark, and Italian lira with few exceptions, consistent with his views regarding the prospects for European currencies as expressed in The Economic Consequences of the Peace (Keynes Reference Keynes1919) (Figure 3 (i)). His trading of the U.S. dollar appears more tactical. In general, he was long the U.S. dollar in this period, but in 1921, 1922, and 1924 he briefly adopted a short dollar position. His short positions in the French franc, German mark, and Italian lira in April and May 1920 proved disastrous as all three currencies strengthened against sterling (Figure 4 (ii), (iii), (iv)). However, his resumption of these short positions proved profitable when all three depreciated and continued to fall over the first half of the 1920s with the exception of the German mark. No longer being able to trade this currency, he closed out his short position in July 1921.
In 1932–1939, Keynes mainly traded in the U.S. dollar, French franc, and Dutch guilder (Figure 3 (ii)). With his resumption of currency trading at the end of 1932, he initially alternated between short and long positions in these three currencies. Having shorted the dollar in October 1932–February 1933, he closed his position in March, just before the U.S. government suspended the gold standard in the following month (Figure 4 (v)). Believing the depreciation following the suspension of gold convertibility to be overdone, he went long the dollar between April 1933 and June 1933 only to see the currency continue to depreciate. Thereafter, he consistently adopted a short dollar position, which reached its peak in December 1936. Expecting the French and Dutch governments to follow the U.S. dollar off gold, Keynes shorted the French franc and Dutch guilder from March 1933 to December 1933. However, the franc remained stable and the guilder strengthened (Figure 4 (vi) and (vii)). After a pause, he resumed his short positions in both currencies in July 1934 and consistently added to them. Finally, in September 1936 both were devalued. Keynes immediately closed out his franc and guilder positions after the devaluations and was able to show an overall profit on both trades. He did not trade either currency again in the years that followed.
In his Tract on Monetary Reform Keynes (Reference Keynes1923) described in detail the practice of covered interest arbitrage and argued that deviations from CIP were arbitraged, yet this is not a strategy he himself ever appeared to follow. Each trading position recorded in his ledgers was uncovered and never accompanied by corresponding short-term foreign currency borrowing or deposit, and nowhere in his correspondence did he ever make reference to his arbitraging deviations from CIP.Footnote 38
Keynes' Trading Skill
The literature following Meese and Rogoff (Reference Meese and Rogoff1983) has argued that making correct exchange rate forecasts based on the analysis of fundamentals can be challenging although Jordà and Taylor (Reference Jordà and Alan M.2012) claim that fundamentals do matter when predicting the direction of exchange rates.
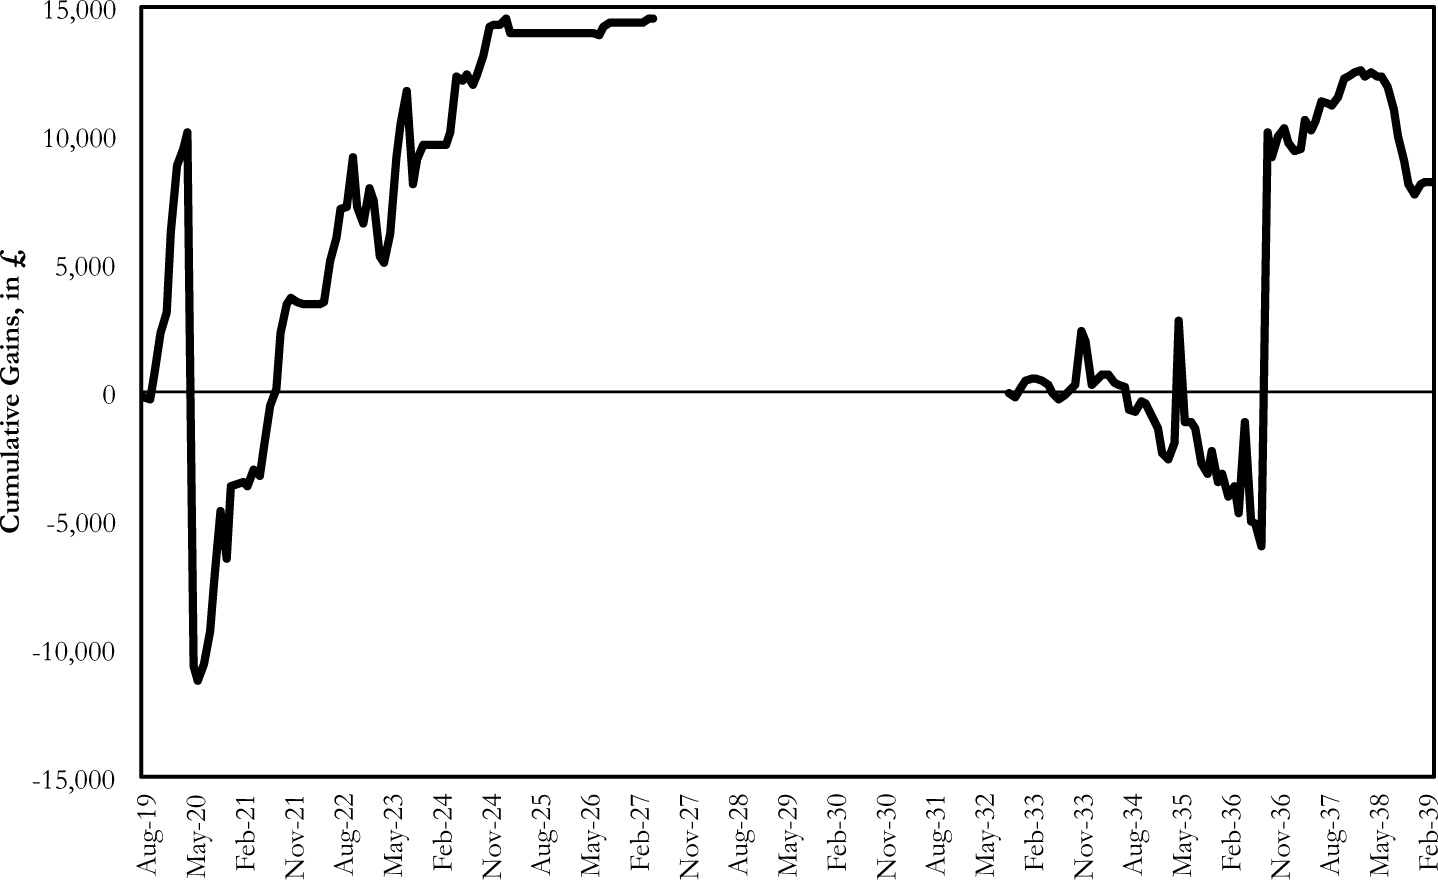
In order to assess Keynes' trading performance, we first estimate in Figure 5 his monthly cumulative gains and losses in sterling pounds from August 1919 to May 1927 and from October 1932 to March 1939 by marking-to-market his currency positions using forward exchange rates. Keynes' trading profits were very volatile. When European currencies appreciated against sterling, his shorting of continental European currencies and going long the U.S. dollar generated a substantial loss of £20,808 in May 1920. This loss was over ten times his annual income at the time and he was probably very close to being bankrupt.Footnote 39 Despite this major setback, he stuck with his currency views over the rest of the 1920s and recovered to make a cumulative profit of £14,576 by the time he stopped trading in 1927. A similar pattern emerges in the 1930s. His bets against the French franc and Dutch guilder incurred cumulative losses of £5,990 by the end of August 1936. However, when both currencies were devalued the following month, he more than recovered these losses and finished with a cumulative gain of £8,164.
KEYNES' CUMULATIVE GAINS (LOSSES) IN £, 1919–1939

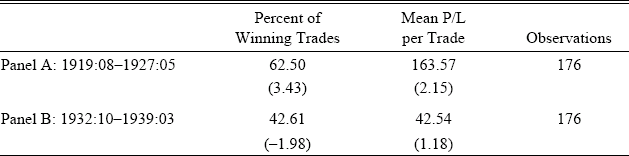
We can ask whether Keynes' profits arose from skill at predicting exchange rates or from pure chance.Footnote 40 Following Boris S. Abbey and John A. Doukas (Reference Abbey and John A.2015), we begin by examining the share of his “winning” trades among all his trades (those which yielded a positive net profit) as well as his average net profit per trade over the period 1919–1939. A random trading strategy, which would have determined the direction and amount of currency trades by a coin toss, should have achieved a share of winning trades not significantly different from 50 percent and an average return per trade not significantly different from zero.
As is indicated in Table 4, 62.50 percent of Keynes' trades over 1919–1927 yielded a positive net profit and this percentage is statistically significantly different from 50 percent. Keynes' average profit per trade of 163.57 pounds sterling is also significantly different from zero, indicating that his profits did not arise from mere chance. In the 1930s, Keynes consistently bet against the commitment of the French and Dutch governments to the gold standard. This strategy required accepting the losses incurred every month in which these countries managed to stay on the gold standard, in anticipation of an eventual and large profit once devaluation occurred. Perhaps not surprisingly, we find that the percentage of his winning trades is significantly lower than 50 percent in 1932–1939. His average profit per trade is also not significantly different from zero and we cannot therefore reject the null hypothesis that his profits arose from pure chance during the 1930s.
PERCENTAGE OF KEYNES' WINNING TRADES AND PROFIT/LOSS PER TRADE, 1919–1939

Notes:
The table reports the percentage of Keynes' winning trades defined as the percentage of all trades which yielded a positive net profit and his average net profit per trade over the two sub-periods he traded, August 1919 to May 1927 (Panel A) and October 1932 to March 1939 (Panel B). The t-statistics reported in parentheses test whether the percentage of Keynes' winning trades was significantly different from 50 percent and whether his average net profit per trade was significantly different from zero.
Source:
Authors' computations (see text and Appendix).
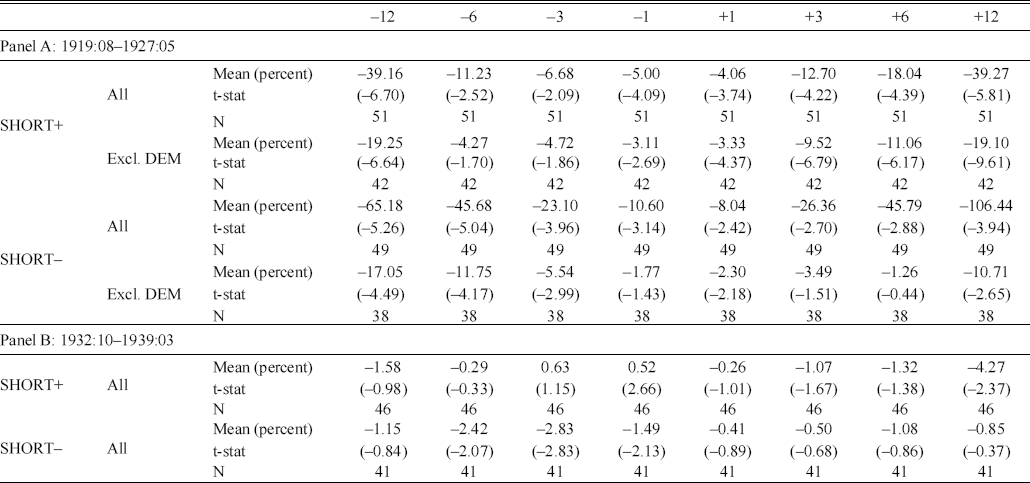
We also examine Keynes' currency investment decisions in event time by looking at spot exchange rate movements over a window stretching from 12 months before until 12 months after he increased or decreased his short positions (Table 5).Footnote 41 Although we report performance both including and excluding the German mark (DEM), we focus our comments on performance excluding the German mark because of its extreme movements leading up to the German hyperinflation.Footnote 42 As we saw in Figure 3, most of the time Keynes shorted foreign currencies against sterling and many of his trades were rollovers of previous positions. In 1919–1927, we find that currencies depreciated by 3.33, 11.06, and 19.10 percent on average over the 1, 6, and 12 months after he increased his short positions (SHORT+) and they depreciated less after he decreased his short positions (SHORT-). In 1932–1939, although we find no significant increase or decrease in spot exchange rates over periods up to 6 months after a change in Keynes' trading positions, currencies depreciated by 4.27 percent over 12 months after he increased his short positions. These results provide support for the claim that Keynes had some skill in predicting exchange rates over both short and long horizons in the 1920s and over the long horizon in the 1930s. Furthermore, the rate of currency depreciation before he increased rather than decreased his short positions is similar. This indicates that his decisions to increase rather than decrease his short positions were not consistently related to the past behavior of exchange rates and give further support to the fact that Keynes was trading on fundamentals rather than following a momentum rule.
EVENT TIME PERFORMANCE ANALYSIS OF KEYNES' CURRENCY TRADES, 1919–1939

Notes:
The table summarizes the performance of currencies over periods of 1, 3, 6, and 12 months before and after Keynes increased (SHORT+) or decreased (SHORT–) his short positions. We do not report the performance of his long positions, since there were relatively few occasions when he changed his long compared to his short positions. Performance is defined as the average log spot return on the currencies he shorted for each of the two sub-periods he traded, January 1920 to May 1927 (Panel A) and October 1932 to March 1939 (Panel B). In Panel A, results are reported both including and excluding the German mark (DEM). Johnson's (Reference Johnson1978) skewness-adjusted t-statistics are in parentheses. N is the number of observations.
Source:
Authors' computations (see text and Appendix).
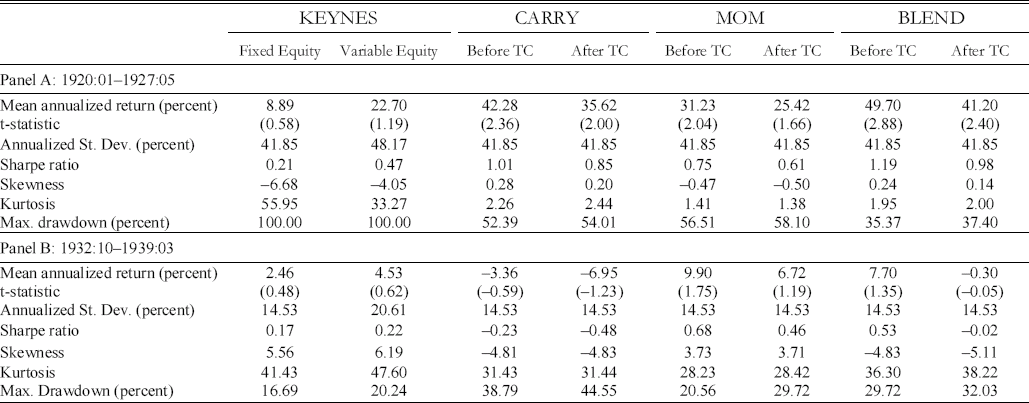
Trading performance is usually assessed in terms of mean rate of return, volatility, and risk-adjusted returns. Converting Keynes' monthly currency profit and loss (in pounds) into a rate of return requires making assumptions about the equity he allocated to his currency investing activities at each point in time. Archival evidence indicates that an assumed margin of 20 percent for trading currencies across this period seems reasonable.Footnote 43 We estimate his returns under two sets of assumptions. First, we apply a 20 percent margin to his maximum gross currency position in each of the 1920s and 1930s (fixed equity).Footnote 44 Second, we estimate his equity assuming that he varied his capital each month by adding his profits and deducting his losses from his capital account (variable equity).Footnote 45
In Table 6 we compare the returns on Keynes' strategy with those on the carry and momentum strategies. We also consider an equally weighted carry and momentum strategy (BLEND) since it is conceivable that a technical trader followed both and thereby diversified the risk of pursuing a single strategy given that returns were less than perfectly correlated. We present the results for the two sub-periods during which Keynes traded and when forward exchange rates data are available: January 1920 to May 1927 (Panel A) and October 1932 to March 1939 (Panel B). Returns to currency trading strategies are reported both before and after adjusting for transaction costs. However, since bid-ask spreads reported in newspapers can overestimate the actual bid-ask spreads faced by traders, we consider the returns after transaction costs as a lower bound of the actual carry, momentum, and blend returns. The mean and volatility of returns exhibited by individual currency managers depends on the extent to which they leverage their currency positions. To facilitate comparison, we leverage the carry and momentum strategy returns to match the volatility of Keynes' returns. The table reports the average return of an investor following these strategies while taking on as much risk as did Keynes.
BENCHMARKING KEYNES' PERFORMANCE, 1920–1939

Notes:
The table compares the performance of Keynes' currency trading strategy with the performance of the CARRY, MOM, and BLEND (equally weighted CARRY and MOM) currency trading strategies over the two sub-periods during which he traded, January 1920 to May 1927 (Panel A) and October 1932 to March 1939 (Panel B). Keynes did not trade during the period June 1927 to September 1932. Keynes' excess returns are estimated assuming his equity was fixed during each period and equal to 20 percent of his maximum gross trading position over the sub-periods (fixed equity) and assuming he varied his equity position every month by adding his profits and subtracting his losses (variable equity). See text for more details. Excess returns on the CARRY, MOM, and BLEND strategies are reported before and after transaction costs (bid-ask spreads, TC) and are levered to match the volatility of Keynes' fixed-equity returns. For each asset class and strategy, the table reports the annualized Sharpe ratio, mean annualized return (and t-statistic), annualized standard deviation of monthly returns, skewness, kurtosis, and maximum drawdown. The t-statistics in parentheses are based on Newey and West (Reference Newey and Kenneth D.1987)'s HAC standard errors computed using the optimal number of lags as defined by Andrews (Reference Andrews1991). The maximum drawdown is defined as the largest single drop in returns from peak to bottom (before a new peak is reached) in the sample.
Sources:
Authors' computations (see text and Appendix).
Our estimates reveal that Keynes achieved a positive mean return during both periods he traded but his returns were also highly volatile. Our two alternative estimates of his equity, fixed and variable, imply Sharpe ratios of, respectively, 0.21 and 0.47 in the first period. These are lower than the Sharpe ratios exhibited by the naïve carry (0.85) and momentum (0.61) strategies during the same months after transaction costs. Moreover, Keynes' returns were negatively skewed during this period, reflecting the large loss he made in May 1920. Keynes could have achieved higher average returns while taking the same amount of risk if he had followed the technical strategies rather than his own discretion in the 1920s. From October 1932 to March 1939, he outperformed the carry strategy (whose mean return was negative) but did not do as well as the momentum strategy. However, none of the trading strategies yielded statistically significant returns. Betting on currencies was hazardous for both Keynes and technical traders alike during a decade characterized by sudden and large swings in exchange rates.
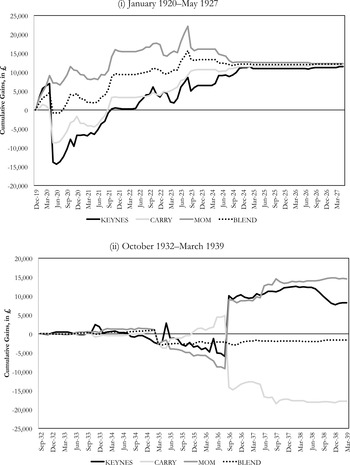
While we believe the assumptions made above are reasonable, our estimates of Keynes' average return and Sharpe ratio depend upon the assumed level of his equity. As a robustness check, we adopt another approach for assessing Keynes' performance. We estimate the profits he would have achieved if he had made exactly the same sized currency trades but selected currencies based on the carry and momentum trading rules rather than on his own discretionary fundamentals-based strategy. Each month, we take his gross trading position by summing his actual longs and shorts across all currencies (in sterling) and invest this same gross amount, half in long and half in short currency positions in accordance with the carry strategy. For example, if Keynes had a total cumulative position of £10,000 in a given month and the carry strategy required going long the USD and FRF and short the DEM and ITL in that month, we assume he would have bought £2,500 of each of the USD and FRF and sold £2,500 of each of the DEM and ITL on the forward market. At the end of each month, we close these positions and compute the resulting profit or loss (in pounds). We then repeat this estimation for the momentum and blend strategies.
The results of this exercise for the two periods during which he traded, January 1920 to May 1927 and October 1932 to March 1939 are reported in Figure 6. Had Keynes selected currencies according to the carry and momentum rules rather than according to his own discretion during this first trading period, he would have achieved similar cumulative profits to those he actually realized but would have endured far less severe losses in the process.Footnote 46 The momentum strategy would never have turned to cumulative losses over the January 1920–May 1927 period while the carry strategy would have registered a maximum loss of £8,885, which compares favorably with Keynes' maximum loss of £20,808. In the 1930s however, selecting currencies according to the momentum strategy would have allowed him to generate higher cumulative profits, but following the carry strategy would have proved disastrous.Footnote 47 The long positions in the high-yielding currencies under the carry strategy were exactly those currencies fighting to stay on the gold standard, namely, the FRF and NLG. Keynes took the opposite approach by systematically shorting these two currencies. When the two currencies were devalued, Keynes' fundamentals-based strategy turned profitable, whereas a carry strategy, had he followed it, would have made very substantial losses.
KEYNES VS. CARRY AND MOMENTUM CUMULATIVE GAINS (£) 1919–1939

Overall, our results indicate that, although Keynes' discretionary fundamentals-based strategy allowed him to make profits, he did not outperform the naïve technical trading rules of carry and momentum in the 1920s. In the 1930s, the high degree of uncertainty regarding the exchange rate regime and the large and sudden swings in exchange rates associated with countries' departures from the gold standard made any currency speculation strategy hazardous and its returns dependent on the precise timing of devaluations and an ability to withstand losses.
Keynes' Currency and Stock Trading
Keynes actively invested in stocks for his Cambridge College (Chambers and Dimson Reference Chambers and Dimson2013; Chambers, Dimson, and Foo Reference Chambers, Dimson and Foo2015; Chambers and Kabiri Reference David and Kabiri2016). He also traded stocks for himself and this raises the question of whether he engaged in hedging the currency exposure of his stock portfolio. Since at no point did Keynes invest in any European stocks, his shorting of European currencies was not at all related to currency hedging needs. His personal stock portfolio was entirely invested from 1919 to 1923 in U.K. stocks and from 1924 to 1927 he only had a very small 3 percent allocation to U.S. stocks. Between 1932 and 1939, his average allocation to U.S. stocks increased to 34 percent of his stock portfolio. However, the negative correlation between his U.S. stock purchases and the changes in his short position in U.S. dollars is a strong indication that he did not engage in hedging his dollar exposure. Furthermore, his correspondence with his broker at no time made any mention of his hedging the currency exposure of his stock portfolio.
A second question is whether his currency returns diversified his stock returns at all. The correlation coefficient between the returns on currencies and stocks is a simple way to capture how diversifying are the two types of investments. In practice, it is difficult to find two asset classes with a negative coefficient and a coefficient around 0.5 is indicative of a reasonable level of diversification. The correlation between his annual profits and losses from his currency trading and annual profits and losses on his stocks both in sterling pounds was 0.45 over 1919–1927 and 0.40 over 1932–1939. Thus, his currency returns did diversify his stock returns to a modest degree. However, while the profits and losses on these two activities were of similar magnitude in the earlier period, the scale of his stock trading profits overwhelmed his currency profits in the 1930s. For example, in 1934/35, when he lost £5,500 in currencies he made £57,000 in stocks and in 1936 his profit of almost £14,000 was offset by a loss of £168,000 on his stock portfolio.Footnote 48
Keynes' Reflections on His Currency Trading
Interestingly, we also find corroboration of the difficulties encountered by Keynes on the foreign exchange market in his own correspondence. He began his career as a currency speculator with a high level of confidence. Even when in May 1920 he endured a dramatic loss on shorting European currencies, his confidence in his ability to make profits from currency trading seemed unaffected. Immediately, he raised new funds from his City financier acquaintance, Sir Ernest Cassel, in order to persist with the very same strategy. He wrote to Cassel as follows: “I anticipate very substantial profits with very good probability if you are prepared to stand the racket for perhaps a couple of months” (Moggridge Reference Moggridge1983, p.7).
However, his confidence in his exchange rate forecasts faded over time. In the 1930s, his correspondence became increasingly pessimistic as he realized the great difficulty in predicting currency movements. For example, his changing views on the U.S. dollar in 1933 stand in sharp contrast with the confidence and persistence he exhibited earlier. Following the dollar devaluation, he explicitly referred to the limits of his fundamentals-based approach, noting that, “exchanges [are] dominated by guesses” rather than fundamentals such as “foreign balances on trade and other income accounts.”Footnote 49 Similarly, Keynes acknowledged the challenges in predicting the timing of currency movements. When discussing the possibility of a French franc and Dutch guilder devaluation in December 1934, he confessed: “Nothing is more rash than a forecast with regard to dates on this matter. The event when it comes will come suddenly. The best thing is to allow for probability and put little trust in forecasts of the date, whether soon or late.”Footnote 50
CONCLUSION
This study of currency trading during the 1920s and 1930s reveals the existence of substantial profit opportunities for currency speculators during this period. We demonstrate that naïve technical currency strategies such as the carry trade and momentum yielded substantial returns over the interwar years. This finding runs counter to the risk-neutral efficient market hypothesis but is consistent with the large excess returns to technical trading strategies documented during the post-Bretton Woods period.Footnote 51 In addition, we find that pursuing these strategies also entailed substantial risks, since returns varied considerably over time. While technical trading strategies performed strongly during the floating exchange rate era of the 1920s, their performance was much poorer during the 1930s, a period marked by the unravelling of the gold standard. The fact that these technical strategies incurred substantial losses in certain months suggests that their overall good performance might have been necessary to compensate investors for such risks.Footnote 52
Furthermore, we provide evidence on an alternative approach to currency investing: the discretionary fundamentals-based strategy of John Maynard Keynes. Compiling the full history of his currency trades from the archival records of his transactions, we document Keynes' currency speculation strategy in detail and assess how he performed. Our analysis of his correspondence and memoranda provide a number of examples of how he derived his views on a currency from his evaluation of its underlying fundamentals. At the same time, we find no such examples indicating the possibility that he followed simple technical trading rules. While Keynes achieved positive cumulative profits over both periods he traded and appeared to possess skill in predicting exchange rates over long horizons, we also find that he would have achieved higher profits in the 1920s if he had followed simple technical trading strategies rather than his own discretion.
Overall, these results suggest that pursuing a trading strategy based on the analysis of macroeconomic and political fundamentals as Keynes did was not an easy task for currency speculators in the 1920s and 1930s. Indeed, trading the fundamental misalignments in exchange rates of the interwar years, clearly apparent to scholars today, was not a sure-fire bet and implied traders being willing to take on substantial risks.
Of course, there was more to Keynes' currency speculation than the pure financial returns he gained from it. In particular, his experience as a currency trader certainly played an important role in the development and formulation of his economic theory. In Chapter 3 of his Tract on Monetary Reform, Keynes (Reference Keynes1923) provided a full analysis of the workings of the foreign exchange market and, especially, of the forward market, leading him to formulate the CIP condition for the first time. Although he does not appear to have exploited deviations from CIP himself, Keynes' practical knowledge of the forward exchange market must have helped him to develop this theory, which first appeared in April 1922, almost three years after he started trading currencies.Footnote 53
More generally, Keynes mentioned in the Tract several reasons that might explain the persistence of anomalies on foreign exchange markets, including the limited amount of capital available for arbitrage and the high risk associated with it.Footnote 54 He believed that the profits gained by currency speculators rewarded them for their ability to allocate resources to arbitrage and to bear the risks of it and that they played a useful role as agents facilitating economic equilibrium.Footnote 55 Our results show that both naïve technical strategies and Keynes' discretionary fundamentals-based strategy alike required mobilizing capital and bearing substantial risks in order to turn a profit. Keynes experienced periods of considerable losses in both the 1920s and 1930s, which he could only withstand thanks to his ability to borrow funds from his social circle and to his own personal wealth. The implication is that Keynes' theory of foreign exchange speculation was almost certainly influenced by his own experience as a currency trader in the interwar period. Moreover, we can say that the intuition behind recent models seeking to explain the returns to currency speculation in terms of the reward for risk-taking and the limits to arbitrage were anticipated by the great economist's own writings.Footnote 56
Appendix
This appendix describes the methodology for computing the returns on carry and momentum strategies. The strategies are implemented on a sample of nine currencies during the January 1920–July 1939 period: the Belgian franc (BEF), the Swiss franc (CHF), the German mark (DEM), the Spanish peseta (ESP), the French franc (FRF), the Pound sterling (GBP), the Italian lira (ITL), the Dutch guilder (NLG), and the U.S. dollar (USD).
We denote s as the log of the spot exchange rate (in units of foreign currency per sterling pound) and f as the log of the one-month forward exchange rate (also in units of foreign currency per sterling pound). The forward discount is defined as the log difference between the forward and spot rate f – s.
Currency Excess Returns
The log excess return on buying a given currency in period t on the forward market and selling it on the spot market in period t + 1 (before transaction costs) is given by:

Using bid and ask exchange rate quotations, we compute currency excess returns adjusted for transaction costs. Following Lustig, Roussanov, and Verdelhan (Reference Lustig, Roussanov and Verdelhan2011), we define the log excess return of taking a long position in a given currency in period t net of transaction costs as:

where a and b subscripts refer to the bid and ask exchange rate quotations, respectively. Similarly, the net log excess return of taking a short position in a given currency is given by:

Spot rate bid-ask spreads are available across the whole period, while those for forward rates are first quoted in May 1922. We estimate forward bid-ask spreads in any given month from January 1920 to April 1922 by adding the mean difference between the forward and spot bid-ask spreads from May 1922 to December 1927 to the spot bid-ask spread at the month-end.
Ranking Currencies
In order to compute the strategies' returns, we construct monthly portfolios of currencies sorted on currency characteristics. At the end of each period t, we rank the nine currencies in our sample (including the GBP) according to carry and momentum criteria.
The CARRY strategy ranks currencies according to their forward discount against sterling: f – s. When CIP holds, the forward discount is equal to the interest rate differential: f – s = i∗ – i, where i∗ and i are respectively the foreign and domestic risk-free nominal interest rates over the same horizon as the forward exchange rate.
The MOM strategy ranks currencies by their spot exchange rate appreciation against sterling over the previous month: st-1 – st . We also explored the performance of a longer momentum strategy ranking currencies by their spot rate appreciation over the previous three months and these results are available upon request.
High Minus Low Strategies
For each currency strategy, we construct a High and a Low currency portfolio at the end of each period t. The High portfolio is formed from the two highest-ranking currencies and the Low portfolio from the two lowest-ranking currencies. We compute the log excess return on the High and Low portfolios, rxt+1 H and rxt+1 L respectively, by equally weighting the log excess returns on the individual currencies in each portfolio. The portfolios are rebalanced every month. Finally, we compute the monthly excess returns on the (“High minus Low”) currency strategy, rxt+1 HL , which takes a long position in the High portfolio and a short position in the Low portfolio at the end of each month:

One important characteristic of the carry, momentum “High minus Low” strategies is that they are zero-investment strategies, since they borrow in the lowest ranking currencies and invest in highest-ranking currencies. We can compare the returns on these strategies with excess returns on other asset classes, for example, U.K. stocks.