




No CrossRef data available.
Article contents
Assessment of spatial attention after brain damage with a dynamic reaction time test
Published online by Cambridge University Press: 21 October 2005
Abstract
Lateralized spatial biases after brain damage are commonly assessed using batteries of paper-and-pencil tests. These tests hardly allow quantification of performance in different locations in space, and they tend to lose sensitivity along the course of recovery. We tested the dynamic Starry Night Test (SNT), a novel computerized test measuring reaction time and detection accuracy for visual target stimuli in a dynamic background, in 32 inpatients with right hemisphere stroke (RHS), 16 patients with left hemisphere stroke (LHS), and 9 healthy controls. As a group, only the RHS patients were significantly slower to respond to contralesional targets. Individually, 21 (66%) RHS patients and 5 (31%) LHS patients showed statistically significant contralateral deficits. In a number of RHS patients the SNT was more sensitive to the ipsilesional bias of spatial attention than the Behavioral Inattention Test (BIT), a standardized paper-and-pencil test battery of unilateral spatial neglect. Two illustrative case reports show that the dynamic SNT, but not the BIT, was sensitive to the spatial deficit in recovered patients, one of whom was involved in repeated car accidents. The SNT overcomes serious shortcomings of paper-and-pencil tests of unilateral neglect. It provides a simple quantitative tool for monitoring the natural and treatment-induced recovery of patients. (JINS, 2005, 11, 697–707.)Part of the data was presented in abstract form at the EBBS EuroConference on Cognitive and Neural Bases of Spatial Neglect, September 14–17, 2000, Como, Italy.
Keywords
Information
- Type
- Research Article
- Information
- Journal of the International Neuropsychological Society , Volume 11 , Issue 6 , October 2005 , pp. 697 - 707
- Copyright
- © 2005 The International Neuropsychological Society
INTRODUCTION
Unilateral spatial neglect is one of the most frequent cognitive impairments following right-sided brain damage, notably stroke. Moreover, it is one of the most significant factors limiting the success of the rehabilitation process following stroke (Cherney et al., 2001; Denes et al., 1982; Katz et al., 1999; Kinsella & Ford, 1980). Despite the large number of interventions that have been shown to ameliorate neglect, at least on a temporary basis (Diamond, 2001; Pierce & Buxbaum, 2002), there is a striking paucity of rehabilitation modalities that have a documented long-term beneficial effect on the recovery and functional outcome of these patients (Frassinetti et al., 2002; I. H. Robertson, 1999a, 1999b). This results not only from theoretical uncertainty regarding the factors underlying the patients' ipsilesional bias in awareness and performance, but also from limitations of currently used methods of clinical assessment of unilateral neglect (Azouvi et al., 2002; Bowen et al., 1999; Kinsella et al., 1995; Pizzamiglio et al., 1992; Stone et al., 1992).
In the florid state of unilateral neglect, soon after the onset of stroke, patients may vividly demonstrate their deficit by failing to eat from the left side of their plate, or failing to find their room in the ward when it requires a left turn. However, these signs usually subside with time, to be replaced by subtler behavioral signs, which nevertheless impede the patient's progress (Mark, 2003). To formally assess and document unilateral neglect, clinicians and researchers typically make use of “paper-and-pencil” tests, including cancellation tasks of different sorts, line bisection tests, copying of shapes and figures, and drawing symmetrical figures like a clock face or a butterfly (Parton et al., 2004). A prototypic battery of such tests is included in the standardized Behavioral Inattention Test (BIT; Wilson et al., 1987). However, these tests suffer from several drawbacks.
First, the common tests do not change from one examination session to the next, and therefore allow for significant learning. Second, the fixed nature of the tests makes it hard to adjust their difficulty level, leading to ceiling effects. Third, they are static, and do not reflect the dynamic character of the natural environment, in which relevant stimuli occur, and need to be detected against an ongoing background of moving objects, changing shadows, and so forth, especially when the observer is in motion. These characteristics reduce the reliability and sensitivity of the tests and often lead to early “normalization” of their scores, when the patient may still demonstrate behavioral abnormalities in everyday life situations. A further weakness of the paper-and-pencil tests of the cancellation type is that for each point in space, the tests provide only a qualitative, usually binary score, of either hit or miss. This complicates statistical analysis, especially at the level of the single patient, which is a crucial requirement in the longitudinal assessment of the effectiveness of rehabilitation interventions. Furthermore, the score of cancellation tasks usually does not depict the relative difficulty with which it was achieved. Thus, a swift, orderly cancellation of an array of targets, and a time consuming, laborious, and haphazard performance may lead to the same score. The quantitative assessment of drawing tests is even more problematic given the diverse types of potential errors (Seki & Ishiai, 1996).
In contrast, measuring reaction times (RTs) in addition to accuracy provides continuous quantitative information about the spatial distribution of attention and performance (cf. Schendel & Robertson, 2002). Moreover, computerized RT assessments allow a degree of randomization and variability that attenuate somewhat the learning effects across repeated testing. Measuring RTs as a research tool in the context of studying unilateral neglect has already yielded important information either about normal attention mechanisms or about the status of attention in unilateral neglect. One line of research looked at the role of attention in visual search by measuring the speed of finding a target in a static array of stimuli, and contrasting targets defined by one feature with those defined by a conjunction of two features (e.g., Arguin et al., 1993; Behrmann et al., 2004; Eglin et al., 1989, 1991; Esterman et al., 2000; Grabowecky et al., 1993; Pavlovskaya et al., 2002; L.C. Robertson et al., 2003). Under the assumption that neglect is a prototypic attentional disorder, unilateral neglect was used to test the claim of the “feature integration theory” (Treisman & Gelade, 1980), arguing that detection of targets defined by single features is performed in parallel over the whole field and does not require attention. This assumption predicts that a “feature search” should not be affected in unilateral neglect. Results varied between studies, but at least in some the prediction was violated, questioning the distinction between preattentive and attentive search (see Behrmann et al., 2004; Geng & Behrmann, 2002 for review and discussion). In addition, these studies suggested that patients dwell on distractors in the intact side before they turn to scan the contralesional side (Eglin et al., 1989). In these studies, the exact location of the target in the left or right field was less emphasized. Rather, the main manipulation was the number of distractors in the field (for an exception, see Pavlovskaya et al., 2002, who did manipulate the position of the target in a study with a small number of patients, but concentrated on accuracy, rather than RTs). Also, with their basic research emphasis, the patient-by-patient correspondence with other neglect measurements was not at the focus of these studies, nor where they used to follow up the patient during recovery.
Another line of research, which is more akin to the present report, employed RTs to test the responsiveness of patients to visual stimulation at different degrees of laterality. Posner and colleagues (e.g., Posner et al., 1984, 1987) and Ladavas and colleagues (Ladavas, 1987, 1990; Ladavas et al., 1990) have used paradigms in which patients fixated centrally, and targets appeared in one of two or three predefined, horizontally aligned boxes. These studies have shown that, as a group, patients with right parietal damage and visual extinction are slower to respond to briefly displayed stimuli on the contralesional side, RTs are particularly slowed when preceded by ipsilesional spatial cues (Posner et al., 1984, 1987), and, within both hemifields, patients are slower to respond to the relatively more contralesional of two stimuli. The results support the view that patients' attention is abnormally drawn to the most ipsilesional stimulus in a display (Ladavas, 1990; Ladavas et al., 1990), and that the patients have a particular difficulty in disengaging attention from an ipsilesional location.a
The disengagement deficit was later localized more specifically to the temporo-parietal junction area (Friedrich et al., 1998).
To get a better assessment of the gradient of performance, Smania et al. (1998) used a row of LEDs that briefly flashed 10°, 20°, 30°, or 40° on either side of fixation. With this apparatus they were able to show that, as a group, patients with unilateral neglect (n = 8) showed a right-to-left decrease in detection accuracy in both hemifields, consistent with an attentional gradient theory of neglect (Kinsbourne, 1993; note though that the slope was much larger on the left hemifield). Whereas in control participants, RTs lengthen with increased eccentricity (e.g., Chelazzi et al., 1988), in patients with unilateral neglect, RTs were shorter at a laterality of 20° to the right of fixation than on 10°, and only thereafter increased. This led the authors to conclude that in their unilateral neglect patients, the directional bias reached its maximum at ∼20° to the right. However, the very low detection rate on the left side precluded the analysis of RTs on the left (neglected) side, and therefore the precise shape of any gradient in this critical sector of space could not be assessed. A better assessment of RTs on both sides, in a more limited span, was achieved in a detection test that required speeded response to white rectangles appearing along the horizontal meridian of a computer screen extending along 18° of visual angle (Anderson et al., 2000; Marzi et al., 2002). Unilateral neglect patients (n = 5) showed a gradual increase of RTs from right to left on the average. Because multiple responses were available for each range of positions, the authors were able to show that not only the mean RTs but also the variability of the responses increased from right positions to left positions.
These studies show the great potential of using RTs to investigate attention and performance in the context of unilateral neglect. They were however limited in the number of patients tested, limited mostly to the horizontal dimension, and they did not attempt a statistical analysis of individual biases nor a direct comparison to traditional clinical measures of unilateral neglect. Anton et al. (1988) and Beis et al. (1994) have gone in the direction of using computerized speeded detection tests as a clinical tool, using LED arrays extending up to 90° on each side. However, they reported only overall detection accuracy (mainly with bilateral stimuli) and no RTs, and they did not use any statistical measure to determine the existence of a deficit on the individual level. Thus, the power of RTs, as a continuous measure of performance, is currently not exploited enough as a clinical tool for monitoring the presence of a deficit, the gradients of performance, and the recovery process over time.
Here we report the results of a new test—the Starry Night Test (SNT)—for measuring the accuracy and speed of detection of target stimuli. The test probes not only the horizontal meridian, but also a rather dense two-dimensional array of spatial locations. Acknowledging the importance of background stimuli in determining performance (as discussed earlier; D'Erme et al., 1992), targets in our test appeared on the background of a dynamically changing field of distractors. This was assumed to enhance the sensitivity of the test, by increasing the competition for attention by occasional irrelevant changes in the display. We hypothesized that a randomly changing background imposes more challenge on the attentional system, and is also somewhat more similar to the natural scene than an empty or static field as previously used.
The SNT allows a detailed statistical assessment of spatial gradients of performance, and evaluation of the significance of changes in these gradients over time, at the individual level, as well as at the group level. As there is no gold standard for unilateral neglect, we compare performance on the SNT with performance on a widely used standardized battery of tests for unilateral neglect, the BIT (Wilson et al., 1987). We also present two short case reports, which, while being anecdotal in nature, illustrate the importance and potential of using this method. As shown in the brief review of the literature, RTs can shed light on important theoretical questions regarding normal and abnormal attention processes. Here however we concentrate on the potential of the test as a clinical assessment tool.
METHODS
Research Participants
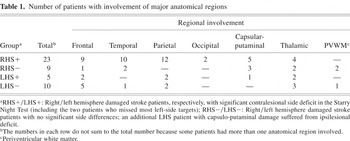
The participants in this study included: 32 patients with right hemisphere stroke [RHS; 8 women, 24 men; ages: 19–75 years, mean (± SD): 60 (± 10) years; 31 right handed; mean (± SD) Functional Independence Measure (FIM)b
The FIM is an 18-item ordinal scale, used to assess the functional status of patients within a rehabilitation setting. The FIM measures independent performance in self-care, sphincter control, transfers, locomotion, communication, and social cognition. By adding the points for each item, the possible total score ranges from 18 (lowest) to 126 (highest) level of independence (Granger, 1998).
Number of patients with involvement of major anatomical regions

Stimuli and Test Design
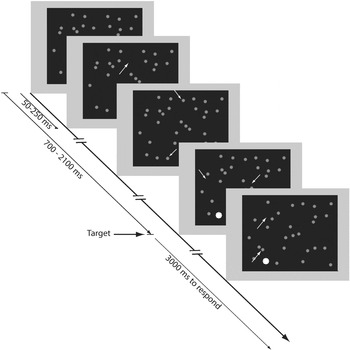
Stimuli were displayed on the background of the blackened screen of a 15” SVGA monitor placed at a distance of 100 cm from the eyes. Screen resolution was 640 × 480 pixels; viewing area was 28 cm (width) by 22 cm (height), 16° × 12° of visual angle. The screen was virtually divided into a Cartesian 7 × 7 grid. The grid itself was not visible. A single target, a bright red filled circle (0.22°), appeared randomly 700 to 2100 ms after the beginning of each trial in the center of one of the 49 virtual cells comprising the grid (Figure 1). The target remained on until the participant pressed the button or 3 seconds elapsed. The targets appeared on the background of a dynamically varying array of green circle distractors (diameter: 0.11°), which was maintained in the following manner: There were 49 potential distractors, each assigned to one of the cells of the grid. At the start of each trial, each of the distractors could be (randomly) visible (“on”) or invisible (“off”). With random intervals of 50–250 ms along the trial, one of the distractors was chosen at random, and its status was toggled (i.e., if it was on it was turned off and vice versa). Whenever a distractor was turned on its location within its cell was chosen randomly. Thus, distractors could appear anywhere on the screen, but the confinement of each distractor to one of the cells provided a relatively uniform distribution on the screen throughout the trial, preventing crowding in one part of the screen. Targets never overlapped a distractor. The overall appearance of the background was that of a twinkling, vanishing and appearing dots, which gave the test its “Starry Night Test” (SNT) nickname. Figure 1 presents black and white schematic snapshots of 5 time points along one trial.

Representative frames of one trial of the dynamic Starry Night Test (SNT). White arrows (not present in the real test) point to some places where a distractor (gray here, green in the real test) appeared or disappeared along the trial. The target (here in white, originally red) was embedded in the continuously changing background.
Procedure
The patients sat in their wheelchair (the control participants in an armchair) in a dimly lit room in the rehabilitation department, 100 cm from the computer monitor. They were instructed to look at the monitor and press a button on a response box (Psychology Software Tools, Inc., Pittsburgh, PA) as soon as, but not before, they detected the appearance of a red dot anywhere on the screen. RHS patients and controls used the index finger of their right hand and LHS patients used the index finger of their left hand. The response box was placed on a table mounted on the armrests of the wheelchair or on a sliding utility table hovering over the patients' lap. To more closely simulate normal conditions, fixation was not required but, to ensure that the participants did not divert their gaze constantly to one side of the screen, gaze position was monitored through a video camera directed at the participants' eyes. The test was interrupted if the participant slumbered or a constant gaze shift was noticed, although this was seldom needed. The experiment was controlled by Micro Experimental Lab (MEL) version 2.1 (Psychology Software Tools, Inc., Pittsburgh, PA), running on a personal computer.
Prior to the initiation of the test, the patients were shown examples of the distractor and target stimuli and it was confirmed that they could tell them apart. Next, they performed a training block of 49 trials, in which targets appeared (in random order) once in every cell of the grid. Following the training, the participants were presented with 490 trials. Each of the 49 cells of the grid was probed with a target 10 times, in random order. A few minutes rest was given after each block of 49 trials. A nonobtrusive but discernible tone (about 60 dB SPL) was played if the examinee failed to detect the target in the allowed temporal window of 3 seconds (“miss”), or if she or he responded before the target appeared or earlier than 100 ms after target onset (“false alarm”). Missed trials were not replaced. Target onset time and reaction time were logged with millisecond precision, taking into account the different locations of the targets on the screen relative to the vertical retrace of the monitor.
Data Reduction and Analysis
The RTs and accuracy (hit, miss) of the targets were logged for each trial along with the target location. For each individual examinee, response time outliers, deviating more than 2 standard deviations of the mean for each target location, were discarded to reduce the influence of rare aberrant events (cf. Anderson et al., 2000). Next, for each participant, the RTs at each grid location were averaged to yield 49 data points per participant. To compare groups, an ANOVA with one between subjects (Group) factor and one within subject (Side) factor was used after collapsing all right side and all left side responses separately for each participant. For individual statistical analysis, data from the 3 leftmost and the 3 rightmost columns of the grid were used to form left and right data sets, respectively, with 21 (3 × 7) data points on each side of the vertical meridian for each participant. Individual participants side differences were then compared using repeated measures Student's t test, comparing homologous locations on the two sides of the vertical meridian. A significance level of p = .05 (2-tailed) was used as a criterion for a lateralized bias. Thus, the critical t value for a significant left–right difference at the individual patient level was t(20) = 2.086.
RESULTS
Group Analysis
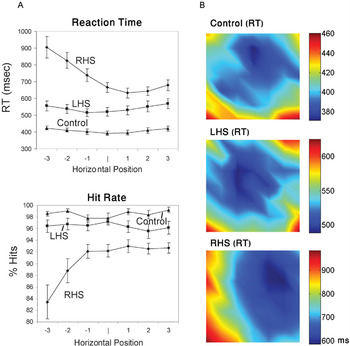
RHS patients responded more slowly overall than both the LHS and the control groups. The distribution of their response times across the display revealed a conspicuous slowing from right to left (Figure 2). An ANOVA with one between subject factor (Group: RHS, LHS, Controls) and one within subject factor (Side: Left, Right) revealed a main effect of Group (F(2,54) = 19.77, p < .0001), a main effect of Side (with slower RTs on the left, F(1,54) = 7.97, p < .01), and a significant interaction between these factors [F(2,54) = 15.49. p < .0001). Post-hoc tests for the group effect showed that RHS participants were significantly slower overall than both the LHS (p < .001, Scheffe correction) and the control group (p < .001), whereas the LHS patients were insignificantly slower than the control group. The main effect of side should be qualified by the significant interaction term. Indeed, planned comparisons showed that only RHS patients as a group displayed a significant side effect. Their average RT to left-sided targets (844 ms) was longer than to right-sided targets (658 ms), [t(31) = 6.091, p < .0001, 95% confidence interval for the difference between sides: 123 to 248 ms]. Neither the LHS group nor the normal control group displayed significant side differences.c
Although in a larger group of control participants there might be a tendency toward slightly faster responses on the left side (Deouell, Harrison, Ashbasugh, & Knight, unpublished observation), reminiscent of “pseudoneglect.”

(A, left): Horizontal gradients of performance. Reaction time and accuracy of right (RHS) and left (LHS) hemisphere damaged stroke patients and healthy controls. Each point represents the mean of one column of the grid. (B, right): Two-dimensional representation of the reaction times across the 2D grid. Note that different scales (right) were used for each group to highlight the gradients within each group.
Individual Analysis
The multitude of responses made by each participant enabled the assessment of the statistical significance of side differences in RT separately for each participant (see Methods section). Two RHS patients, who missed most of the left-sided targets altogether, were omitted from this analysis. Of the other 30 RHS patients, 21 (70%) had significantly (p < .05) prolonged RTs on the left side, whereas the rest had no significant difference. The BIT score of the subgroup with a significant RT side difference (M = 110.19, SD = 32.3) was significantly lower than in the subgroup of patients who did not display a significant RT side difference (M = 133.2, SD = 12.5), [t(28) = 2.06, p < .05]. The LHS patients, as a group, displayed no significant side difference. However, 5 (31%) of these patients responded significantly more slowly to right-sided (i.e., contralesional) targets and an additional patient responded more slowly to left-sided (ipsilesional) targets. These side differences (mean difference = 48 ms, SD = 42) were on a much lower scale than those found in the RHS patients (mean difference = 257 ms, SD = 152). None of the control participants showed any significant side difference.
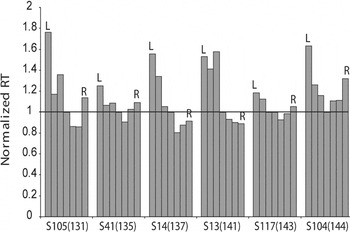
Six of the 12 RHS patients (50%) who scored within the normal range of the BIT (i.e., a score of 130 or more) showed, nevertheless, a significant side difference in the SNT. Figure 3 displays the horizontal gradient of RT in these six patients, relative to the RT in the center of the display. In contrast, only 3 out of 20 RHS (15%) patients with BIT scores lower or at the cut-off level for normality (BIT scores: 109, 117, 129), did not display a significant side difference in the Starry Night Test.

Horizontal reaction time (RT) gradients of 6 patients who scored normally on the BIT test, but were significantly worse on the left in the dynamic Starry Night Test. Each bar represents the mean of one column of the grid. BIT scores are given in parentheses next to the patients' identifiers. To provide a common scale, all reaction times are presented normalized by the reaction time at the center column.
Case Report 1: Recovery Pattern
LZ, a 49-year-old man, suffered a right parieto-temporal ischemic stroke, which resulted in left hemiplegia and hemihypoaesthesia. LZ was tested twice (8 weeks and 14 weeks post-onset) during the course of rehabilitation, and again 39 months after his stroke, when he came in for follow-up. Taking advantage of the statistical power of the dynamic SNT, the pattern of results was subject to significance testing. ANOVA of Side (Left/Right) × Time-after-onset (8 weeks, 14 weeks, 39 months) with RT as dependent measure, revealed significant main effects of side and time [Side: F(1,20) = 39, p < .0001; Time: F(2,40) = 19.9, p < .0001], and most importantly, a significant interaction between these two factors, [F(2,40) = 25.6, p < .0001]. Planned contrasts confirmed a significantly smaller side difference 14 weeks after the stroke, as compared to the 8 weeks test [345 vs. 628 ms; F(1,20) = 11.55, p < .003], and a significantly smaller side difference at the chronic stage (39 months) relative to the 14 weeks test [F(1,20) = 32.4, p < .0001]. These results statistically validate the patient's improvement. Moreover, whereas the initially abnormal BIT (125) has been normalized by the second test (137), the SNT, while showing a significant improvement, continued to show a significant side bias (345 ms longer for left-side targets), [t(20) = 5.91, p < .0001] (Figure 4a). Although the BIT showed no improvement (in fact it showed a slight decrease to 135)d
The patient scored the maximal score on all but the Letter Cancellation test, on which he missed an equal number of targets on the left and on the right.

Reaction times and hit rates of a patient (LZ) tested at three time points (8 weeks, 14 weeks, and 39 months post stroke) along recovery, presented at 2 levels of detail. (A) Reaction times on the right and on the left of the vertical meridian; (B) Reaction times collapsed across columns showing the change in the horizontal gradient. Negative numbers on the abscissa are to the left, positive numbers are to the right of the vertical meridian. Note the larger variability of RTs at the rightmost column in the late chronic stage. Error bars represent standard error of the mean.
The ANOVA also reveals an interesting pattern of recovery at the subacute stage. Notably, despite the fact that the side difference was significantly reduced from 8 to 14 weeks, as revealed by the interaction described earlier, pairwise comparisons across the levels of the Time factor show no difference between overall RTs between 8 and 14 weeks [F(1,20) = 1.18, n.s.]. This was due to the concomitant reduction of the patients' RTs on the left and the prolongation of RTs on the right (Figure 4a), resulting in a flattening of the RT spatial gradient (Figure 4b). Overall RTs were significantly shorter in the 39 months test relative to the 14 weeks test [F(1,20) = 18.11, p < .0001]. Yet, although RTs improved overall on the right as well as on the left from the 14 weeks to the 39 months test (Figure 4a), RTs on the rightmost column became longer with time (and also tended to have more variability, Figure 4b). This pattern suggests the combination of 3 pathologic mechanisms with different rates of recovery: reduced attention toward the left, hyperattention to the right (Kinsbourne, 1993), and a nonlateralized slowing (I.H. Robertson, 2001). A strategic shift of attention to the left due to training at rehabilitation might have been involved in the prolonged RTs on the extreme right, but this remains conjectural without proper control. To conclude this case, the SNT made it possible to record, with statistical rigor, the pattern of recovery across time in an individual patient, and to document changes in this pattern long after the BIT score has stabilized.
Case Report 2: Residual Occult Deficit
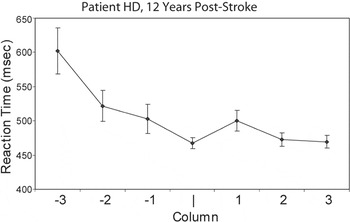
Patient HD (male, 50 years old) suffered a right temporo-parietal ischemic stroke 12 years prior to the current examination. Following the stroke, he showed mild hemiparesis, hemihypoaesthesia, and significant left visual neglect, with a BIT score of 119, which improved to 126 during the course of rehabilitation. He returned home completely independent in activities of daily living, walking unaided, and in time went back to partial time work at the family store. A year prior to the current examination, HD applied for and received back his driver's license, having shown intact visual fields at perimetry and no signs of neglect in activities of daily living according to his and his family's report. Since obtaining the license, however, he was involved in 9 car accidents, all concerning the left side of his car. Following the last accident, which caused mild bodily injury to his wife, he returned to the out-clinic for retesting. HD scored 143 (close to the maximal score) on his BIT test. However, as is evident in Figure 5, the dynamic Starry Night Test (which was not available on his first admission) revealed a significant slowing of responses to left-sided events as compared to right-sided events (t(20) = 3.191, p < .005). Thus, occult slowing in response to left-sided stimuli, which is undoubtedly a peril in driving, can go undetected and have detrimental consequences when using standard tests of vision and of unilateral neglect.

Horizontal reaction time (RT) gradient for patient HD, recorded 12 years after his stroke.
DISCUSSION
In this article we described a new behavioral test designed to assess the distribution of attention in 2-dimensional space in stroke patients, especially in the context of potential unilateral neglect. The dynamic Starry Night Test (SNT) was found to be feasible in a large group of hospitalized patients after stroke. The test required limited and readily available hardware and software resources, was conducted on the ward, lasted around 30 minutes, and was easily understood and tolerated by the patients. RHS patients showed a much larger prolongation of overall RTs, and especially a larger slowing on the contralesional side than LHS patients Although these group differences are congruent with current concepts of attentional deficits being more severe following right than left brain damage, a strictly hemispheric interpretation should be taken with caution here. A limitation of the current study is that lesion volumes and fine detailed anatomical involvement were not assessed. Moreover, only patients who could understand the task were included, and so the most severe aphasic patients with comprehension difficulties were not eligible. The fact that the patients of both groups were, nevertheless, not different in their functional independence at admission as measured by the standardized FIM, suggests that there was still no major selection bias toward more severe cases in any group. Nevertheless, future studies will have to assess the degree to which the major differences we observed between RHS and LHS patients depend on lesion distributions. Hence, the aim of our study and focus of our analysis is on the within group and individual analysis of the RHS patients.
The SNT provides the opportunity to quantify the patients' deficits, and subject their individual side biases to statistical scrutiny. It also allows the assessment of the significance and spatial pattern of an individual patient's recovery over time, as illustrated by Case Report 1. These merits, which are not provided by conventional paper-and-pencil tests, are invaluable for studies aimed at the appraisal of rehabilitation treatments, as well as experimental manipulations.
Perhaps because of its dynamic nature, and the addition of the RT as measure of performance, the SNT was more sensitive to side biases than the BIT, identifying significant side bias in half of the patients with normal BIT. This allows longer follow-up on the status of the patient, when the BIT becomes uninformative. The fact that a patient like HD (Case Report 2) who does not have a visual field deficit, and has “recovered” from unilateral neglect based on standardized conventional paper-and-pencil test batteries, can regain his or her driver's license while still failing a task like the SNT, is worrisome (Fisk et al., 2002; Sundet et al., 1995). It is exactly a prompt response to dynamic stimuli on the left that is most required in traffic, especially in countries where one drives on the right side of the road.
It should not be concluded that we are recommending the SNT as a remedy or replacement for all diagnostic purposes in unilateral neglect. Whereas all patients defined as suffering from unilateral neglect or extinction must have a bias toward worse performance in (relative) contralesional space, unilateral neglect is quite variable in its manifestation (Azouvi et al., 2002; Halligan & Marshall, 1992; Parton et al., 2004; Schubert & Spatt, 2001). Notably, in our study there was a small group of 3 patients who had abnormal BIT but did not show significant side differences in the SNT. Lacking a gold standard for unilateral neglect, it is hard to come to a conclusive interpretation of this discrepancy. One of the drawbacks of the BIT scoring system is that it does not reflect any lateral bias, whereas the SNT strictly does. Yet, this is unlikely to be the reason for the discrepancy in results of the two tests in these particular patients. Examining their BIT scores showed that their abnormal BIT score was not a result of overall reduction in performance, as they indeed missed more items on the left than on the right, especially in the letter cancellation and star cancellation subtests. It remains possible that fluctuations in performance seen in post-stroke patients are responsible for the discrepancy, although for at least 1 of the 3 participants, we had repeated measures of the star cancellation subtest of the BIT that consistently showed more misses on the left than on the right. Because the SNT and the BIT (as well as other paper-and-pencil tests) have many differences in their task requirements, it is quite possible that they do not entirely overlap in the functional deficit they tap. It is clear that assessment of unilateral neglect should still be done using multiple methods. This should not undermine the general good agreement between the two tests, and the special merits of tests like the SNT discussed herein.
As an exposition of the method, and for the sake of clarity and brevity, we presented here only an analysis of horizontal gradients provided by the new test. As is quite obvious from the figures, the data generated provides much more: analysis of altitudinal effects (Deouell et al., 2000), testing of predictions regarding the shape of the attention gradient in unilateral neglect (Heilman et al., 1987; Karnath, 1997; Kinsbourne, 1993), and testing of mathematical models of the distribution of attention (Anderson, 1996). As an experimental tool, the test also allows for considerable versatility in its implementation, manipulating features such as salience of the targets, salience of the distractors, the nature of target and distractors, and the time pressure imposed. These variations are now available in a newer version of the test and are being tested.e
The new version of the test runs on the platform of E-prime (Psychology Software Tools, Pittsburgh, PA). It will be available by request from the corresponding author.
From the theoretical point of view, several putative mechanisms may be responsible for the slow responses on the left in the RHS patients. One possibility is a distortion of a “saliency map” that renders left-sided targets less salient and therefore slows orienting toward the stimuli (Anderson, 1996; Marzi et al., 2002). Perhaps a simpler explanation is that the dynamic background creates a version of an “extinction situation” in which the patients fail to disengage from ipsilesional distractors (Posner et al., 1984). Yet another possible mechanism could relate to disturbed oculomotor movements in patients (Behrmann et al., 1997; Karnath, 1997). The two latter mechanisms may be related. A recent study has shown that saccades toward a contralateral target, in recovered unilateral neglect patients over 11 months post stroke, was slowed only when a central fixation cross was simultaneously present, presumably a result of failure to disengage from the fixation cross (Pflugshaupt et al., 2004). In addition, when exploring a static scene, these patients made their first saccade toward the right (ipsilesional) rather then the left (contralesional) side, whereas controls fixated first to the left. The patients in turn moved their gaze to the left and have spent more time on the left than controls did, yet did not achieve faster RTs on the left, possibly due to inefficient search (cf. Husain et al., 2001). The use of an eye-tracking device with the SNT could add important information in that respect, although its lack does not undermine the possibility of using the SNT to quantify and follow residual spatial biases regardless of their mechanism. Specifically, one of Pflugshaupt et al.'s (2004) important conclusions was that “recovered” patients (who showed normal performance in several standard tests of unilateral neglect) still show residual deficits when tested with an eye tracker. We show here that a residual deficit in finding and responding to contralesional events may show up also using simpler means.
To conclude, the current study and previous ones using RTs (e.g., Anderson et al., 2000; Laeng et al., 2002; Marzi et al., 2002; Sakashita, 1991; Smania et al., 1998) suggest that examination of stroke patients for the existence of unilateral neglect using traditional paper-and-pencil tests should be supplemented with measurement of RTs and accuracy in two dimensions (at least). The SNT presented here provides a powerful yet simple tool for clinicians, as well as researchers. Its dynamic nature makes it more akin to a natural nonstatic background, and may help in revealing subtle residual deficits, which may nonetheless be detrimental to the patients' outcome. Most importantly, the multitude of measurements across the field allows qualitative and quantitative assessment of the gradient of visuospatial performance, and its evolution along the recovery period. Such quantitative measures become crucial in the assessment of newly developed tools for rehabilitation of this major disabling condition.
References
REFERENCES
Anderson, B.
(1996).
A mathematical model of line bisection behaviour in neglect.
Brain,
119,
841–850.Google Scholar
Anderson, B.,
Mennemeier, M., &
Chatterjee, A.
(2000).
Variability not ability: Another basis for performance decrements in
neglect.
Neuropsychologia,
38,
785–796.Google Scholar
Anton, H.A.,
Hershler, C.,
Lloyd, P., &
Murray, D.
(1988).
Visual neglect and extinction—A new test.
Archives of Physical Medicine and Rehabilitation,
69,
1013–1016.Google Scholar
Arguin, M.,
Joanette, Y., &
Cavanagh, P.
(1993).
Visual-search for feature and conjunction targets with an
attention-deficit.
Journal of Cognitive Neuroscience,
5,
436–452.Google Scholar
Azouvi, P.,
Samuel, C.,
Louis-Dreyfus, A.,
Bernati, T.,
Bartolomeo, P.,
Beis, J.-M.,
Chokron, S.,
Leclercq, M.,
Marchal, F.,
Martin, Y.,
de Montety, G.,
Olivier, S.,
Perennou, D.,
Pradat-Diehl, P.,
Prairial, C.,
Rode, G.,
Sieroff, E.,
Wiart, L., &
Rousseaux, M.
(2002).
Sensitivity of clinical and behavioural tests of spatial neglect
after right hemisphere stroke.
Journal of Neurology Neurosurgery and Psychiatry,
73,
160–166.Google Scholar
Behrmann, M.,
Ebert, P., &
Black, S.E.
(2004).
Hemispatial neglect and visual search: A large scale
analysis.
Cortex,
40,
247–263.Google Scholar
Behrmann, M.,
Watt, S.,
Black, S.E., &
Barton, J.J.
(1997).
Impaired visual search in patients with unilateral neglect: An
oculographic analysis.
Neuropsychologia,
35,
1445–1458.Google Scholar
Beis, J.M.,
Andre, J.M., &
Saguez, A.
(1994).
Detection of visual-field deficits and visual neglect with
computerized light-emitting-diodes.
Archives of Physical Medicine and Rehabilitation,
75,
711–714.Google Scholar
Bowen, A.,
McKenna, K., &
Tallis, R.C.
(1999).
Reasons for variability in the reported rate of occurrence of
unilateral spatial neglect after stroke.
Stroke,
30,
1196–1202.Google Scholar
Chelazzi, L.,
Marzi, C.A.,
Panozzo, G.,
Pasqualini, N.,
Tassinari, G., &
Tomazzoli, L.
(1988).
Hemiretinal differences in speed of light detection in esotropic
amblyopes.
Vision Research,
28,
95–104.Google Scholar
Cherney, L.R.,
Halper, A.S.,
Kwasnica, C.M.,
Harvey, R.L., &
Zhang, M.
(2001).
Recovery of functional status after right hemisphere stroke:
Relationship with unilateral neglect.
Archives of Physical Medicine and Rehabilitation,
82,
322–328.Google Scholar
Denes, G.,
Semenza, C.,
Stoppa, E., &
Lis, A.
(1982).
Unilateral spatial neglect and recovery from hemiplegia: A follow-up
study.
Brain,
105,
543–552.Google Scholar
Deouell, L.Y.,
Sacher, Y., &
Soroker, N.
(2000).
Two dimensional gradients of attention to visual space in right
hemisphere damage patients: Results from a new dynamic test.
Paper presented at the EBBS EuroConference on Cognitive and
Neural Bases of Spatial Neglect, Como, Italy.
D'Erme, P.,
Robertson, I.,
Bartolomeo, P.,
Daniele, A., &
Gainotti, G.
(1992).
Early rightwards orienting of attention on simple reaction time
performance in patients with left-sided neglect.
Neuropsychologia,
30,
989–1000.Google Scholar
Diamond, P.T.
(2001).
Rehabilitative management of post-stroke visuospatial
inattention.
Disability and Rehabilitation,
23,
407–412.Google Scholar
Eglin, M.,
Robertson, L.C., &
Knight, R.T.
(1989).
Visual search performance in the neglect syndrome.
Journal of Cognitive Neuroscience,
1,
372–385.Google Scholar
Eglin, M.,
Robertson, L.C., &
Knight, R.T.
(1991).
Cortical substrates supporting visual search in humans.
Cerebral Cortex,
1,
262–272.Google Scholar
Esterman, M.,
McGlinchey-Berroth, R., &
Milberg, W.
(2000).
Preattentive and attentive visual search in individuals with
hemispatial neglect.
Neuropsychology,
14,
599–611.Google Scholar
Fisk, G.D.,
Owsley, C., &
Mennemeier, M.
(2002).
Vision, attention, and self-reported driving behaviors in
community-dwelling stroke survivors.
Archives of Physical Medicine and Rehabilitation,
83,
469–477.Google Scholar
Frassinetti, F.,
Angeli, V.,
Meneghello, F.,
Avanzi, S., &
Ladavas, E.
(2002).
Long-lasting amelioration of visuospatial neglect by prism
adaptation.
Brain,
125,
608–623.Google Scholar
Friedrich, F.J.,
Egly, R.,
Rafal, R.D., &
Beck, D.
(1998).
Spatial attention deficits in humans: A comparison of superior
parietal and temporal-parietal junction lesions.
Neuropsychology,
12,
193–207.Google Scholar
Geng, J.J. &
Behrmann, M.
(2002).
Selective visual attention and visual search: Behavioral and neural
mechanisms. In
D. Irwin (Ed.),
The psychology of learning and motivation (pp.
157–191).
New York:
Academic Press.
Grabowecky, M.,
Robertson, L.C., &
Treisman, A.
(1993).
Preattentive processes guide visual-search—Evidence from
patients with unilateral visual neglect.
Journal of Cognitive Neuroscience,
5,
288–302.Google Scholar
Granger, C.V.
(1998).
The emerging science of functional assessment: Our tool for outcomes
analysis.
Archives of Physical Medicine and Rehabilitation,
79,
235–240.Google Scholar
Halligan, P.W. &
Marshall, J.C.
(1992).
Left visuo-spatial neglect: A meaningless entity?
Cortex,
28,
525–535.Google Scholar
Heilman, K.M.,
Bowers, D.,
Valenstein, E., &
Watson, R.T.
(1987).
Hemispace and hemispatial neglect. In
M. Jeannerod (Ed.),
Neurophysiological and neuropsychological aspects of spatial
neglect (pp.
115–149).
Amsterdam:
North-Holland.
Husain, M.,
Mannan, S.,
Hodgson, T.,
Wojciulik, E.,
Driver, J., &
Kennard, C.
(2001).
Impaired spatial working memory across saccades contributes to
abnormal search in parietal neglect.
Brain,
124,
941–952.Google Scholar
Karnath, H.O.
(1997).
Spatial orientation and the representation of space with parietal
lobe lesions.
Philosophical Transactions of the Royal Society of London. Series B:
Biological Sciences,
352,
1411–1419.Google Scholar
Katz, N.,
Hartman-Maeir, A.,
Ring, H., &
Soroker, N.
(1999).
Functional disability and rehabilitation outcome in right hemisphere
damaged patients with and without unilateral spatial neglect.
Archives of Physical Medicine and Rehabilitation,
80,
379–384.Google Scholar
Kinsbourne, M.
(1993).
Orientation bias model of unilateral neglect: Evidence from
attentional gradients within hemispace. In
J.C. Marshall (Ed.),
Unilateral neglect: Clinical and experimental studies (pp.
63–86).
Hove:
Erlbaum.
Kinsella, G. &
Ford, B.
(1980).
Acute recovery from patterns in stroke patients: Neuropsychological
factors.
The Medical Journal of Australia,
2,
663–666.Google Scholar
Kinsella, G.,
Packer, S.,
Ng, K.,
Olver, J., &
Stark, R.
(1995).
Continuing issues in the assessment of neglect.
Neuropsychological Rehabilitation,
5,
239–258.Google Scholar
Ladavas, E.
(1987).
Is the hemispatial deficit produced by right parietal lobe damage
associated with retinal or gravitational coordinates?
Brain,
110,
167–180.Google Scholar
Ladavas, E.
(1990).
Selective spatial attention in patients with visual
extinction.
Brain,
113,
1527–1538.Google Scholar
Ladavas, E.,
Delpesce, M., &
Provinciali, L.
(1989).
Unilateral attention deficits and hemispheric asymmetries in the
control of visual-attention.
Neuropsychologia,
27,
353–366.Google Scholar
Ladavas, E.,
Petronio, A., &
Umilta, C.
(1990).
The deployment of visual attention in the intact field of
hemineglect patients.
Cortex,
26,
307–317.Google Scholar
Laeng, B.,
Brennen, T., &
Espeseth, T.
(2002).
Fast responses to neglected targets in visual search reflect
pre-attentive processes: An exploration of response times in visual
neglect.
Neuropsychologia,
40,
1622–1636.Google Scholar
Mark, V.W.
(2003).
Acute versus chronic functional aspects of unilateral spatial
neglect.
Frontiers in Bioscience,
8,
e172–189.Google Scholar
Marzi, C.A.,
Natale, E., &
Anderson, B.
(2002).
Mapping spatial attention with reaction time in neglect
patients. In
G. Vallar (Ed.),
The cognitive and neural bases of spatial neglect (pp.
275–288).
Oxford:
Oxford University Press.
Parton, A.,
Malhotra, P., &
Husain, M.
(2004).
Hemispatial neglect.
Journal of Neurology Neurosurgery and Psychiatry,
75,
13–21.Google Scholar
Pavlovskaya, M.,
Ring, H.,
Groswasser, Z., &
Hochstein, S.
(2002).
Searching with unilateral neglect.
Journal of Cognitive Neuroscience,
14,
745–756.Google Scholar
Pflugshaupt, T.,
Bopp, S.A.,
Heinemann, D.,
Mosimann, U.P.,
Von Wartburg, R.,
Nyffeler, T.,
Hess, C.W., &
Muri, R.M.
(2004).
Residual oculomotor and exploratory deficits in patients with
recovered hemineglect.
Neuropsychologia,
42,
1203–1211.Google Scholar
Pierce, S.R. &
Buxbaum, L.J.
(2002).
Treatments of unilateral neglect: A review.
Archives of Physical Medicine and Rehabilitation,
83,
256–268.Google Scholar
Pizzamiglio, L.,
Bergego, C.,
Halligan, P.,
Homberg, V.,
Robertson, I.,
Weber, E.,
Wilson, B.,
Zoccolotti, P., &
Deloche, G.
(1992).
Factors affecting the clinical measurement of visuo-spatial
neglect.
Behavioral Neurology,
5,
233–240.Google Scholar
Posner, M.I.,
Walker, J.A.,
Friedrich, F.J., &
Rafal, R.D.
(1984).
Effects of parietal injury on covert orienting of attention.
Journal of Neuroscience,
4,
1863–1874.Google Scholar
Posner, M.I.,
Walker, J.A.,
Friedrich, F.A., &
Rafal, R.D.
(1987).
How do the parietal lobes direct covert attention?
Neuropsychologia,
25,
135–145.Google Scholar
Robertson, I.H.
(1999a).
Cognitive rehabilitation: Attention and neglect.
Trends in Cognitive Sciences,
3,
385–393.Google Scholar
Robertson, I.H.
(1999b).
Setting goals for cognitive rehabilitation.
Current Opinions in Neurology,
12,
703–708.Google Scholar
Robertson, I.H.
(2001).
Do we need the “lateral” in unilateral neglect?
Spatially nonselective attention deficits in unilateral neglect and their
implications for rehabilitation.
Neuroimage,
14,
S85–90.Google Scholar
Robertson, L.C.,
Knight, R.T., &
Eglin, M.
(2003).
Grouping influences in unilateral visual neglect.
Journal of Clinical and Experimental Neuropsychology,
25,
297–307.Google Scholar
Sakashita, Y.
(1991).
Visual attentional disturbance with unilateral lesions in the basal
ganglia and deep white matter.
Annals of Neurology,
30,
673–677.Google Scholar
Schendel, K.L. &
Robertson, L.C.
(2002).
Using reaction time to assess patients with unilateral neglect and
extinction.
Journal of Clinical and Experimental Neuropsychology,
24,
941–950.Google Scholar
Schubert, F. &
Spatt, J.
(2001).
Double dissociations between neglect tests: Possible relation to
lesion site.
European Neurology,
45,
160–164.Google Scholar
Seki, K. &
Ishiai, S.
(1996).
Diverse patterns of performance in copying and severity of
unilateral spatial neglect.
Journal of Neurology,
243,
1–8.Google Scholar
Smania, N.,
Martini, M.C.,
Gambina, G.,
Tomelleri, G.,
Palamara, A.,
Natale, E., &
Marzi, C.A.
(1998).
The spatial distribution of visual attention in hemineglect and
extinction patients.
Brain,
121 (Pt 9),
1759–1770.Google Scholar
Stone, S.P.,
Patel, P.,
Greenwood, R.J., &
Halligan, P.W.
(1992).
Measuring visual neglect in acute stroke and predicting its
recovery: The visual neglect recovery index.
Journal of Neurology Neurosurgery and Psychiatry,
55,
431–436.Google Scholar
Sundet, K.,
Goffeng, L., &
Hofft, E.
(1995).
To drive or not to drive: Neuropsychological assessment for
driver's license among stroke patients.
Scandinavian Journal of Psychology,
36,
47–58.Google Scholar
Treisman, A. &
Gelade, G.
(1980).
A feature-integration theory of attention.
Cognitive Psychology,
12,
97–136.Google Scholar
Wilson, B.,
Cockburn, J., &
Halligan, P.
(1987).
Development of a behavioral test of visuospatial neglect.
Archives of Physical Medicine and Rehabilitation,
68,
98–102.Google Scholar
Number of patients with involvement of major anatomical regions
Representative frames of one trial of the dynamic Starry Night Test (SNT). White arrows (not present in the real test) point to some places where a distractor (gray here, green in the real test) appeared or disappeared along the trial. The target (here in white, originally red) was embedded in the continuously changing background.
(A, left): Horizontal gradients of performance. Reaction time and accuracy of right (RHS) and left (LHS) hemisphere damaged stroke patients and healthy controls. Each point represents the mean of one column of the grid. (B, right): Two-dimensional representation of the reaction times across the 2D grid. Note that different scales (right) were used for each group to highlight the gradients within each group.
Horizontal reaction time (RT) gradients of 6 patients who scored normally on the BIT test, but were significantly worse on the left in the dynamic Starry Night Test. Each bar represents the mean of one column of the grid. BIT scores are given in parentheses next to the patients' identifiers. To provide a common scale, all reaction times are presented normalized by the reaction time at the center column.

Reaction times and hit rates of a patient (LZ) tested at three time points (8 weeks, 14 weeks, and 39 months post stroke) along recovery, presented at 2 levels of detail. (A) Reaction times on the right and on the left of the vertical meridian; (B) Reaction times collapsed across columns showing the change in the horizontal gradient. Negative numbers on the abscissa are to the left, positive numbers are to the right of the vertical meridian. Note the larger variability of RTs at the rightmost column in the late chronic stage. Error bars represent standard error of the mean.
Horizontal reaction time (RT) gradient for patient HD, recorded 12 years after his stroke.
 You have
Access
- 90
- Cited by