Introduction
Breast cancer remains at high incidence rate of female cancer worldwide. 1 In Hong Kong, breast cancer ranked at first incidence rate for female cancer and the third for all cancers in Hong Kong regarding the latest statistic from Hong Kong Cancer Registry. 2 Though the incidence rate is high, it is fortunate that the 5-year survival rate of breast cancer is up to 99.3% with multi-modality treatment. 2
Adjuvant radiotherapy plays an important role in treating breast cancer. With the development of radiotherapy technique, treating breast cancer is changing from two-dimensional (2D) radiotherapy technique to three-dimensional (3D) radiotherapy, then to intensity-modulated radiotherapy (IMRT). Helical TomoTherapy® (HT) is one of the most advanced IMRT techniques to treat breast cancer patient around the world.
Various studies had already been conducted to compare the dosimetric differences among different radiotherapy techniques, including 3DCRT, IMRT, VMAT and HT for breast cancer patients. Reference Haciislamoglu, Colak and Canyilmaz3–Reference Ashenafi, Boyd and Lee6 They have got all similar results that HT was the best in terms of target conformity and homogeneity. HT could also reduce the maximum dose but at the same time increase the low dose volume of some critical organs, which meant a higher risk in secondary malignancy. In a dosimetric comparison among these techniques focusing on the left-sided whole-breast irradiation, HT showed the best target conformity and homogeneity. Reference Haciislamoglu, Colak and Canyilmaz3 Compared with 3DCRT and IMRT plans, HT had the lowest maximum dose to the heart and left anterior descending (LAD) artery but obtained a higher heart dose in V5 and V10. Moreover, HT plan obtained the lowest mean heart dose (MHD) in relative to IMRT and VMAT. Reference Haciislamoglu, Colak and Canyilmaz3 Another dosimetric and clinical review of HT also pointed out that the HT achieved a better target coverage and homogeneity as well as a smaller fraction V20 in the lung and V35 in the heart compared with conventional 3DCRT and IMRT for patient irradiating the chest wall with lymphatic nodes. Reference Rong and Welsh4 However, the long treatment time raised the concern of using TomoTherapy® as a management radiotherapy technique for breast cancer patient.
Dynamic jaw (DJ) mode in Helical TomoTherapy® (HT) is a new feature firstly introduced in ASTRO 2012 by Accuray®. This technique allows the jaws to move continuously during the treatment. Reference Chen, Chen, Chen and Lu7 In older generation of Tomotherapy®, the jaws were fixed and its opening was used to determine the beam width. The treatment beam was mainly modulated by the binary multileaf collimator. Since the jaws were fixed during the treatment, a complete field width was needed to irradiate at the cranial and caudal end of the part. To minimise the cranio-caudal dose penumbra, a narrower field width was used.
DJ mode enables the independent jaw to adapt the field width dynamically at the cranial and caudal edges of a target, which is also named the running-start-stop (RSS) delivery. When the superior edge of the target goes into the radiation field projected by the inferior jaw, the radiation is on. The superior jaw then moves with the edge of the tumour until the maximum opening width of the jaws. The field width and the jaws position remain constant when the target is gone through the fan beam with the couch moves constantly in z direction. When reaching the distal end of the target, the inferior jaw stays at the edge until it reaches the superior jaw. With these moving jaws, the dose can be sharper at the superior edge and the distal end of target. As a result, the normal tissue sparing can be better by the sharper dose fall off at the cranio-caudal edge of target.
Several studies confirmed that DJ mode can improve the cranio-caudal dose distribution without prolonging the treatment time in treating different types of cancers including head and neck, lung, liver, brain, prostate, breast and paediatric cancer. Reference Chen, Chen, Chen and Lu7–Reference Geng, Lam, Kong, Cheung and Yu11 Some of these studies also suggested that the benefit of DJs could counterbalance the penumbra induced in a wider field width, so that a DJ5.0 with a significant time reduction could replace FJ2.5. Reference Chen, Chen, Chen and Lu7,Reference Fetzner, Aynsley and Beck9–Reference Geng, Lam, Kong, Cheung and Yu11
Yet, the study on breast cancer with supraclavicular fossa (SCF) nodal involvement using DJ Mode in HT is limited. This study aims to evaluate the DJ mode retrospectively by comparing their dosimetric quality with normal tissue complication probability (NTCP) of organs at risk (OARs) and treatment delivery time with FJ mode on treating left-side breast with SCF nodal involvement.
Materials and Methods
Subject recruitment
Post-mastectomy female patients, who had been irradiated for left-side breast with SCF nodal involvement and planned under HT using DJ Mode with 2.5 cm Field Width (FW), from November 2014 to August 2016, at the Department of Radiotherapy in Hong Kong Sanatorium & Hospital, were selected retrospectively for this study. The recruitment also included all the patients with or without IMC involvement. All the planning CT sets, dose prescription, the approved contour of target and OAR as well as the treated TomoTherapy® HD plans from these patients were retrieved and used in this study.
CT data acquisition for original plans
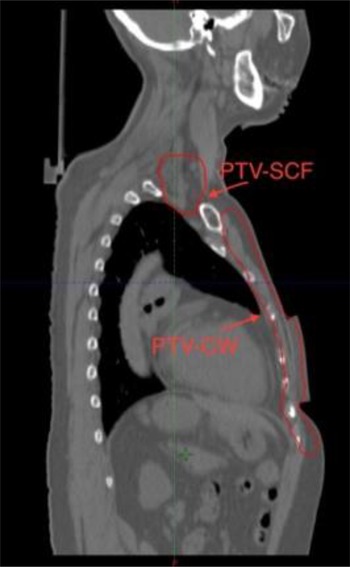
All patients were immobilised by a tailor-made Vac-lokTM with both arms overhead and undergone a CT scan using SOMATOM Definition Edge, Siemens®. All image sets were first sent to the Eclipse® TPS for manual contouring. The oncologists delineated all the target volumes and the radiation therapist delineated all OARs. For the planning target volume (PTV), there were two: one for chest wall (CW) and another for SCF, which are illustrated in Figure 1. In the remaining paragraphs, PTV-CW and PTV-SCF were used as notation. After contouring, the CT image sets were transferred to the TomoTherapy® HDA TPS for treatment planning.
Example of PTV contouring in sagittal view.

Treatment planning
All patient data were used to compute for two extra HT plans under TomoTherapy® HDA TPS, which allows DJ mode setting. These two extra HT plans were planned under the same TPS of treated plan. All original contoured structures of the treated TomoTherapy® plan, included all target volumes and OARs, were used for optimisation without modification in the two extra HT plans.
Fine grid calculation, pitch value of 0.287 and the same modulation factor of the treated TomoTherapy® plans were applied in all plans to keep the consistency for the same patient. For the two extra HT plans, 2.5 cm FW using FJ mode (FJ2.5) and 5.0 cm FW using DJ mode (DJ5.0) were used. All plans were optimised with the same dose requirement and dose constraints requested by oncologists as the treated TomoTherapy® plans. Maximum dose and dose–volume histogram (DVH) objectives were defined and regulated during optimisation for target volumes and OARs with differential penalties to meet a uniform and adequate target volume coverage with maximum OAR sparing as prescribed. A minimum of 300 up to a maximum of 500 iterations were run for the plans. Optimisations stopped once the dose requirements and dose constraints had reached the oncologist’s requirement after 300 iterations.
Plan evaluation
D95, usually a prescription point and homogeneity index (HI) of PTV, with the recommendation of ICRU Report 83 in 2010 was used to evaluate and compare among plans.
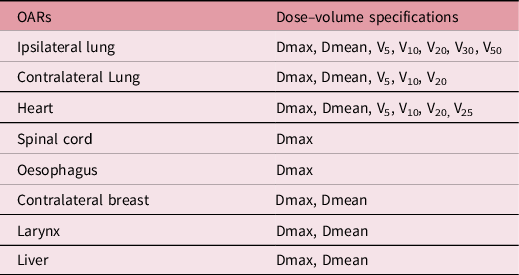
Few dose–volume physical points of OARs, suggested by ICRU Report 50, 62 and 83, were chosen for comparison and illustrated in Table 1.
Dose–volume specifications for OAR suggested by ICRU report 50, 62 and 83

Other than the physical point doses derived from DVH, Niemierko’s gEUD-based normal tissue complication probability (NTCP) of the heart and lung is used to evaluate the plan in radiobiological aspect. All NTCP was also calculated using MATLAB®, a high-level computer programming language, with the code of Niemierko’s gEUD-based NTCP model created by Gay and Niemierko was used for NTCP calculation Reference Gay and Niemierko12 . The normal tissue parameters used in the programme were based on QUANTEC and Emami et al, shown in Table 2. Reference Gay and Niemierko12,Reference Emami13 All these parameters were limited to conventional dose scheme (1.8–2.0 Gy).
Parameters used in NTCP calculation Reference Gay and Niemierko12,Reference Emami13

Apart from the dosimetric value of the plan, the treatment delivery time is also a concern for the plan. In addition, actual modulation factor (MF) is also used for analysis. The actual MF reflects of how complicated the MLC pattern of the plan is. It not only affects the treatment delivery time, but also reflects the demand of MLC of the machine.
Results
Patient characteristic
In total, 14 female patients were recruited and 42 plans were compared in this study. All these patients, with staging group from IIb to IIIa based on the UICC staging system, underwent post-mastectomy radiotherapy from November 2014 to August 2016, at the Department of Radiotherapy in HKSH. The size range of PTV-CW is 279.1–727.5cc and PTV-SCF is 70.6–215.9cc.
Dosimetric comparison of planning target volume (PTV)
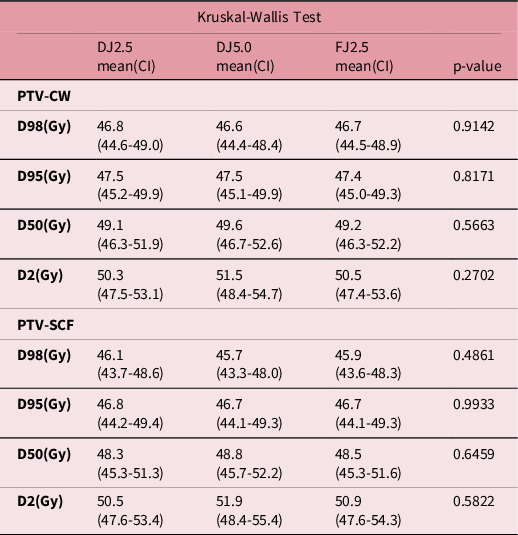
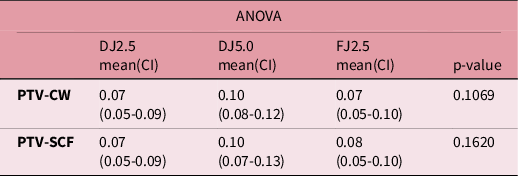
No statistically significant difference was found in D2(PTV-CW:p = 0·27; PTV-SCF:p = 0·58), D50(PTV-CW:p = 0·56; PTV-SCF:p = 0·65), D95(PTV-CW:p = 0·82; PTV-SCF:p = 0·99), D98(PTV-CW:p = 0·91; PTV-SCF:p = 0·49) and HI(PTV-CW:p = 0·1; PTV-SCF:p = 0·16) of PTV among three optimisation modes (Tables 3 and 4).
Summary of Kruskal-Wallis Test Result with different dose-volume specifications for PTV

Abbreviation: CI=confident interval (suggested to be included in reporting by ICRU Report 83)
The ANOVA result of Homogeneity Index (HI) of PTV-CW and PTV-SCF

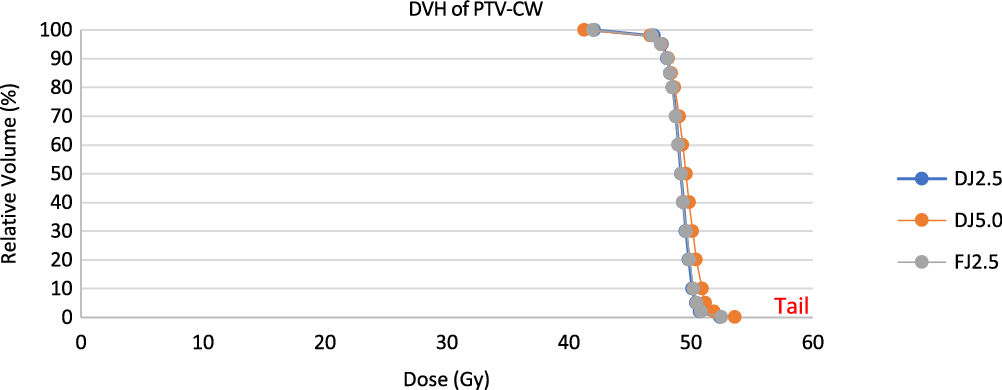
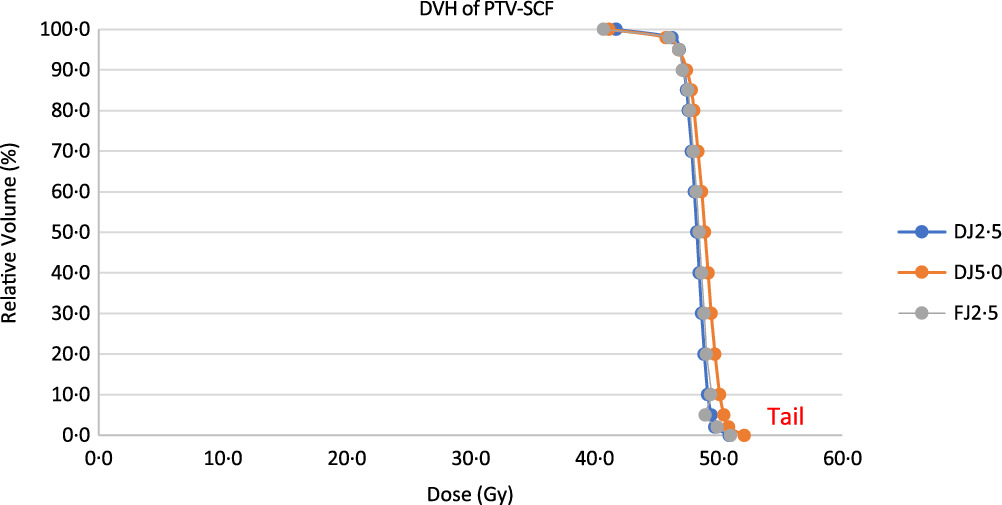
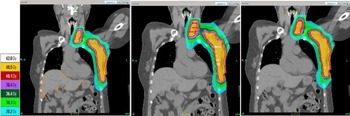
However, the gradient in DJ5.0 was not as sharp as DJ2.5 and FJ2.5, resulting in the longer ‘tail’ of DVH in DJ5.0 (Figures 2 and 3). More hotspots were produced in DJ5.0 (Figure 4). Numerically, D2 in DJ5.0 was at least 1 Gy higher than that in DJ2.5 and FJ2.5 for both PTV-CW and PTV-SCF. It also causes DJ5.0 the highest in average HI among three modes.
The averaged DVH of PTV-CW for three optimisation modes.

The averaged DVH of PTV-SCF for three optimisation modes.

The dose distribution for patient03 (left to right: DJ2.5, DJ5.0, FJ2.5).

Dosimetric comparison on sparing of organs at risk (OARs)
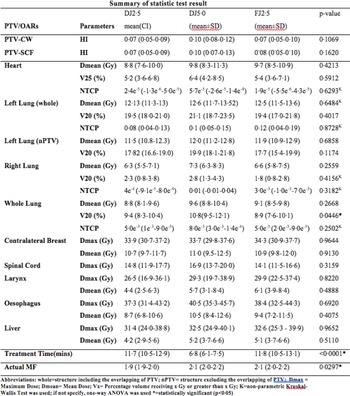
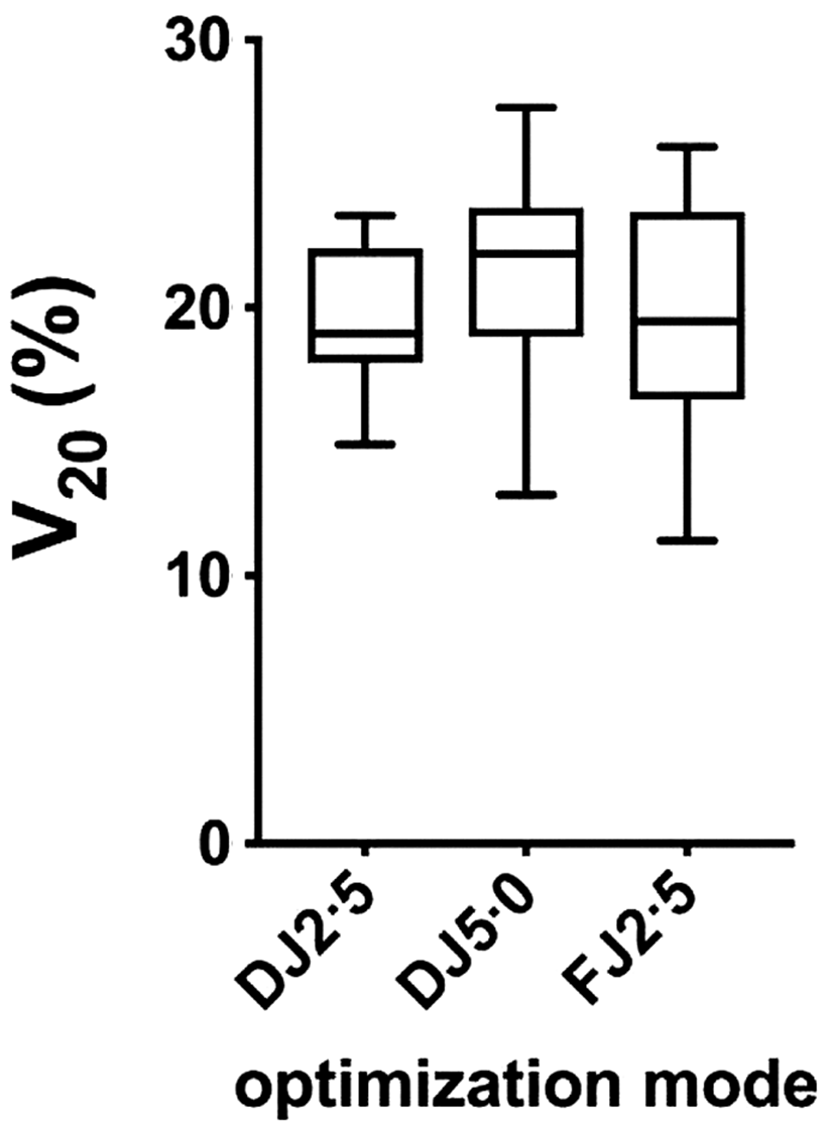
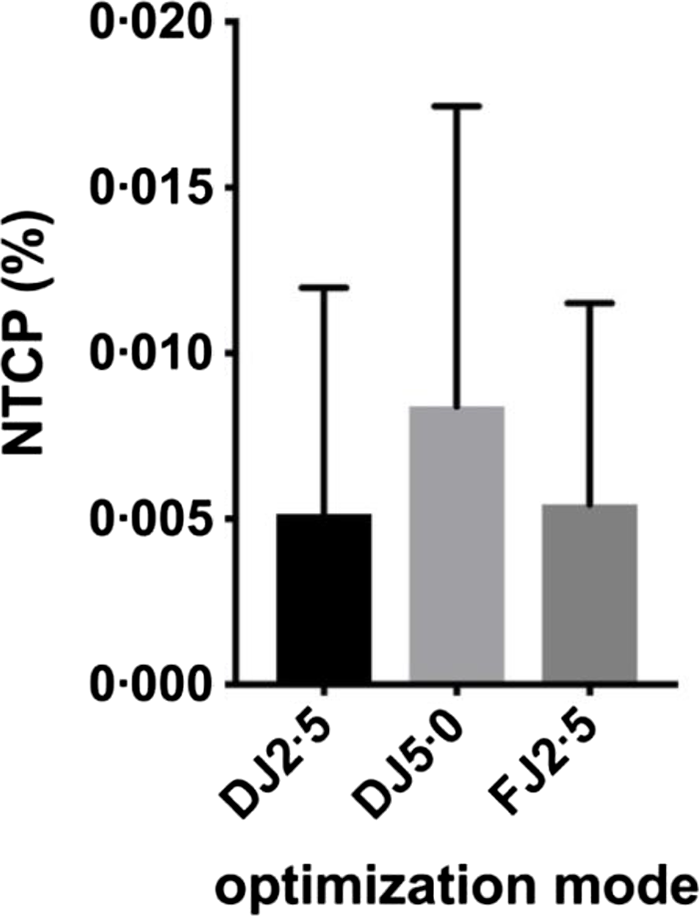
Lung, heart, contralateral breast, spinal cord, oesophagus, larynx and liver were the OARs concerned in this study. Regarding the dose–volume parameters of these OARs, there was no statistically significant difference found among three optimisation modes, except for V20 for whole lung with p = 0.0446 (Figure 5). Concerning the average V20, DJ5.0 received more volume of 20 Gy in ipsilateral left lung than FJ2.5 and DJ2.5. The average V20 of DJ5.0 plans for left lung (whole) was even higher than 20%, while others were below 20%. In fact, there were some plans for left lung (whole) among three optimisation modes which couldn’t keep V20 < 20%, but <24%. Five out of 42 plans had V20 of left lung (whole) exceeding 24%. However, the NTCP of lung was approximately 0%. No significant difference in radiobiological effect was found (p-value > 0.05) (Figure 6).
Summary of statistic test result with different dose–volume specifications for OARs suggested by ICRU report 50, 62 and 83.

Box-and-whisker plot of V20(%) of left lung (whole).

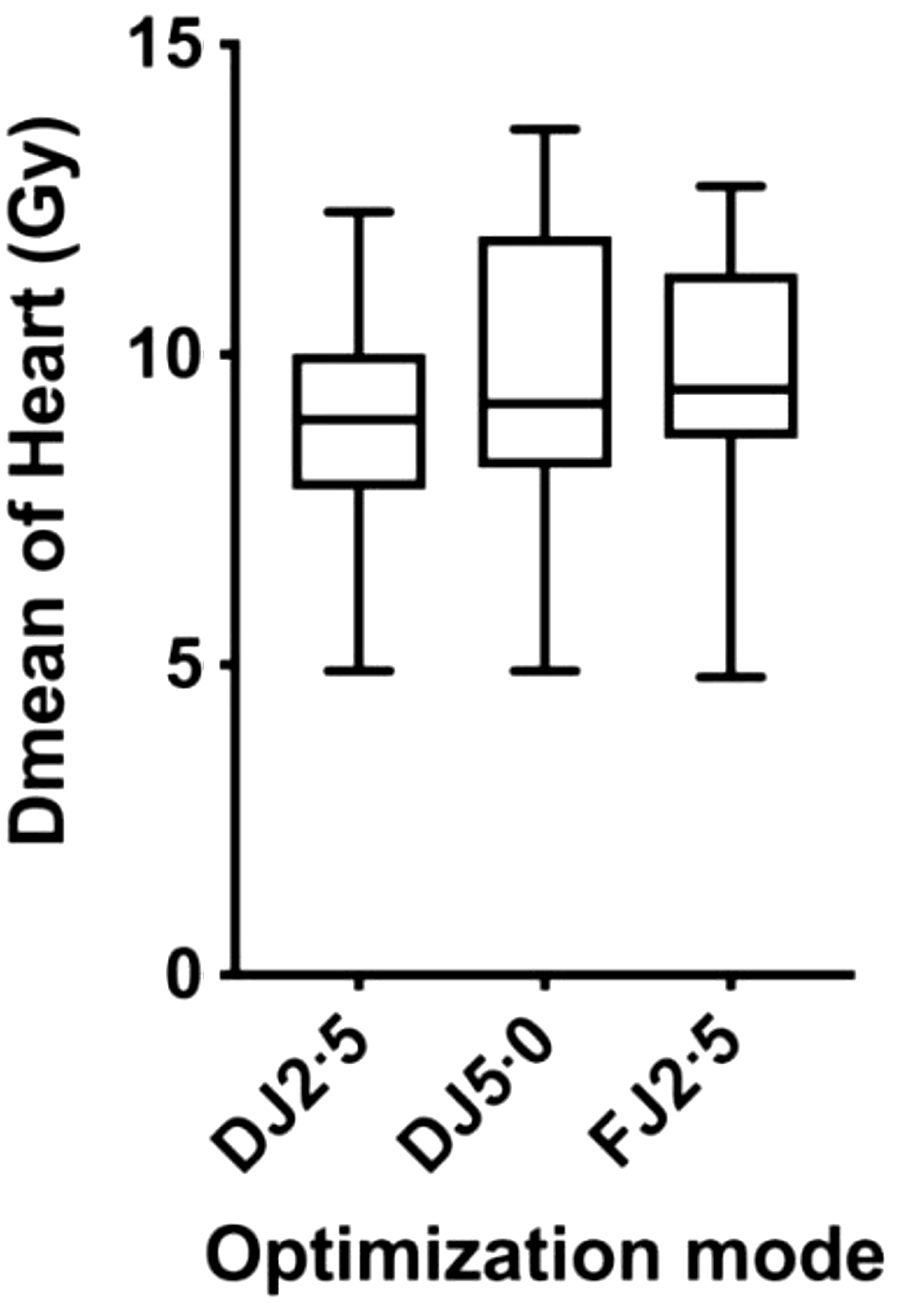
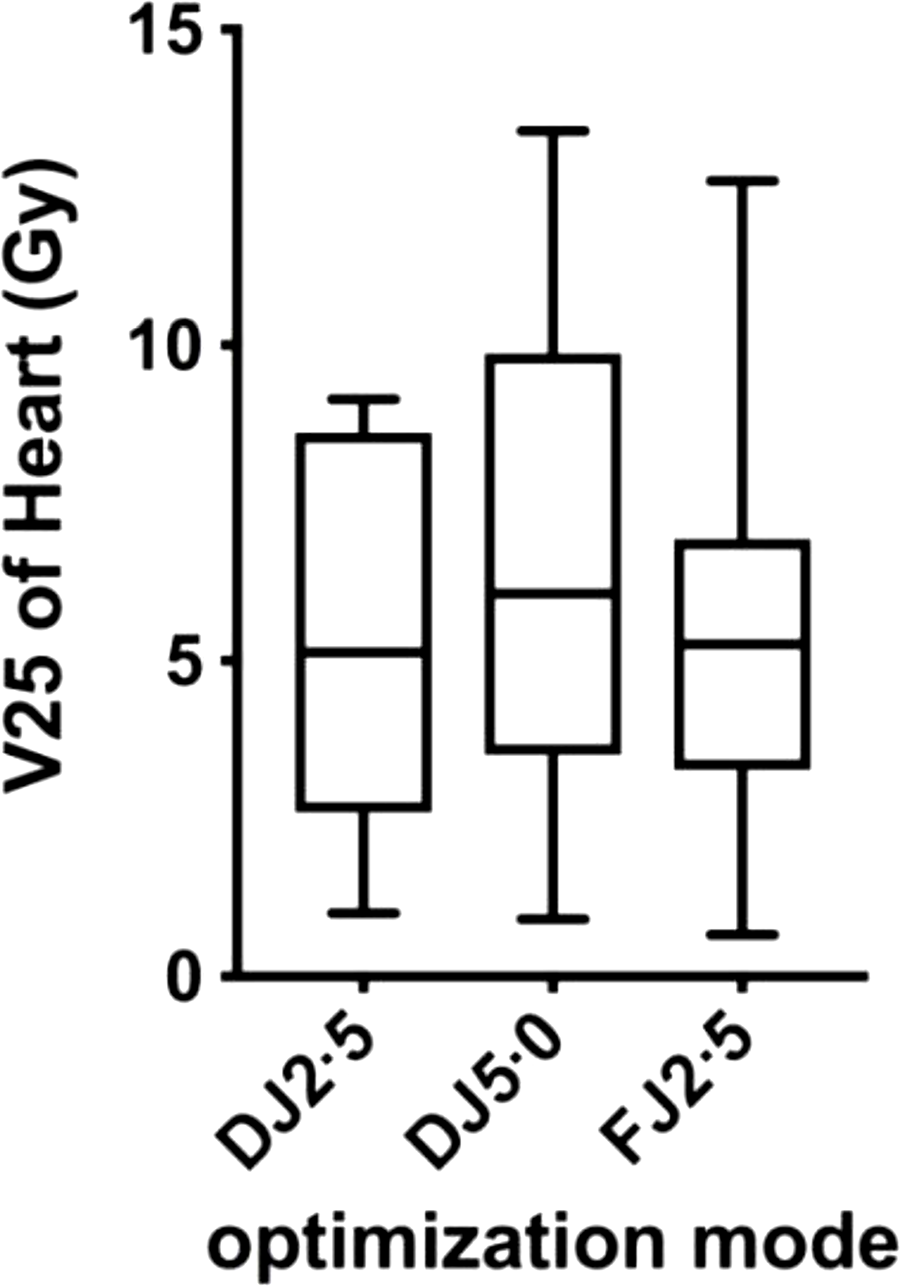
MHD and V25 of the heart were associated with the risk of cardiac complications. DJ2.5 had the lowest value in these two parameters. For V25 of the heart, three out of 14 with DJ5.0 plans (V25 = 10.6%;10.7%;13.4%) and one out of 14 with FJ2.5 plans (V25 = 12.6%) exceeded 10%. Also, DJ5.0 had a relatively higher risk of cardiac complication in terms of NTCP (Figure 7). However, it was important to note that all NTCP of the heart for all plans was close to 0%, which was clinically insignificant in radiobiological aspect. Numerically, DJ2.5 spared the heart the most among the three optimisation modes (Figures 8 and 9).
NTCP (%) of whole lung.

Box-and-whisker plot MHD of heart (Gy).

Box-and-whisker plot of V25(%) of heart.

Comparison of treatment delivery time
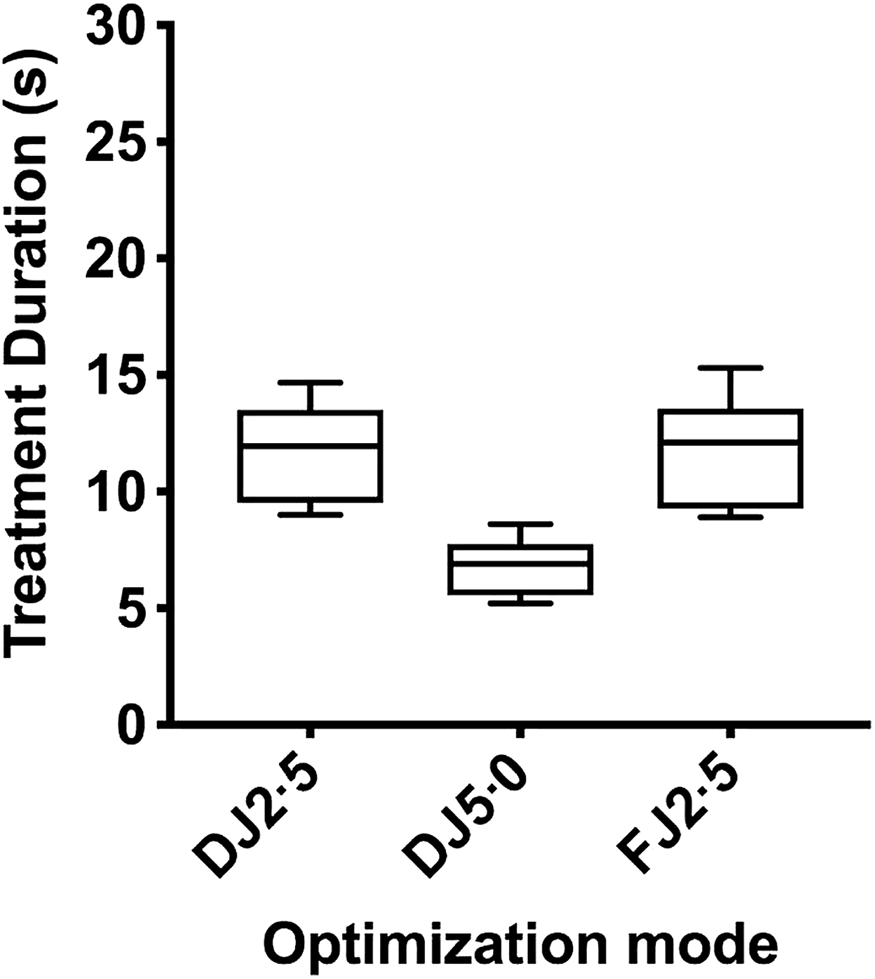
The treatment duration was given and recorded in the TomoTherapy® TPS. DJ5.0 provided the shortest treatment delivery duration as expected. It only takes 6.8±1.2 (mins) for DJ5.0 compared with an average 11.7±2.1 (mins) for DJ2.5 and 11.8±2.3 (mins) for FJ2.5. DJ5.0 reduces the delivery duration to almost half when compared with use of 2.5 cm field width for both jaws modes. The treatment duration of DJ5.0 was significantly shorter than that of FJ2.5 and DJ2.5, while no significant difference was found between FJ2.5 and DJ2.5.
Comparison of actual modulation factor (MF)
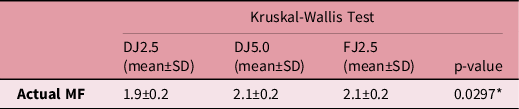
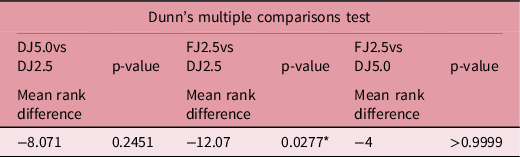
Based on the statistical test results illustrated in Tables 5 and 6, the actual MF was significantly different among three optimisation modes.
Kruskal-Wallis Test for comparing actual modulation factor (MF) among different optimization modes

* indicates statistically significant p<0.05
Dunn’s multiple comparisons test for comparing actual modulation factor (MF) among different optimization modes

* indicates statistically significant p<0.05
Statistically, the actual MF of DJ2.5 is significantly lower than that of FJ2.5 with the mean rank difference of −12.07 and p = 0·027 < 0·05, while others show no significant difference (p > 0·05). Though no significant difference is shown on actual MF of DJ5.0 and DJ2.5, the actual MF of DJ2.5 is comparatively lower than DJ5.0. No difference was found between the actual MF of FJ2.5 and DJ5.0.
Discussion
The use of DJ Mode in HT in other studies for other regions, e.g. the head and neck, had proved to have a better sparing for superior and inferior OARs from the target. Some studies also suggested that DJ5.0 could replace the FJ2.5 for shortening the treatment duration. The result of current study corresponded that the dose distribution of target and the sparing of OARs had improved by using DJ Mode, given that the same field width was applied. However, the result of current study questioned about the substitution of FJ2.5 by DJ5.0.
Based on the result for current study, the target homogeneity in DJ5.0 was the worst while that in FJ2.5 and DJ2.5 were comparable. The increase in the volume of hotspot and maximum absorbed dose, presented by the highest D2 of both PTV-CW and PTV-SCF, leads the deteriorating homogeneity. With a wider 5.0 cm field width, larger penumbra was induced and affected the homogeneity of plan.
One of the signatures about DJ mode is that the dose to the OARs superior and inferior to the target can be reduced for a better protection. Differing from some cancers, such as nasopharyngeal carcinoma (NPC), breast cancer doesn’t have a lot of important OARs located superior and inferior to the targets. Larynx and liver are the closest OARs located superior to SCF and inferior to CW. From this study, the dose superiority of DJ mode was not as significant as other studies. The maximum dose of the liver and larynx, usually located at the edge which is closer to the PTV, was reduced slightly in DJ mode giving that same field width was applied. Even there was an increase in field width, Dmax of the larynx and liver was not increased but comparable. However, a small volume of high dose to the larynx and liver doesn’t harm the patient much. Dmean of the larynx and liver instead has the clinical value to predict the risk of having grade 2 or above edema of the larynx and radiation-induced liver disease. Though the Dmean of the larynx and liver in all plans was well under the tolerance dose, DJ mode had further reduced their Dmean. Relatively important OARs in irradiating left chest wall with SCF involvement, such as the lung and heart, were usually located laterally to the target. The effect on sparing these OARs was expected not as significant as the larynx and liver.
V20 and mean lung dose (MLD) show a strong correlation with the radiation pneumonitis (RP). Reference Marks, Bentzen and Deasy14 There is no absolute threshold of dose below for no risk in RP (93). Among three optimisation modes, the average MLD and V20 for ipsilateral left lung (nPTV), right lung and whole lung in this study were under 20 Gy and 30%, which is clinically acceptable to minimise the risk of RP (93). Another meta-analysis focusing on breast cancer patient recommends that the V20 < 24% and MLD < 15 Gy to minimise the risk of RP without compromising the coverage of target (94). Study also shows that the involvement of SCF field and IMC field increases the risk of RP (94).With the overlapping of PTV and the ipsilateral lung, three DJ5.0 plans and two FJ2.5 plans had a V20 > 24% for left lung (whole), where the NTCP of those for left lung (whole) was between 0.2% and 0.5%. Other NTCP of the lung illustrated that the risk of radiation-induced pulmonary complications for all plans was close to zero percentage.
A study points out that there is a linear relationship between the risk of cardiac complications and the MHD. Reference Darby, Ewertz and McGale15 1 Gy increase in MHD increases the risk of cardiac complications by 7.4%. Reference Darby, Ewertz and McGale15 The result from this study shows that the average MHD using DJ2.5 is 8.8 Gy ± 2.1, which is around 1 Gy lesser than DJ5.0 (9.8 Gy ± 2.5) and FJ2.5 (9.7 Gy ± 2.1). Based on this assumption of the linear relationship, using DJ2.5 instead of DJ5.0 and FJ2.5 can decrease the risk of cardiac complications approximately by 7.4%. The decrease in MHD in DJ2.5 is probably caused by the combined benefit from DJ and narrower field width. In fact, the NTCP of the heart in these plans was almost equal to zero (Figure 10).
Box-and-whisker plot of treatment duration(s).

The long treatment time is usually a challenge for TomoTherapy®. The long treatment time can increase the intra-fractional error because of a higher chance of patient movement. Patient was usually irradiated with both arms overhead to avoid unnecessary irradiation to arms. With the long treatment and arms up position, they are usually compliant of the arm numbness. Also, the patients with SCF involvement usually undergo operation before treatment. The long treatment time certainly worsens their treatment experience. Therefore, the decrease in treatment duration not only can decreases the intra-fractional error, but also betters the patient’s treatment experience.
Conclusions
No statistical significance was found in those dosimetric and radiobiological parameters among three modes while the delivery time has greatly reduced by using DJ5.0. A shorter treatment time can minimise intra-fractional error and better the patient’s experience during treatment. However, DJ5.0 increases the difficulties in reaching some numerical dose parameters, e.g. V20Gy of the lung < 20%. In most of the situations, DJ5.0 is suggested to be the optimisation mode in HT for left-breast cancer patient with SCF nodal involvement, especially for patients with difficulties in holding their arms up for treatment position. From the management aspect, DJ5.0 can also increase the throughput of the treatment machine. For plans with harder constraint, a narrower field width is suggested. However, DJ shall always be applied with no harm to patient.