


Introduction
In recent years, waves of intense political activism (e.g., Black Lives Matter, #DefundThePolice) have washed over many of America’s cities, particularly in low-income minority communities where the resources that usually predict individual-level engagement are less common. This isn’t necessarily new; cities have long been sites of grassroots mobilization, especially in places where state-society interactions are often more contentious and where direct negative experiences with public policy in daily life make the urgency of informed participation clearer (Soss and Weaver Reference Soss and Weaver2017). Many activists and residents in these contexts frequently display both a commitment to sustained, costly participation and a sophisticated understanding of political issues learned from direct experience (Weaver, Prowse, and Piston Reference Weaver, Prowse and Piston2019).
At the same time, political science research suggests that local politics have become far less important to most Americans (e.g., Hopkins Reference Hopkins2018). While more than half of Americans voted in the last two elections for president, turnout for local elections is typically between 10% and 20%. The average American may view their local government more favorably than the federal government, but local political outcomes appear less consequential to them than those at the national level (Oliver Reference Oliver2012). Behavioral trends suggest that this may be because Americans identify less strongly with, and know less about, politics in their states and local communities (Hopkins Reference Hopkins2018). Regardless, these findings call into question local residents’ capacity not only to serve their theoretical role as retrospective evaluators of government performance but also to serve their civic role as voters. In other words, contemporary waves of activism and participation are in tension with the emerging theories political scientists use to explain Americans’ engagement with politics, locally and in general. How do we reconcile these two realities?
In this paper, we develop and test a theory that illuminates how local experiences of geographically concentrated policy change affect political engagement in racialized contexts. Further, we demonstrate that such geographically concentrated policies matter most for those who we ordinarily would expect to participate the least: Black Americans with low levels of economic resources. Analyzing original data from a wave of school closures in Chicago that disproportionately affected Black American neighborhoods, responses to the Cooperative Congressional Election Study (CCES; Schaffner and Ansolabehere Reference Schaffner and Ansolabehere2015), and official election returns, we use difference-in-difference analyses to examine how residents of these communities responded to this school closure policy.
This study reveals that proximity to a school closure is associated with increased meeting attendance, increased mobilization to change the institutional framework by which school policy is made, and increased mobilization against the elected officials responsible for the closures. These findings demonstrate a model of “place-based” policy feedback through which residents of areas with concentrated policy change gain important information and insights useful for forming political attitudes and local political mobilization in their communities. Those who previously participated at the lowest rates went on to participate at the highest rates on community issues that matter to them—in this instance, school closure.
In our model, community refers both to the geographic location where the policy is concentrated and the racial group most affected by the policy. Citizens’ identification with such communities serves as a critical mechanism for inciting their political action. Together, these findings bridge theories of policy feedback, urban politics, and political behavior to highlight how local, place-based policy experiences may spur citizens to take political actions consistent with their collective interest, particularly in marginalized communities such as those that faced school closures.
Local Political Behavior and Policy Feedback
Many evaluations of American voters’ incline toward pessimism. For starters, Americans in general typically demonstrate low levels of political knowledge; the description in Bartels (Reference Bartels1996) of the “political ignorance of the American voter” has held up fairly well under decades of subsequent investigation (Achen and Bartels Reference Achen and Bartels2016). Citizens’ attitudes on specific policies are often characterized as either randomly in flux, easily manipulated, or as functions of prior group-based predispositions rather than well-reasoned judgments. This seems particularly true of citizens with little interest in or information about politics, traits often associated with low levels of formal education (e.g., Bartels Reference Bartels1996; Delli Carpini and Keeter Reference Carpini, Michael and Keeter1996). Strong and perhaps immovable partisan and ideological positions also impede clear-eyed policy evaluation, as voters choose sides and retrospectively justify positions and/or misjudge the performance of their favored and disfavored political actors (e.g., Green, Palmquist, and Schickler Reference Green, Palmquist and Schickler2002; Mason Reference Mason2018).
These judgments are typically made by analyzing national samples and issues, but the prognosis does not typically improve closer to home. Longstanding models of local political systems emphasize elite control of outcomes through partisanship and/or racial cues, with little role for considered, evaluative electoral behavior by voters (Banfield and Wilson Reference Banfield and Wilson1963; Gosnell Reference Gosnell1937; Stone Reference Stone1989; Trounstine Reference Trounstine2008). More recent studies suggest an increasingly nationalized media environment has obscured the salience of local policy issues and made Americans generally less interested in or knowledgeable about local affairs (Hopkins Reference Hopkins2018). Institutional and contextual features of small democracies such as low levels of campaign advertising, low policy stakes, demographic homogeneity, nonpartisan formal organization, off-cycle timing, and obscure offices on the ballot contribute to this diminished salience (Hajnal and Trounstine Reference Hajnal and Trounstine2014; Oliver Reference Oliver2012). All these factors can lead to extremely low turnout at the local level, which increases class and racial biases in the electorate and other participatory fora (e.g., Berry and Gersen Reference Berry and Gersen2011; Oliver Reference Oliver2012; Trounstine Reference Trounstine2018) In other words, local politics tend to fall well short of engaged, informed, and representative democracy (Stone Reference Stone1989; Trounstine Reference Trounstine2008).
Despite these claims, there is also evidence of instances where citizens are especially informed about and active toward policies that matter to them. At the local level, research on gender and politics reveals that women are especially knowledgeable on issues of education (Delli Carpini and Keeter Reference Carpini, Michael and Keeter1996; Dolan Reference Dolan2011; Paolino Reference Paolino1995). Research on urban politics illustrates how Black and Latino citizens can become particularly mobilized by threats from the state to take over their schools and/or reduce their budgets (Morel Reference Morel2018; Orr Reference Orr1999). Further, these works demonstrate how mobilization may be more efficient (and partisan cues less relevant) due to citizens’ easier access to policy actors and policy information at the local level (Berry and Howell Reference Berry and Howell2007; Malhotra and Kuo Reference Malhotra and Kuo2009). Scholars of race and ethnicity add to this work demonstrating the mobilizing effects of controversial policies such as those related to immigration once they become racialized (e.g., Zepeda-Millán Reference Zepeda-Millán2016). Together, these findings provide specific instances where marginalized groups may exhibit high levels of political knowledge and/or high rates of local participation. However, it remains unclear why there is such variation across issues in prompting mobilization by groups that would ordinarily be associated with lower levels of participation.
Research on policy feedback and political behavior provides a potential explanation by demonstrating how the political attitudes and actions of citizens may be influenced by their direct experiences with policies (Cramer and Toff Reference Cramer and Toff2017; Lerman and McCabe Reference Lerman and McCabe2017; Mettler Reference Mettler2011; Soss Reference Soss1999). Lerman and McCabe (Reference Lerman and McCabe2017), for example, find that personal experiences with public health insurance programs can “lead to meaningful opinion formation or attitude change” on Medicare and the Affordable Care Act, with particularly strong effects for voters (624). Observations by Weaver, Prowse, and Piston (Reference Weaver, Prowse and Piston2019) make clear that citizens’ direct experiences with the state—especially “negative” experiences with a repressive or unresponsive state—reveal a depth of sophisticated policy understanding that is less common in the public at large. They also argue that the tools typically used by political scientists—national opinion surveys—may make it difficult to gauge these effects.
Additional studies demonstrate that citizens’ personal experiences can influence not only attitude formation but also political engagement. Mettler (Reference Mettler2005), for instance, finds that veterans’ experiences with the benefits from the GI Bill shape their increased civic engagement. Campbell (Reference Campbell2005) uncovers a similar relationship for recipients of social security. More recently, Barnes (Reference Barnes2020) discovers that properly designed after-school programs can be empowering for participating families. Together, these studies of policy feedback suggest the potentially powerful role of personal experience in a range of political dispositions (attitudes, behavior, self-conceptions) and provide a theoretical framework for understanding sophisticated engagement by citizens without the individual-level resources (formal education, direct financial stake) usually associated with such participation. We identify three ways in which these insights can be extended through a focus on community, place-based policy feedback.
First, while these works highlight the significant role of specific policy experiences for citizens’ political behavior, most of them focus on national-level issues (e.g., Mettler Reference Mettler2005; Soss Reference Soss1999).Footnote 1 Scholars of policy feedback have touched on education policy and political behavior, specifically (e.g., Bruch and Soss Reference Bruch and Soss2018; Rose Reference Rose2018), but the field has tended to focus on welfare, social security, health policy, and criminal justice (e.g., Campbell Reference Campbell2005; Soss Reference Soss1999; Weaver, Prowse, and Piston Reference Weaver, Prowse and Piston2019). This may be due to the decentralized complexity of education governance, especially at the K–12 level, but this oversight is unfortunate because K–12 education is an area of government with which the vast majority of Americans have years of direct, daily experience (as students, parents, or teachers). It is therefore an especially consequential area of policy.
For Black people, in particular, public schools represent some of the first institutions in which they held leadership roles, such as principal and superintendent, before taking on formal political roles such as mayor (for example, W. W. Herenton became the first African American superintendent of Memphis Public Schools in 1979 and then the first African American mayor of Memphis in 1991). Public schools have also acted as central sites for organizing around social and political issues for African Americans; for example, the Freedom Schools throughout the 1960s were used to provide students with the educational tools needed to attain political equity (Todd-Breland Reference Todd-Breland2018). Further, schools serve as major centers of Black employment, through the hiring of teachers, staff, and administrators, as well as mechanisms to sustain Black businesses, which have benefited from contracts such as those to serve lunch and/or provide janitorial services. In a context where most programs of social welfare have seen significant disinvestment, schools have become, and continue to be, engines of social, economic, and political mobility. Permanent school closures disrupt this and thus act as a threat to Black futures.
Amid the global COVID-19 pandemic, over 50 million children across the United States have experienced the temporary closing of their schools, with permanent closures likely to follow. And yet, it remains unclear how experiences with permanent school closure might shape the political attitudes and actions of marginalized people. This work is the first to answer this question, and in so doing, provides significant insights on community-based mobilization toward the increasingly important policy issue of school closure.
Second, much of the work on the role of personal experience assumes that citizens’ encounters with these policies are static rather than changing. The result is that we know very little about how citizens respond to policy changes that affect them. For example, how might Mettler’s (Reference Mettler2011) conception of invisible government be transgressed by select policy shocks that make government hypervisible to some groups as opposed to others? Furthermore, in what ways does the hypervisibility of these policies matter for collective mobilization? This paper illustrates that our models of feedback can assess how specific policy events matter for the mobilization patterns or actions of the affected group. An analysis that treats experiences with a policy area over time (e.g., welfare, Medicare) as constantly negative, neutral, or positive misses these important policy shocks that likely have serious and lasting consequences for citizens’ relationship to and/or with government. This seems particularly true for policies that evidently affect one geographic or social community more than others.Footnote 2 Studying changed behaviors in response to concentrated policy shocks, then, may provide substantive insights on local political mobilization.
Finally, citizens may show different patterns of behavior in response to elements of their political and social context—for example, communities with high levels of racial segregation and/or descriptive representation (Gay Reference Gay2004; Tate Reference Tate2001). Black Americans, in particular, may link racialized contexts to heightened political engagement. For instance, Black electoral participation appears to be higher when substantive representation and descriptive representation initially appear as ballot choices in local races (Bobo and Gilliam Reference Bobo and Gilliam1990; Spence and McClerking Reference Spence and McClerking2010; Tate Reference Tate2001). Nevertheless, these effects appear to vary over time and space, due in part to concentrated poverty, social isolation, and/or specific policy events (Alex-Assensoh Reference Alex-Assensoh1997; Cohen and Dawson Reference Cohen and Dawson1993; Gay Reference Gay2002; Harris, Sinclair-Chapman, and McKenzie Reference Harris, Sinclair-Chapman and McKenzie2005; Laird Reference Laird2019; cf. Shaw, Foster, and Combs Reference Shaw, Foster and Combs2019). Members of such communities often experience an unresponsive state and tend to have fewer resources with which to deal with state failure, thus likely shaping the types of political attitudes and actions they take on.
Gay (Reference Gay2002), for example, demonstrates how Black residents support candidates who champion their policy preferences, regardless of race, thereby providing less support for representation that is purely descriptive as opposed to substantive. Further, Harris, Sinclair-Chapman, and McKenzie (Reference Harris, Sinclair-Chapman and McKenzie2005) highlight how descriptive representation has positive influences on mobilization but that these gains are constantly undermined by harsh economic conditions, arguably spurred by neoliberal policies (Spence Reference Spence2012). Similarly, Alex-Assensoh (Reference Alex-Assensoh1997) finds that social isolation, due to economic and racial segregation, undermines the political participation of African Americans, making them less likely to vote, discuss national affairs, and express interest in national politics. Yet, she also demonstrates how those isolation effects can be mitigated through community meetings and discussing politics with neighbors and when citizens of these communities view their participation as remedying inequality (Alex-Assensoh Reference Alex-Assensoh, McLean, Schultz and Steger2002). Together, studies in race, political behavior, and urban politics suggest that the specific racial and policy context matters for levels of participation. But the two are rarely examined together, and most survey-based studies cannot assess how these relationships change within particular communities over time.Footnote 3
Relatedly, established literature on policy feedback references race and policy experience across many of its investigations but rarely investigates the community where that policy event is concentrated (Michener Reference Michener2017).Footnote 4 In this paper, we show that the geographic location and policy concentration should and do matter for understanding political behavior, especially in Black communities that are segregated in resource-poor neighborhoods. In particular, using proximity-based measures of exposure to policy change, we test a theory of what we call a model of “place-based mobilization.” The next section describes the model in more detail.
A Model of Place-based Mobilization
The concept of place-based mobilization describes the process by which citizens respond to a policy change concentrated in their community. Their engagement is based not on their experiences with distantly formulated policy but rather their contextual experiences as members of the community where the policy occurred. By contextual, we mean that the citizen may not have direct exposure to the policy personally but rather, only through their membership in the affected community, either social or geographic, or both.
This conceptualization builds on recent scholarship assessing changes among persons who may not be direct targets of a policy but know those who are. Burch (Reference Burch2013), for example, finds that the racially targeted policies associated with mass incarceration decrease participation rates among both those directly affected and fellow members of their neighborhood. Walker (Reference Walker2020) finds that proximal experiences with the criminal justice system led to increased protesting but not increased voting. While both works are specific to the justice system, they illustrate how feedback effects are often not limited to direct beneficiaries but also touch entire communities.
A place-based model extends this work in that it considers a target of closure to be inclusive of those directly and indirectly affected by the policy but also argues against the significance of this distinction when considering the behavior of a community. In previous work on attitudes toward school closure, for example, Nuamah (Reference Nuamah2020a) finds no differences in opposition to closure between those who are directly and indirectly affected by them. That study argues that school closure is constructed at the local level as a race and neighborhood concern, which means that the target category is not limited to those who have children who attend schools that are threatened for closure; it also includes the poor Black communities where those schools serve as important community institutional anchors.
Understood this way, the construction of who is included as a target of school closure is not just determined by the policy makers and internalized by its recipients. It is also defined by members of the community and often used a political tool and strategy to facilitate collective mobilization. In other words, citizens may come to see themselves as directly affected by a policy as a community is, even if they are only indirectly affected at the individual level. This conception of being a member of an affected community facilitates opportunities for political participation. This paper reveals the multiple ways that classic literature on policy feedback and political behavior may benefit from a conceptualization of the policy target category that thinks carefully about the relationship between policy geography and the community response.
Geographically concentrated policy effects and the contextual experiences they produce are at the center of a place-based model of political mobilization. For a policy to be geographically concentrated, it must occur in some areas of a city or state more often than others, and its effects must be discernible and affect even those who are not directly affected. In the case of the Stop-and-Frisk program in New York, for example, the policy occurred largely in Brooklyn and the Bronx. In these communities, residents were stopped by the police more than four times as often as in Midtown and Chelsea.Footnote 5 This policy was about more than stopping and frisking particular individuals, however; it required a heavy police presence, which placed all residents of the neighborhood under more intense and frequent surveillance. Yet, because geography is also racialized in America, most residents of neighborhoods targeted through the Stop-and-Frisk program were also members of marginalized Black and Brown communities. Accordingly, it is both their geographic location and racial identification shaping their local policy experiences and actions.
More broadly, citizens—including, or perhaps especially, those with weak attachments to conventional electoral politics—come to engage in political action through their experiences with policies that are imposed from above and that directly affect their lives and communities in negative ways. In our model, citizens shift their behavior and attitudes when a particularly salient policy change is understood as targeted at their community, and they do so in ways “rationally” related to those policies by mobilizing politically and opposing them. These shifts may be observed through their increased engagement in nonelectoral forms of participation (such as community meetings) that are crucial for spreading information about policy details and building coalitions for strategic action. This nonelectoral participation may then translate to changes in electoral behavior by voting at higher rates and opposing the official(s) responsible for the unpopular policy. We summarize this model graphically in Figure 1.
A Model of Place-Based Mobilization

This is not a universal theory of policy response or opinion formation, but we believe it is an important one for understanding important and often overlooked community–policy dynamics. We doubt this place-based model will explain behavior for nationalized issues or among every group of actors. It is also unlikely that this model will explain much about responses to policies where residents share no salient spatial identities and interests or policies with effects that are not concentrated in space and by race. Rather than every context and policy issue, place-based mobilization contributes to an understanding of how communities respond to concentrated policy changes in which they had little initial input, especially in highly segregated, racialized contexts. While this mobilization may not necessarily succeed in overturning the undesired policy (in part for the same reason the community was targeted in the first place), the change in community attitudes may spill over into other areas of politics and persist.
Black Residents and Place-Based Mobilization
In this paper, we document how Black Americans who live in communities targeted for school closure became more likely to attend community meetings, mobilize to support a ballot measure for an elected school board, and decrease their support for the elected official with formal control over school policy in Chicago (i.e., the mayor). These effects are geographically concentrated, but not limited to the parents of children in the affected schools. We suggest that it is the contextual community experience—membership in a neighborhood and racial group targeted by closure—that drives this political engagement. These community-level, place-based experiences facilitate informed political action consistent with collective interests.
For Black residents, and to some extent other minority groups, race has played a powerful role in building a collective political identity, often conceptualized as group consciousness or linked fate, around important political issues (Dawson Reference Dawson1994). Thus, it might be the case that group consciousness—rooted in historical experiences with race as opposed to contemporary racial experiences with concentrated policy change—explains the ensuing actions of community members. However, group consciousness can vary across policy issues and may be latent or directionless without a precipitating event. As McClain et al. (Reference McClain, Johnson Carew, Walton and Watts2009) observe, “it is important for scholars to understand better the contexts that activate and those that might limit or stymie the development of group consciousness” (471). Further, Laird (Reference Laird2019) states in her analysis of racial group identification that “political context … shapes the way group members see their own interests as connected with those of the group” (3). Accordingly, while one’s connectedness to a racial group may in some cases shape how polices are understood, policies can also play a critical role in constructing race and thus the extent of one’s connectedness to a racial group.
In this paper, we conceive of how group consciousness can be transformed into action by citizens’ contextual policy experiences. In particular, we view low-income minority groups as making political decisions not only based on abstract racial cues or distant national issues but also through their engagement with specific policies happening in their community. School closings provide a context to activate group consciousness into place-based mobilization.
The Case: School Closures and Electoral Context
We test this model by examining the way Black residents responded to school closures in their communities. School closures are increasingly common across the country. About 2,000 public schools across the United States permanently close each year.Footnote 6 Further, the current COVID-19 pandemic has facilitated the temporary closing of every school district in the nation at some point over 2020 and will likely contribute to the permanent closure of some schools in the years after.
In 2012, the Chicago Public Schools (CPS) board initiated the largest wave of public school closures in US history (49 of nearly 500 schools). CPS officials framed the policy as a product of population loss in particular areas of the city. CPS claimed that the policy would also allow them to redirect funding from closed schools to a smaller set of schools.Footnote 7
On the surface, one might expect generalized support for such measures under the banner of enhancing overall efficiency. Yet, previous research reveals that many affected community members had negative past experiences with school closures and other educational reforms (e.g., Lee and Lubienski Reference Lee and Lubienski2017). Accordingly, they developed a mistrust of school closures and the officials who implemented them (Nuamah Reference Nuamah2020c).
These feelings of mistrust were exacerbated by the fact that the closure policy disproportionately targeted one racial group: low-income Black residents. Black residents made up 48% of the public school population but 88% of those affected by the school closure policy. Despite the policy’s racially disparate impacts, CPS officials justified it as nominally nonracial.Footnote 8 In contrast, several local groups, including the Chicago Teachers Union, promoted narratives that ran counter to the race-neutral one promoted by CPS (i.e., underenrollment). The primary counter-narrative focused on the argument that the school closure policy was racist, and thus “deliberately starving schools in Black and Latino neighborhoods.”Footnote 9
When African American community members heard these accusations, they were able to connect with them, in part because they shared their direct and immediate experiences with CPS policies at public meetings.Footnote 10 For example, an African American parent stated at a community meeting on closure, “We notice where the schools are being targeted. It is on the south side. It is on the west side. It is where the students are Black and Brown.”Footnote 11 At community meetings, many attendees learned from speakers, such as this parent, that the closures unfairly targeted some groups more than others (Nuamah Reference Nuamah2020b; Reference Nuamah2020c). Participants went on to frame their experiences as an example of how they were being devalued by elected officials; as one parent stated, “I just don’t like how [CPS officials] are treating us at this meeting … sending us here and there.” Another participant commented on the size of the venue selected by CPS at the meetings: “You knew it would be a big meeting. It’s been huge all over the city and now you’re going to try to tell us [it’s over capacity] … No! We want to hear from our elected officials.”Footnote 12 Statements like these suggest that many of the Black residents who participated in community meetings had experiences that affirmed or deepened existing feelings of distrust, making them more open to narratives that suggested the closures were racist (Nuamah Reference Nuamah2020b).
While the particular psychological mechanisms of mobilization are not directly measured in this work, we suspect that this conception of who the policy is targeting, buttressed by counternarratives promoted by organizations that frame closure policy as racist, contributes to a shared group consciousness that likely played a role in facilitating mobilization. In other words, Black Americans’ were mobilized against closure by the counter-constructions of the policy that community members developed and shared with each other. Further, their engagement is based not on their experiences with distantly formulated policy or policy messages but rather their contextual experiences, in the past and present, as targeted members of the segregated community in which the policy occurred.
Mobilizing against School Closure
Community members had opportunities to engage in political learning and action, in part, because the closures were not immediate or automatic; by law, the school district must collect input on school closure decisions from those potentially affected. The collection of feedback took place at a series of meetings with CPS officials over a multimonth period at local churches and community centers. These meetings were the only formal venue through which to voice opposition to the plan.
The vast majority of affected individuals belonged to resource-poor communities of color that traditionally participate at low levels, particularly around school issues (e.g., Henig et al. Reference Henig, Hula, Orr and Pedescleaux1999). In fact, schools had been closing in Chicago since 2001, but at a much smaller scale than the 2013 closures. Based on the previous decade, it was unclear whether those affected would participate in the 2012–13 public meetings and contribute their opinions on the school closure decision.
Nevertheless, with the support of community organizations and with district-facilitated resources provided,Footnote 13 the 2012–13 meetings were well-attended, and community members who attended and spoke were overwhelmingly against school closures. Their critiques focused on the rationale (efficiency), the decision-making process (by an unelected school board), the disproportional targeting (racism), and the loss of a community institution (Nuamah Reference Nuamah2020a). Despite community opposition, 49 schools were closed in a single wave in 2012–13.
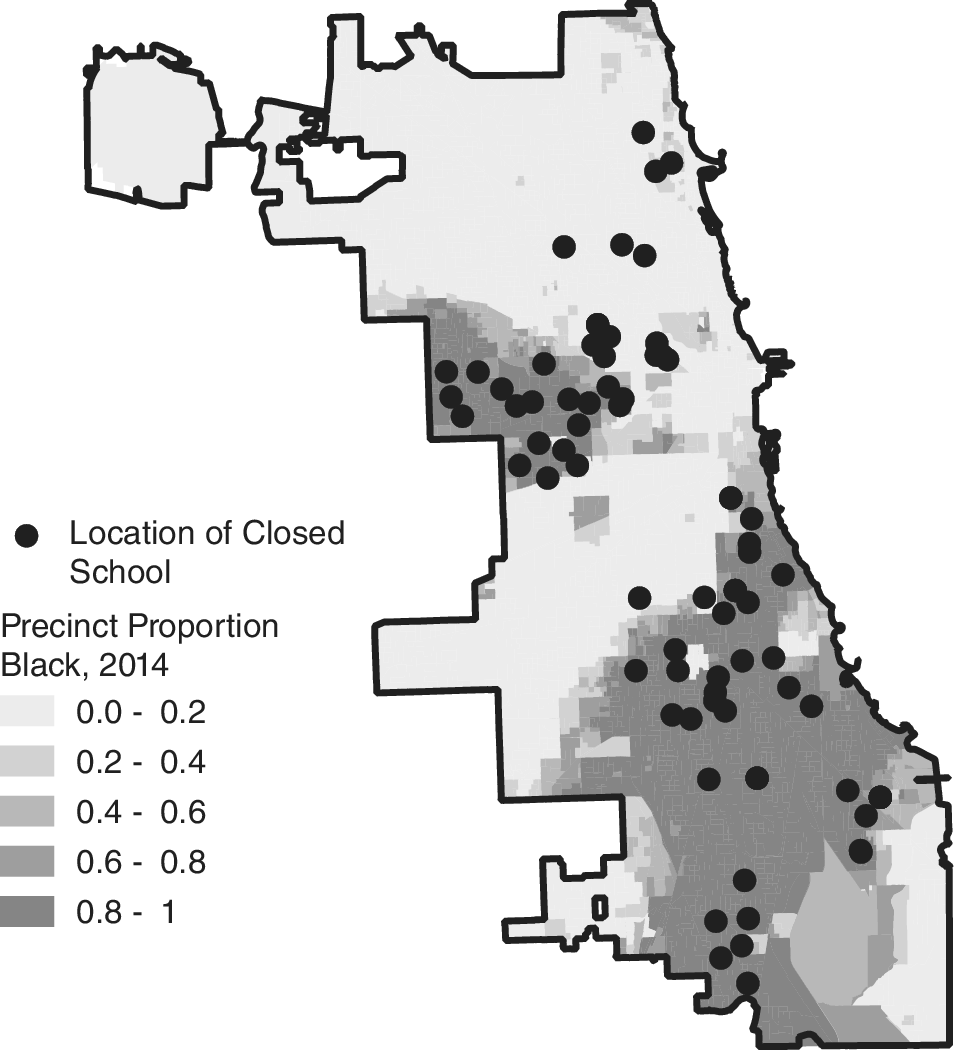
These closures were not randomly scattered across the city but concentrated within certain communities: 88% of the closed schools were located on the South and West sides of the city, where the majority of the population is Black and low-income. Figure 2 depicts the locations of schools closed in 2012–13.
School Closures and Demography
Note: Source: U.S. Census and authors’ school closure data. The dots indicate the location of schools closed in 2012–13. Background shading reflects census tract percentage of African Americans in 2010 census (darker shades indicate higher percentage).

Further, the mass closure of schools in Chicago was not an isolated event. It followed nearly two decades of school reform in the city that had repeatedly disrupted students’ education: the arrival of charter schools, intermittent closures, teacher contract disputes, and the reconstitution of the school board. Though technically a separate local entity from the City of Chicago, the CPS board is chosen by Chicago’s mayor. This means that the mayor is the only elected official responsible for setting school policy. Rahm Emanuel was elected in 2011, and his school board initiated the controversial wave of closures of 2012–13. In 2012, before the closings drew much attention, there was an advisory ballot measure calling for a change to an elected, decentralized school board, and a similar ballot measure followed in 2015 when Emanuel also ran for reelection. These ballot measures and the mayor’s position as the only elected public official with control over schools policy provide us with leverage for examining the ways voters responded to targeted school closures, because Chicagoans had opportunities to vote on each, before and after the major wave of closings.
Broadly speaking, Chicago is a useful case for analyzing race–place relationships. Long self-characterized as a “city of neighborhoods,” Chicago is paradoxically the most segregated big city in the United States and a historic home of Black political empowerment. Many US cities have seen declines in intracommunity segregation, but many Chicago neighborhoods—especially those targeted for closures—remain overwhelmingly Black, fostering an easy if deeply unjust heuristic for understanding who is being affected by a policy by knowing where the policy is implemented. This geographic isolation has also served to create a strong, though occasionally latent, form of political coidentification. This is clearest in the nearly universal Black turnout for mayoral candidate Harold Washington in 1983 and for adoptive Chicagoan Barack Obama’s presidential runs in 2008 and 2012. While those examples fit neatly within theories of racialized mobilization for trailblazer candidates in racially contentious moments (Kaufmann Reference Kaufmann2004), our model and evidence, described in the next section, are based on a distinct process, where residents must develop a racial understanding of a local policy and connect it to changed attitudes about an incumbent candidate that they had previously supported in large numbers.
Hypotheses: The Political Effects of School Closures
Our analysis examines whether members of communities that were targeted for closure, which are historically disadvantaged with access to fewer political and socioeconomic resources than most other communities within the city, responded to closure policy in ways consistent with the place-based model of policy feedback mobilization. That is, did Chicagoans in areas targeted by the closing policy mobilize and participate in political actions congruent with their collective interests, despite their resource-poor background?
Observations of the community meetings during the closure period indicate that at least some Chicagoans in closure areas did learn from the process and took political action to oppose closures. We are investigating whether these observations were unusual or typical—and whether this closure policy had political effects beyond the school walls. The main observable implication drawn from the place-based model is the following: when residents encounter a negative policy change concentrated in their community, they will mobilize against it. Thus, we hypothesize that political participation will increase among people who live in the areas affected by school closures in Chicago. More precisely,
-
a. In Chicago, the sole formal opportunity that CPS made available to register opposition toward the school closure policy was the community meetings, so we believe that participation in community meetings should increase in areas targeted for closure (Hypothesis 1).
-
b. Because school closures occurred under a mayor-appointed school board, we expect residents of closure areas to mobilize in support of an institutional change to an elected school board after the wave of closures (Hypothesis 2).
-
c. Because the mayor is the only elected official with formal input to schools policy, we expect residents of closure areas to increase their turnout at local elections during which the incumbent mayor is on the ballot (Hypothesis 3a). Secondarily, we also expect that support for the incumbent will decline in closure areas (Hypothesis 3b).
Because of Chicago’s high levels of racial segregation and the concentrated spatial pattern of school closings in areas with predominantly Black American residents, we expect the relationships above to be concentrated among Black Chicagoans generally.
Data and Analysis
To test these hypotheses, we compare changes in political behavior before and after the wave of 2012–13 closures across areas of Chicago with varying exposure to the school closure policy. Of course, this is not a tightly controlled experiment—the closed schools were not randomly selected, and the opinion and voter data are observational—but the underlying logic of comparison is similar in that we focus on variable change across policy conditions.Footnote 14 We examine whether the “treatment” of school closures will be associated with the changes hypothesized in the previous section (for replication files, see Nuamah and Ogorzalek Reference Nuamah and Ogorzalek2021).
To test these hypotheses, we rely on three data resources that connect measures of attitudes and behavior to time and space. First, to evaluate individual-level relationships and mechanisms, we use the waves of the CCES, which includes spatial location data in the form of respondents’ zip code and questions about political participation and local government performance. These measures allow us to test our hypotheses at the individual level and examine fine-grained shifts in attitudes related to the policy change. We analyze changes in the waves just before and after the biggest closure wave (2010 and 2014, respectively).Footnote 15
Second, we use a dataset based on precinct-level results from the Chicago Board of Elections and spatially joined Census data that tie demography to electoral outcomes.Footnote 16 These data allow us to estimate over-time political changes in small-area aggregations and to evaluate actual political behavior in the form of election results (as opposed to reported behavior, as in survey collection). We use the same analytical logic on these data, comparing changes in behavior from the local elections just before the closure wave (2011 for mayor and 2012 for school board referendum) with the election just after it (2015 for the revisiting of each).
Third, to examine voters’ and respondents’ proximity to a community affected by school closures, we develop an original dataset of schools closed in Chicago in 2012–13. These data (which we geocode using their addresses) are used to construct two measures of community-based experiences with public school closures in Chicago. For CCES analyses, we link the schools’ zip codes to respondents to estimate whether a respondent lives in a zip code with at least one closure.Footnote 17 For electoral results analyses, we calculate the distance from the centroid of an electoral precinct to the nearest closed school, and determine whether that precinct was in a closed school’s attendance area. These measures allow us to analyze the concentrated geographic effects at the lowest level possible given the available data. Table 1 summarizes which data and measures we use in the analyses.
Data Sources Key and Measures for Analyses

School Closures and Meeting Participation
To test Hypothesis 1, we compare levels of participation in closure and nonclosure areas of Chicago in 2010 and 2014, using the CCES. This survey has a battery of political participation questions that it has repeated in each wave since 2008. The questions ask whether respondents have participated in various ways recently.Footnote 18 If the wave of closures in 2012–13 had the predicted effects, we should see relatively larger increases in participation in closure areas, especially in attending the meetings associated with closures. To be clear, we suspect an increase in meeting participation among residents of communities affected by closure because meetings were an important venue for community members to learn and share information about the policy and mobilize for subsequent action.
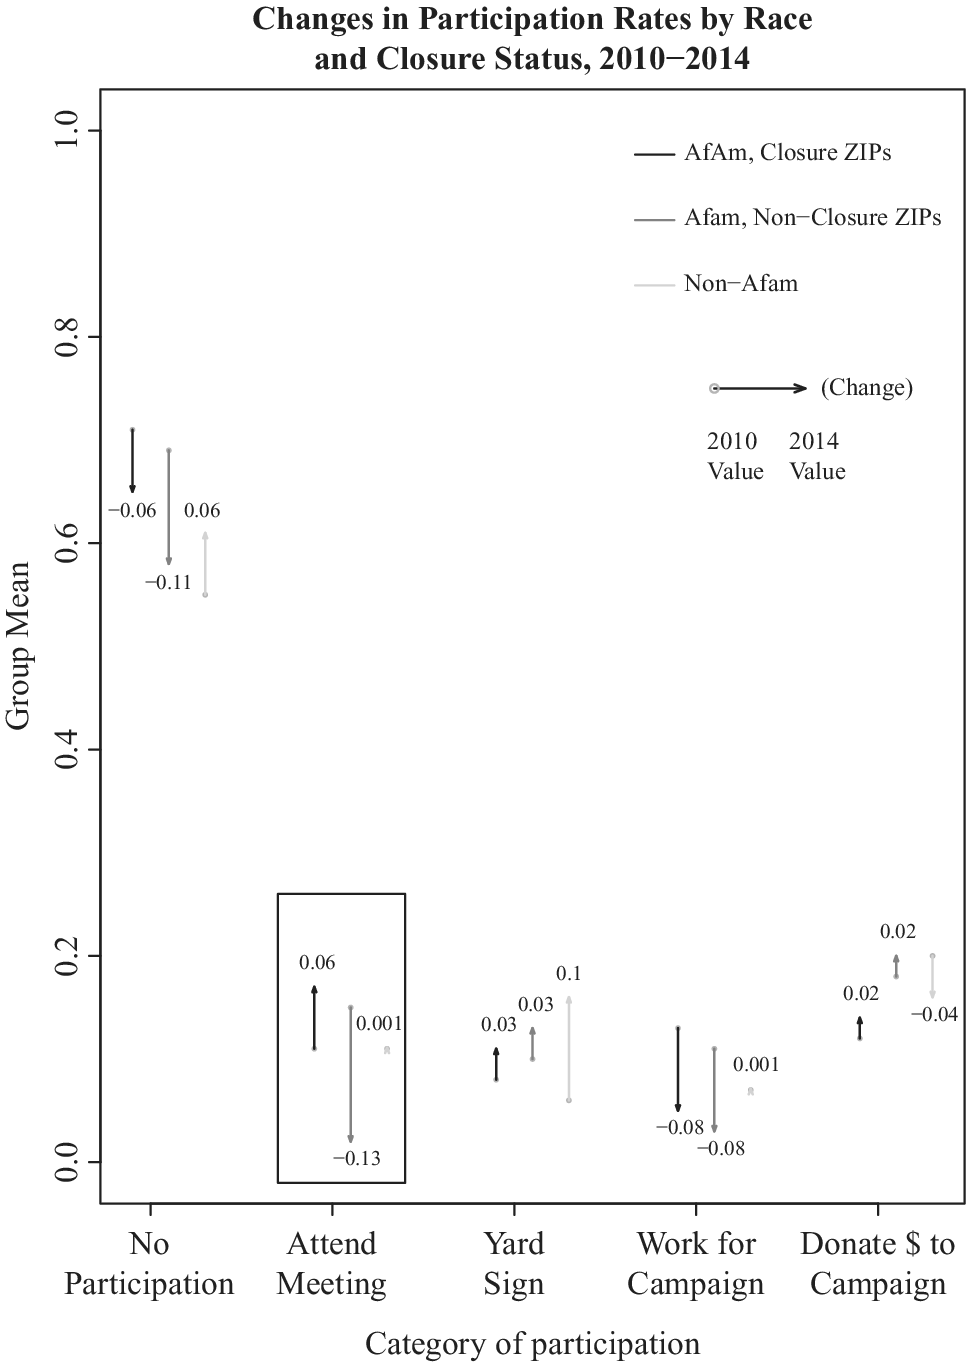
Using the battery of participation questions from the CCES, this is indeed what we observe. Figure 3 shows how participation rates changed from 2010 to 2014 among Black respondents from closure and nonclosure areas of the city as well as non-Black respondents generally. The estimates represented in the figure are the share of respondents who took part in each of the activities.Footnote 19 Before the closures, Black Chicagoans in closure zip codes were the least likely to have recently attended a political meeting; after, they were the most likely group, at 17%. Predicted meeting attendance among Black Chicagoans outside of closure zip codes diminished. For our analysis, the estimated difference between Black respondents in closure zip codes and everyone else is particularly interesting for assessing the underlying role of closures in fostering participation (see Hypothesis 1). Black respondents in closure zones increased their meeting attendance by about 10 percentage points, relative to the rest of the Chicago sample. The difference in changed probability of meeting attendance between Black respondents in and out of closure areas is even larger, approximately 17 percentage points.
Changes in Participation by Race and Closure Status, 2010–14
Note: Source: CCES 2010 and 2014 and CPS Schools Closure Data. Each set of arrows represents the participation rate in the activity indicated on the x-axis for different groups of respondents in 2010 (the circle end of the arrow) and in 2014 (the pointed end). In each set, from left to right, there is a black arrow to show levels among Black respondents from zip codes with closures in 2012–13, a dark gray arrow to show levels among Black respondents from nonclosure zip codes in the city, and a light arrow for respondents who are non-Black Chicagoans. The magnitude of the group’s expected shift on that measure is given in the figure at the end of the arrow. Group means estimated using Chicago-based census weights. Question wordings and numerical summary in Appendix.

School Closures and Electoral Change
As school closings dramatically reshaped communities, citizens learned more about the process and also made significant changes in their electoral behavior. We again leverage time and space to examine changes in electoral outcomes. Using precinct-level returns and demographic estimates from the Chicago Democracy Project (CDP) database, we compare similar elections just before and after the wave of closures in 2012–13. In this section, we present evidence of these changes.
School Board Ballot Measures, 2012 and 2015
To test Hypothesis 2, we look at support for a nonbinding ballot measure advocating an elected school board. This measure was proposed twice, in similar though not identical form, in 2012 and 2015. Support for the measure where it was on the ballot was very high in each year: average precinct-level support was 87% in 2012 and 90% in 2015; each time more than 99% of precincts reported more than 70% support. The biggest change in the ballot measure vote was listing: in order to be on the ballot in a precinct, community members needed to gather a certain number of signatures from that area. Footnote 20 Many communities where the school board measure was listed in 2012 seem to have become more interested in the idea by 2015. The areas of the city with the measure on the ballot covered much more of the city in 2015 (1,489 precincts as opposed to 327 in 2012, a 67% difference) and included much more of the South Side, one of the areas where closings were concentrated (see Figure 1).
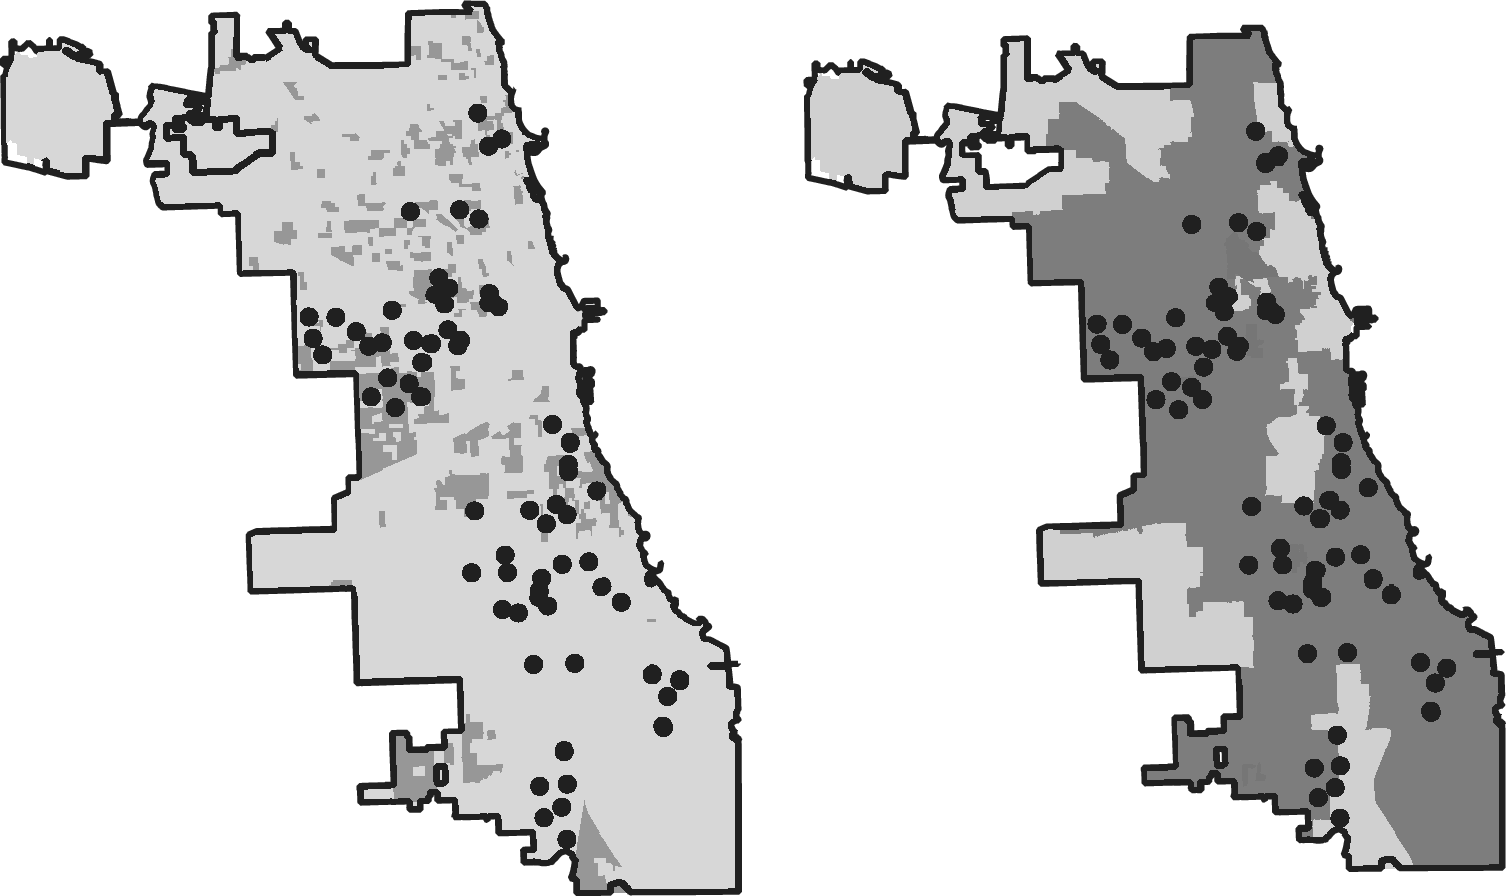
Technicalities in Chicago’s ballot rules required that signatures be collected separately in each precinct to list the elected school board measure on the ballot. This procedural hitch makes analysis slightly trickier: we cannot just compare support for the measure before and after because it was not on the ballot in the same places. But, especially given that actual votes in support of the measure only varied from very supportive to extremely supportive, we gain analytical leverage from the observed patterns in where the measure was added. In particular, we interpret areas with new ballot listings as a sign of a sophisticated, organized reaction against school closure policy. The locations in which these measures appeared on the ballot are shown in the maps in Figure 4.
School Closure Locations and Precincts with Ballot Measure, 2012 and 2015
Note: Dark shade indicates precincts that voted in the 2012 (left) and 2015 (right) school board ballot measures. Circles depict locations of closed schools in each subfigure.

In a given area, there are four possible patterns of ballot measure listings across 2012 to 2015. Mobilizing areas did not have the ballot measure in 2012 but did have it in 2015 (most of the South Side is like this in the map). Demobilizing areas had it on the ballot in 2012 but not in 2015, (see the Far Northwest Side). Always Mobilized areas had it on the ballot both years, indicating a higher level of interest from the beginning that was sustained (these precincts are mostly on the Near Northwest and Far West Sides). Never Mobilized areas did not have it on the ballot in either year, indicating low levels of mobilization in both years (the small areas near downtown fit this description).
Table 2 shows the relationship between ballot measure mobilization and proximity to school closures. The columns reflect a three-part division of precincts based on their proximity to the nearest closed school: the closest third, middle third, and farthest third. Mobilization for the second ballot measure was related to proximity. Among the precincts nearest a closed school, 76% were mobilizing and only 8% kept the measure off the ballot; among those farthest from a closure, only 48% were mobilizing and 41% did not mobilize to vote on the ballot. This is a difference of nearly 20% when compared with areas closer to closures. In a companion regression analysis of precincts that did not have the 2012 ballot measure, an additional mile of distance from a school closure is associated with an approximately 7% decrease in the likelihood that the precinct added the measure to the ballot in 2015, even when we account for precinct-level demography, crime rates, poverty, and school populations.Footnote 21 In summary, proximity to a school closure was strongly associated with mobilizing to list a school board measure on the ballot in 2015.
Total Precinct Fragments and Percentages in Each Ballot Measure Category

Note: Proximity categories are top third, middle third, and bottom third of the distance between the precinct fragment centroid and the nearest school closure.
Mayoral Vote
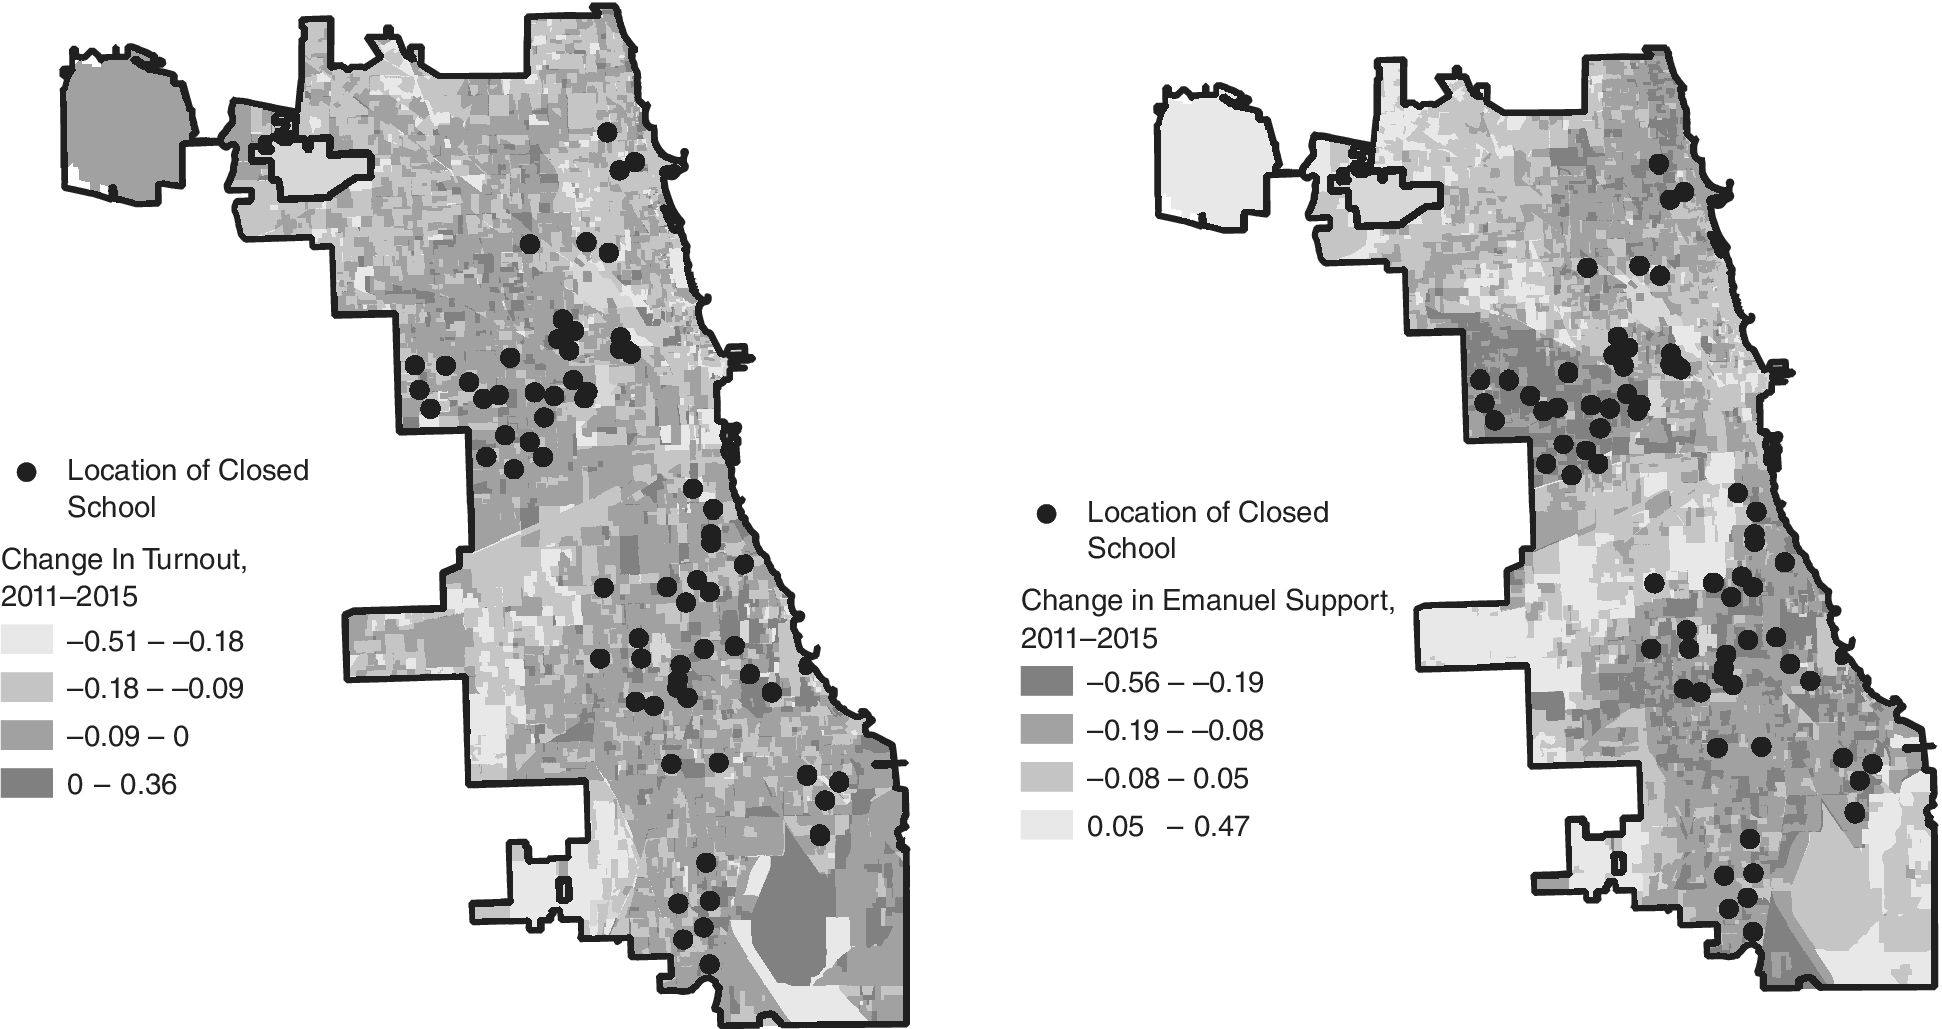
In our final main analysis, we analyze local voter turnout, testing the hypothesis that voters experiencing school closures will mobilize to vote in the mayoral election. In this case, Mayor Rahm Emanuel was elected in 2011 and ran for reelection in 2015, with the closures in between. As in the analysis of school board referenda, this before-and-after timing provides leverage for our analysis. Unlike the school board referenda, Emanuel was on the ballot in every precinct in both elections. Figure 5 shows the locations of school closures, represented as small circles, and the changes in turnout from 2011 to 2015, represented by shades of gray, with darker shades representing bigger increases in turnout.
School Closures and Change in Voter Turnout and Support for Mayor, 2011–15
Note: Areas depicted are community areas, shaded by the change in support for Emanuel (percentage in 2015 minus percentage in 2011). Small black circles indicate locations of closed schools.

These maps depict an apparent association between school closures and change in support for Emanuel in those two elections. Of course, it is hard to observe the relationship between variables in this form, and especially given the city’s high levels of class and racial segregation, we should look more closely to be more confident of this relationship. To do so, we examine changes in support for Emanuel at the precinct level in the CDP data, which also include demographic covariates spatially matched to the voting geography (see the Appendix for information on demographic estimates).
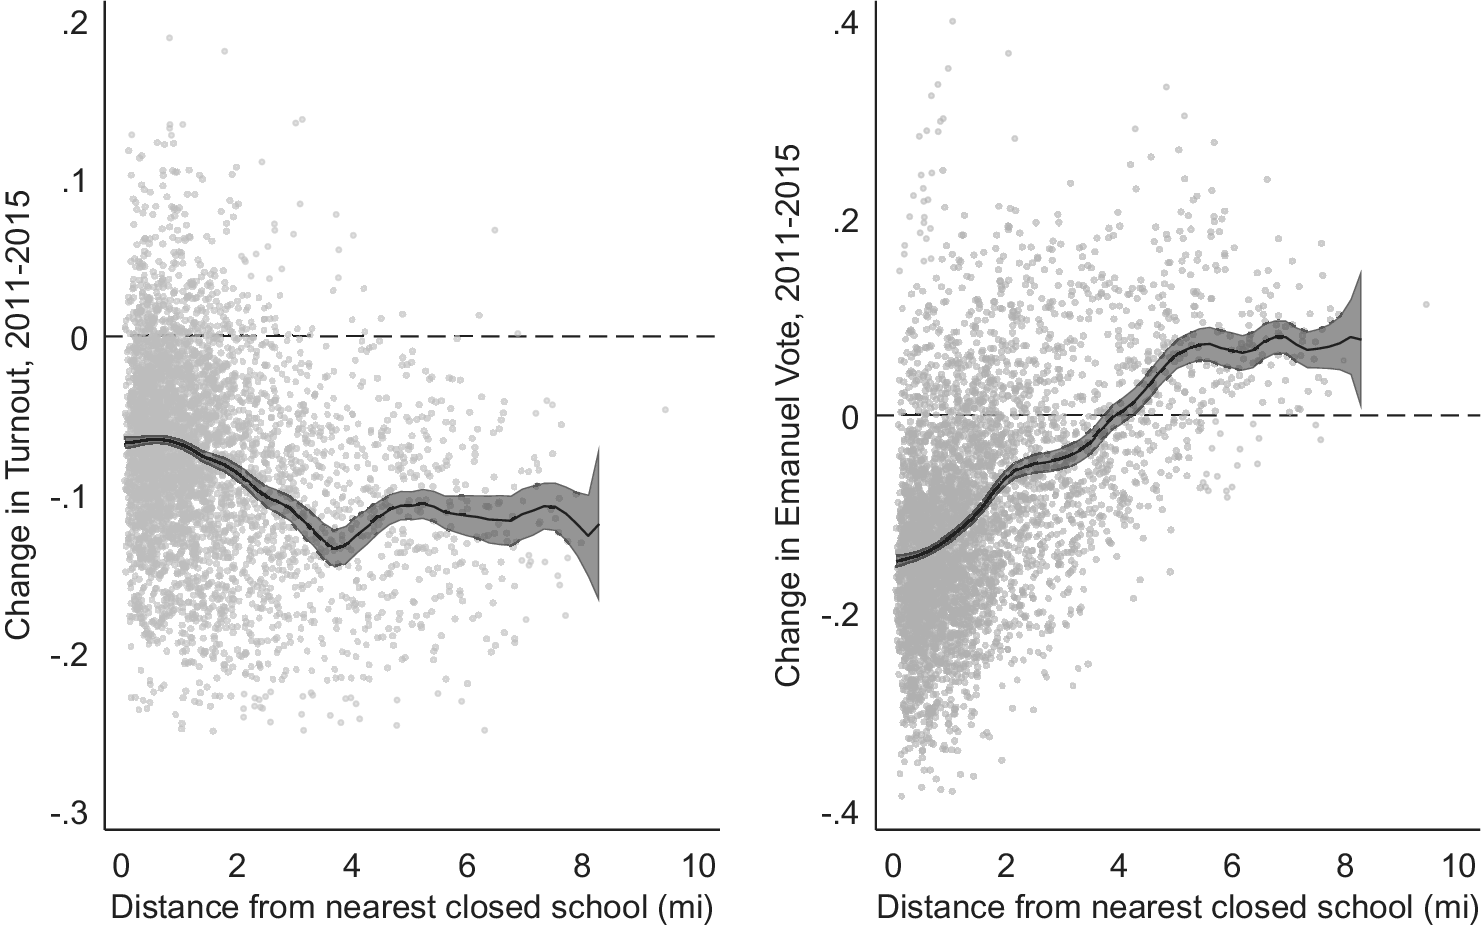
Our theoretical expectations are that proximity to the target area will be associated with heightened mobilization (Hypothesis 3a) and opposition to the incumbent mayor’s reelection bid, because he is the actor that made the policy change (Hypothesis 3b). Figure 6 shows the bivariate relationship between distance and changes in turnout and support for Emanuel from 2011 to 2015. In the figure, negative values indicate a drop in the key outcome (e.g., values below zero indicate decreased turnout) from 2011 to 2015. The distance along the x-axis is measured in miles such that a precinct fragment that was very close to a closed school is nearer to the left-hand side of the frame. About half of all fragments are within 1.5 miles of a school closure. Overall, both turnout and support for Emanuel fell on average, so these change measures assess mainly differences in the intensity of the decrease.
Difference in Precinct-Fragment Outcomes by Distance from Nearest Closed School
Note: On the left, change in turnout for mayoral election, February 2011 to February 2015, and on the right, change in percentage supporting Rahm Emanuel, 2011 to 2015. Points represent precinct fragments; lines are smoothed local averages with confidence intervals.

Figure 6 shows that the relationships between the key outcomes and distance to a school closing appear fairly strong. Each mile of distance from a closure is associated with about a 2% larger decline in turnout (as the moving average line in the figure shows, the relationship is much stronger in the 93% of precincts within 4 miles of a closure, before it flattens out in remote areas). This turnout change was paired with a shift against the only elected official involved in the closings. Support for Emanuel fell much more in areas near a closure: with each mile of distance from a school, his decline in support was about 5% less severe.
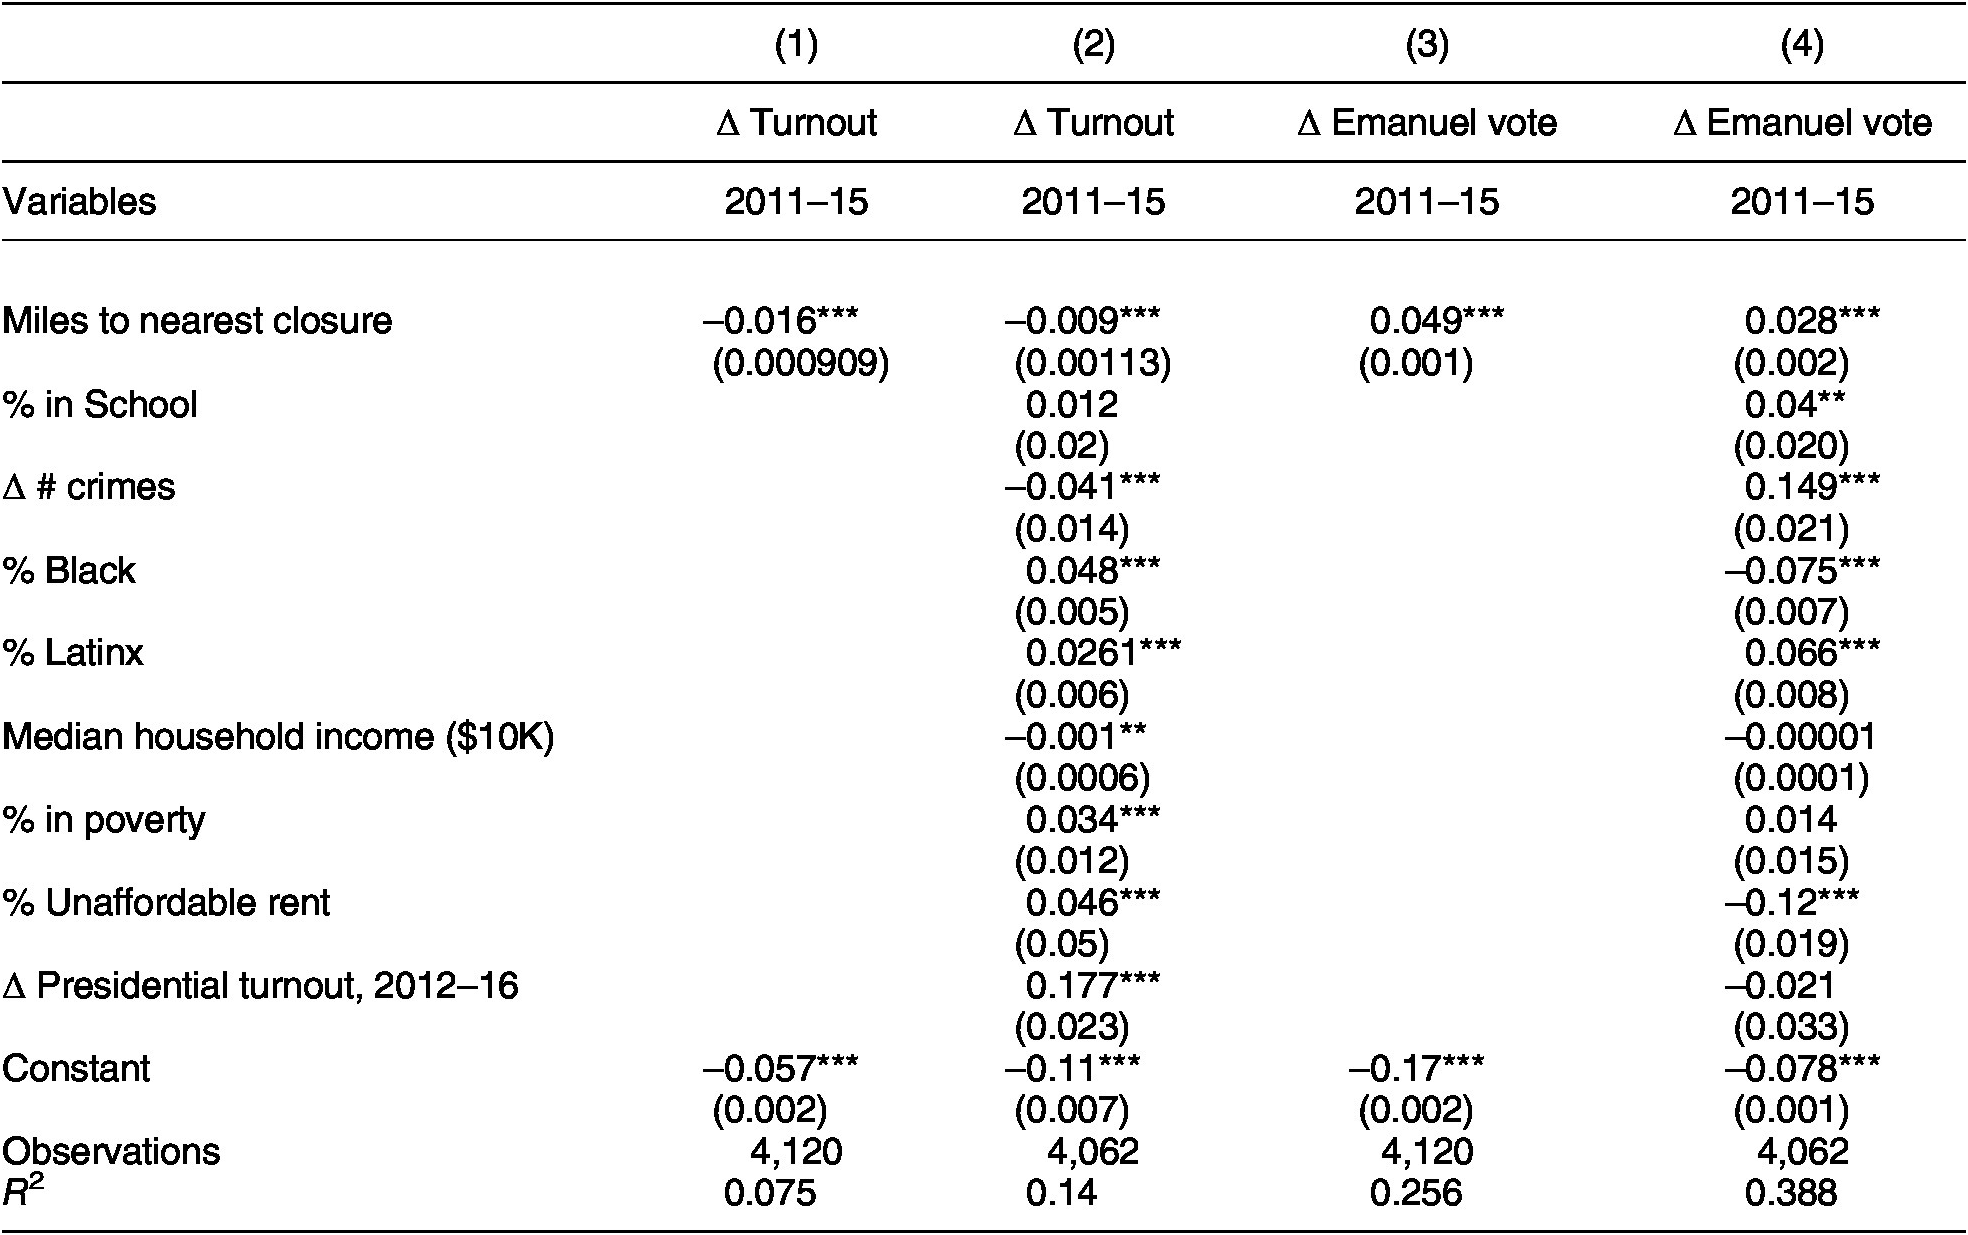
The city’s high level of segregation and the pattern of closings shown in Figure 5 suggest the possibility that the observed relationships may be confounded by other factors such as race or class. However, when we use a multivariate regression to account for alternative factors that might explain higher mobilization or declining support for Emanuel—including precinct-level measures of crime, public school attendance, housing unaffordability, poverty, percentage Black, percentage Latino, median household income, and parallel changes in national political participation—the key relationships between proximity and outcomes remain substantively and statistically significant. These findings also hold when we examine only subsets of precincts whose residents are primarily Black or Latinx (for more, see the Appendix). For each of the models estimated, the relationship between distance to a school closure and the outcome is both significant and in the expected direction. After adjusting for these potential factors, turnout decreased by about 0.9% more with each mile in distance from a closure. In this model, drops in support for Emanuel are also larger near closure areas, at about 2.8% per mile. Broadly, these analyses support our hypotheses, that school closures would increase political turnout and decrease support for those behind school closures.
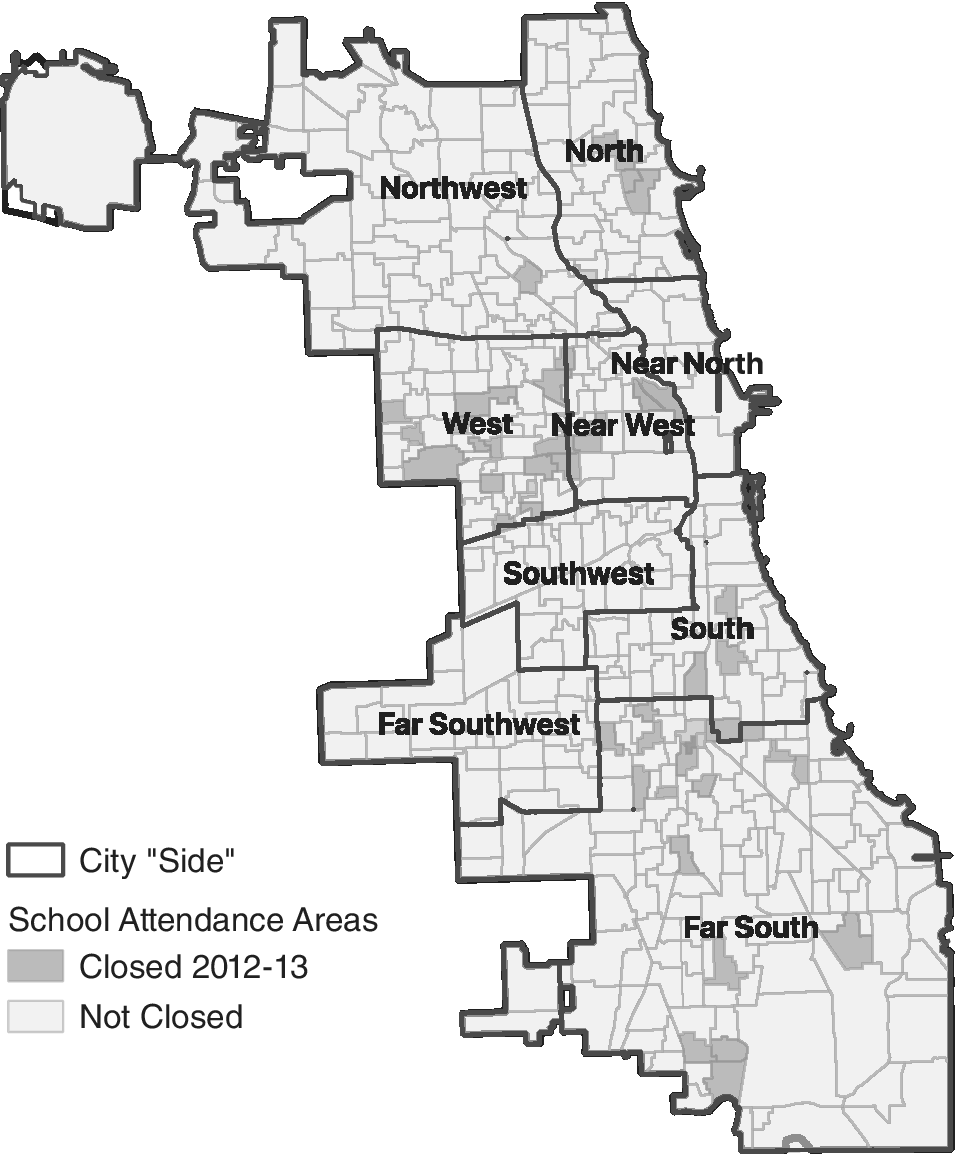
As a further test of the relationship between school closures and political change in Black communities, we compared changes in precincts within the footprint of a closed school’s attendance area with nearby precincts. Figure 7 shows the 2010–11 school attendance boundaries for elementary schools in the city, along with areas of the city known colloquially as “sides” outlined in heavier lines: the South Side, Near West Side, and so on. Schools that were closed are shaded darker gray (see the Appendix for a similar map of high school attendance zones). Consistent with the previous figures, the closures are clustered on the predominantly Black Far South and West Sides—indeed, some sides are completely unaffected—but it is also true that there is variation within the heavily affected areas: some schools are closed and some not. While our theory is about broader community effects that may spill over beyond these lines, we still expect to find a stronger effect within the small subcommunities in which schools were closed.
Elementary Attendance Areas in Chicago, 2010–11 School Year

Indeed, this is what we find. Using maps of elementary and high school attendance areas, we determined whether a precinct was in the discrete area of closure or not. We then compared the political outcomes previously examined—change in turnout, change in support for incumbent mayor, and mobilization for the school reform ballot measure—across closure and nonclosure areas within the same area of the city. Because we are focused on Black communities, we included only precincts from the West and Far South Sides of the city. The high level of segregation in Chicago (shown in Figure 2) means this approach also effectively controls for many other neighborhood-level measures that covary and appear in Table 3. When we compare closure and nonclosure areas within these regions of the city, we find that the change in turnout is about 1% higher, support for the mayor drops about 1.7% more, and mobilization for the school board referendum is about 6% more likely in the footprint of closed schools than elsewhere in the area.Footnote 22
Changes in Vote and Turnout by Race and Closure Status

Note: Models are OLS estimates with dependent variable listed at top of column and covariates at left. Cell entries are regression coefficients with robust standard errors in parentheses. *p < 0.10, ** p < 0.05, *** p < 0.01.
While this test more precisely differentiates between residents of official closure zones than between those in nonclosure zones, it may underestimate the role closures play for members of an affected community, who likely identify with their neighborhood or “side” of the city but not necessarily with their elementary school boundary zone. However, the consistency of this test serves as an indicator of the robustness of the previous findings, especially within predominantly Black communities within the city.
Discussion
The results presented here support a model of place-based mobilization in shaping political behavior. In 2010 and 2011, residents in what would become school closure areas were the least likely to participate in politics. In 2012 and 2013, a large wave of school closings was implemented by CPS. During the time of the closures, informational meetings were held that allowed citizens to learn about the closure policy, voice concerns about it, and ultimately organize against it. From 2010 to 2014, political participation in areas affected by school closures increased more than elsewhere in the city, an increase that was driven by affected Black residents attending more political meetings. These individual-level processes were consistent with aggregate-level electoral changes that took place across those areas affected by the wave of school closures: areas near closed schools were more likely to mobilize for a ballot measure designed to support local schools and saw relative increases in voter turnout in the next local election (and greater shifts against the official responsible for the change). These electoral outcomes are consistent with 2015 election-day exit polling, which indicated that CPS policy was the most frequently indicated concern among voters and that a majority of voters opposed closures.Footnote 23
Still, the evidence presented is not without its limits. In the aggregate analysis, parents/guardians with children are pooled with everyone else, thus making it unclear the extent to which those directly affected (parents) may be driving the results. To partially account for this possibility, we found that the proportion of residents with children currently in school does not appear to be associated with changes in turnout (or affect the key association of interest). Similarly, including a measure of “children in the home” in the individual-level analysis does not affect results (the variable is not significant in any model we tested). This finding is consistent with other recently published research on racial attitudes toward closures, which finds that less than 30% of those who attended the 2013 community meetings about closure were parents directly affected by them (Nuamah Reference Nuamah2020a). The vast majority were members of the community, public officials, teachers, and staff. These findings provide suggestive evidence that school closures mobilized more people than just those students and parents directly affected.
Future work on place-based mobilization may also benefit from incorporating a systematic analysis that includes questions on experiences with public school closure to buttress the individual-level analyses and better understand the mechanisms.Footnote 24 While qualitative data is not the core of this particular analysis, collected ethnographic observations provide strong evidence that community meetings acted as key sites of political learning, prompting heightened levels of racial coidentification and mobilization for Black residents (see Nuamah Reference Nuamah2020b). In a sense, this is an inversion or complication of the way linked fate is usually modeled as a driver of participation—in circumstances like this, grassroots participation may contribute to beliefs about racial consciousness, which then prompt changes in the political behaviors that scholars more commonly assess such as voting. More fine-grained data, with more measures of relevant concepts, are required to evaluate this possibility.
Qualitative data can also provide important insights on the gender dynamics that may be operating in the analysis. For instance, the late Karen Lewis, a Black woman, led the Chicago Teachers Union and ran for mayor against Rahm Emanuel in 2015 before falling ill and supporting the eventual challenger Chuy Garcia. If we accept the empowerment thesis of participation, this descriptive representation should have a positive effect on mobilizing Black women in communities facing school closure. In our survey data, women are more likely to participate, though this is also true before the closures. At the same time, in the ethnographic observations of community meetings, we observe that even as women participate at high rates as attendees and leaders, men appear to still represent a disproportionate percentage of those who spoke at the mic. While women in the context of school closures would likely be comfortable speaking up, they still have to share speaking time with men that are affected. As Kathlene (Reference Kathlene1994) argues, once women become the majority, men become more aggressive. Further, Karpowitz, Mendelberg, and Shaker (Reference Karpowitz, Mendelberg and Shaker2012) reveal that men may use their minority status to tilt equality in a context where all participants must agree on a single solution. A future investigation would benefit from using qualitative data to center gender alongside race and class in participation around school closure.
Ultimately, the quantitative data available allows us to observe patterns supporting the theoretical predictions of the place-based mobilization model. These findings have empirical and substantive implications for research on the political responses to real-world policy changes among otherwise low-participation citizens across multiple modes of inquiry. First, this research is critical for expanding the way in which one defines and measures experience to include meanings beyond direct formal encounters with a policy to an embedded contextual engagement through one’s community. It also extends this literature by demonstrating the behavioral changes that result after a concentrated policy change is implemented within a racially and economically segregated community. In so doing, it highlights the role of “community” as a site of coidentification and political action for marginalized groups. Second, these findings contribute to literature on policy feedback by demonstrating how education policies related to the removal of public schools have broader consequences for electoral and nonelectoral participation, thereby expanding not only the school policy areas on which this literature focuses but also the political outcomes of interest examined.
Finally, while we test this theory with evidence from public school closures, we expect that this model may provide a blueprint for analyses of other important policy decisions that often have racially and geographically concentrated effects that are felt most powerfully by poor communities across the United States in areas such as policing, environmental justice, and economic development. Because these decisions are often made at the local level, citizen mobilization around them and their effects should be studied at the local level as well. These are outcomes that are likely obscured in national samples with questions about national issues. In sum, by bridging research on policy feedback with that on local politics and participation, we demonstrate that, even within a single political jurisdiction, there can be significant differences in feedback effects by race and neighborhood.
Conclusion
Citizens’ political attitudes and behavior are shaped by the communities in which they are embedded and the institutions that anchor those communities. Public schools represent these types of institutions for many Americans, but especially those with lower levels of socioeconomic resources or interest in national politics. For Black Americans that reside in neighborhoods segregated by race and class, schools represent some of the first institutions in which they held leadership roles and the last public institutions in their communities (Todd-Breland Reference Todd-Breland2018). Accordingly, when political scientists focus on issues involving institutions that Black people engage with as part of their social and neighborhood context, we gain insights into the effects of the local place-based policy experiences that most affect their lives. These insights clarify the tension between the apparent low engagement at the local level, as shown in the literature, and the intense waves of political action that are often observed on the ground by demonstrating how the former often fails to focus on areas for which local citizen participation may be the most consequential.
Several recent articles have sought to remind the field of the usefulness of understanding “politics from below” and how predominantly Black communities have experiences with the state that are fundamentally different from those of the white, suburban, middle-class voters that are typically examined in nationally representative samples (Michener, SoRelle, and Thurston Reference Michener, SoRelle and Thurston2020; Weaver, Prowse, and Piston Reference Weaver, Prowse and Piston2019). Our analysis provides a model of how movements from below can be productively wedded to quantitative research approaches to assess aggregate changes. We suggest that if political scientists look locally and ask appropriate questions, then they will likely find relatively high levels of political engagement on display from even the most traditionally “demobilized” communities. This approach would also enable us to move away from the question of whether disadvantaged groups participate to the question of what their participation yields. For example, we might instead investigate the role of low levels of democratic responsiveness, as opposed to resources, in diminishing the participation (or fostering the “collective participatory debt”) of politically marginalized groups (Nuamah Reference Nuamah2020b).
The mass political protests for racial justice in 2020 were national in scope but often set off by very local events. Most policy changes that result will be the result of continued contestation at the local level. It will require residents of neighborhoods that may have no direct experience with these policy changes to band together with those members of their community who were directly affected to engage in political mobilization in the various ways they deem influential. This means their efforts may not translate to participation in subsequent general elections or to increased political knowledge on national level issues, but instead will likely have dramatic effects on their local level engagement and thus the policies applicable to their everyday lives. In our view, this is the political action that matters the most in any study of democracy in that it centers on the participation of those who are most frequently targeted but so often ignored because national conversations and electoral choices seldom engage with the issues that are closest to home. And through their participation, we find not another story of uninformed, unengaged voters, but rather of rational citizens doing their part to hold democracy accountable to all it promises.
Supplementary Materials
To view supplementary material for this article, please visit http://dx.doi.org/10.1017/S0003055421000307.
DATA AVAILABILITY STATEMENT
Research documentation and/or data that support the findings of this study are openly available at the American Political Science Review Dataverse: https://doi.org/10.7910/DVN/YZHHPX.
ACKNOWLEGMENTS
We would like to thank Reuel Rogers, Traci Burch, Quinn Mulroy, Spencer Piston, Jaime Dominguez, Katherine Conte, Jessica Trounstine, John Holbein, the anonymous reviewers, and the attendees at our session at the Midwest Political Science Association Annual meeting for their comments on earlier versions of this manuscript. Most importantly, we would like to thank the predominately Black communities in Chicago for their persistent struggle against the closure of their schools. We hope this work honors their indelible labor.
All Correspondence should be sent to Sally A. Nuamah, Sally.Nuamah@Northwestern.edu.
FUNDING STATEMENT
This collaboration was supported in part by a fellowship at the Center for the Study of Democratic Politics and the University Center for Human Values at Princeton University.
CONFLICT OF INTEREST
The authors declare no ethical issues of conflicts of interest in this research.
ETHICAL STANDARDS
The authors declare that the human subjects research in this article was deemed exempt from review by the Northwestern University Institutional Review Board.







Comments
No Comments have been published for this article.