Introduction
Continental Antarctica offers a harsh environment where biological processes are slow. The terrestrial vegetation is sparse and consists of lichens, mosses, algae and endolithic microorganisms, but no vascular plants (Longton Reference Longton1988). Melick & Seppelt (Reference Melick and Seppelt1997) estimated the time available for plant growth to 6–10% of the year for lichens, and radial growth rates of lichens at continental localities have been measured as low as 0.01 mm yr-1 (Green et al. Reference Green, Seppelt, Sancho, Pugnaire and Valladares1999). This means that the development of lichen communities is a slow process, which may be negatively affected by human disturbance. According to the Protocol on Environmental Protection, “procedures shall be put in place, including appropriate monitoring of key environmental indicators, to assess and verify the impact of any activity that proceeds following the completion of a comprehensive environmental evaluation” (Protocol on Environmental Protection in the Antarctic Treaty, Annex I, Article 5). This means that every country which runs research activities in Antarctica should assess the environmental impact of these activities. Monitoring the lichen and bryophyte vegetation is an important part of this commitment and consequently this is part of the Environmental Project run by the Swedish Antarctic Research Programme SWEDARP (Modig Reference Modig and Grönlund1999).
Besides direct human impact, there are growing concerns and evidence of climate change impacts on the fauna and flora of Antarctica (e.g. Smith Reference Smith1994, Barbraud & Weimerskirch Reference Barbraud and Weimerskirch2001, Robinson et al. Reference Robinson, Wasley and & Tobin2003, Wall Reference Wall2005). In maritime parts of the Antarctic continent, lichen and moss communities may possibly respond relatively quickly to climate change (cf. Smith Reference Smith1995). At inland sites, on the other hand, the response may be slower due to the low growth rates. In Yukidori Valley in continental East Antarctica, Kanda & Inoue (1994) found no increase in growth of lichens over five and fourteen years, and in the Windmill Islands, Melick & Seppelt (Reference Melick and Seppelt1997) concluded that recent vegetation changes appeared to be much less drastic than those reported from sub-Antarctic regions. There are still very few studies on long-term changes in inland lichen and moss communities in Antarctica. Recently, however, a network of sites for monitoring the terrestrial vegetation has been established in Victoria Land (Cannone 2006).
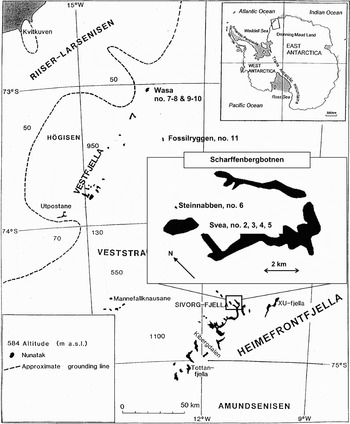
Sweden runs two summer season research stations in inland Dronning Maud Land: Svea, built in 1988 at 74°34′S, 11°13′W in Heimefrontfjella, and Wasa, built in 1989 at 73°02′S, 13°24′W in Vestfjella (Fig. 1). SWEDARP carries out environmental monitoring at these stations, including chemical analyses of soil samples and monitoring of snow cover (Modig Reference Modig and Grönlund1999). As part of this monitoring programme, permanent plots for monitoring the terrestrial vegetation, formed by lichens and mosses, were established during the summer of 1991–92 (Thor Reference Thor1997). The plots were established along transects located at various distances from the stations, in order to evaluate the possible impact of human activities around the research stations. Besides being used for monitoring human impact, the plots may also provide valuable reference data for assessments of overall changes in the plant communities in continental Antarctica, caused by environmental factors such as climate change, increased nutrient loads and UV-B radiation.
The general location of Dronning Maud Land, and of the Swedish research stations Wasa and Svea in the Vestfjella and the Heimefrontfjella, respectively. Wasa station (transect 7–8 and 9–10) is located on the nunatak ‘Basen’. Transect number 11 is located on the nunatak ‘Fossilryggen’. Svea is located at the northern end of Haldorsentoppen, where transect number 4 is located immediately next to the station, and transect no. 2, 3 and 5 at increasing distances south of the station. Transect 6 is located on a small nunatak ‘Steinnabben’, located c. 4 km north of the station.

In the summer of 2001–02, the permanent plots established by G. Thor in 1992 were re-examined by P. Johansson. The main objective in this paper is to evaluate overall changes in lichen and moss species density and species abundance over ten years, and determine whether human activities at the research stations may have affected the lichen and moss communities.
Methods
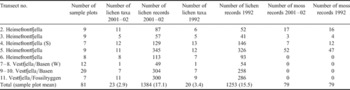
Between 27 January and 10 February 1992, G. Thor established 11 permanently marked transects with increasing distance from the Swedish research stations Wasa and Svea (Thor Reference Thor1997). In this paper we treat transect numbers 7 and 8, and numbers 9 and 10 (in Thor Reference Thor1997) as one transect, respectively, because they were located with adjoining transect ends (Table I). The transects were subjectively located by Thor (Reference Thor1997) at sites as similar as possible in species composition. At each research station, one transect was established at the nearest site supporting lichens, at Wasa c. 30 m from the station (transect no. 7–8; Table I) and at Svea c. 10 m from the station (no. 4). Transects were also established at different distances from the station, at Wasa c. 400 m from the station (no. 9–10; Table I), and at Svea c. 500, 1000, 2000 and 4000 m (no. 2, 3, 5 and 6; Table I, Fig. 1). The rationale for the location of the transects was that the transects closest to the research stations were assumed to reflect local human environmental impact. The transects further away from the stations were assumed to represent reference conditions with low human impact. Further, the latter transects should reflect changes caused by global human impact from e.g. climate change and increased UV-B radiation (Thor Reference Thor1997). One transect was established at the nunatak ‘Fossilryggen’, c. 40 km from the Wasa station (no. 11; Fig. 1). In 1991–92, Fossilryggen was used for a small, mobile field station, which has not been in place since then. The altitude for the transects at Svea (2, 3, 4, 5 and 6) is c. 1250 m, at Wasa (7–8, 9–10) c. 450 m, and at Fossilryggen (11), c. 700 m.
Transect information on the number of sample plots per transect surveyed in both 1992 and 2001–02, and for these sample plots, the total species number per transect and total number of lichen and moss records per transect. Transect numbers refer to Thor (Reference Thor1997).

W indicates the transect closest to Wasa station and S indicates the transect closest to Svea.
The end points of the transects are permanently marked by aluminum stakes or by 20 mm diameter holes drilled in the rock. The length of each transect is 30 m, except for the Svea transect (no. 4), which is 11.7 m. Along each transect, sample plots measuring 0.5 × 0.5 m were established at every 3 m, starting 1 m from the transect starting point. If the conditions (e.g. snow cover) did not allow establishment of a plot at the given interval, the plot was excluded. The number of sample plots along the transects varied between 9 and 18 for a total of 120 plots. For a detailed description of the study area and transect sites, see Thor (Reference Thor1997).
In both surveys, we used the same wooden frame of 0.5 × 0.5 m as the sample plot (see fig. 8 in Thor Reference Thor1997). The location for each sample plot along the transects was marked by spray-painted stones at each corner of the plot. The 1992 markings were generally easy to find in 2001–02, but were improved during the latter survey. The sample plot was divided in 25 quadrats of 10 × 10 cm by a grid of wires in the wooden frame.
Within each sample plot, all lichens were identified and recorded at species level. The frequency of each species was calculated as the number of quadrats in which it occurred (values from 1–25). The following principles were used during the surveys: 1) thalli thate were not attached to the ground were excluded, 2) lower sides of pebbles were examined and pebbles were returned to original position, 3) the host of Carbonea vorticosa was excluded when impossible to determine, 4) excluding dead thalli, and 5) mosses were not recorded at species level but only as ‘moss’. The dominant moss species in the area is Sarconeurum glaciale (C. Muell.) Card. & Bryhn, and all moss records within the sample plots probably belonged to this species. In the 2001–02 survey, Buellia lignoides was not separated from Buellia spp. in the field. Rhizoplaca melanophthalma s.lat. might also include Lecanora fuscobrunnea C.W. Dodge & G.E. Baker. No distinction between these two species were made in the field.
The sample plots were re-examined by P. Johansson between the 14 December 2001 and 20 January 2002. The snow cover during this period was extensive and therefore several of the initial 120 plots could not be examined. Plots which were partly covered by snow were also excluded. In total, 81 of the initial 120 plots were examined during 2001–02. Transect number 1 (18 sample plots; see Thor Reference Thor1997), was totally covered by snow and the only transect that had to be excluded in 2001–02.
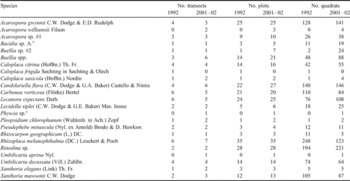
The nomenclature follows Øvstedal & Lewis Smith (Reference Øvstedal and Lewis Smith2001), but a few authors have been corrected (see Table II). Caloplaca frigida (as Caloplaca aff. approximata (Lynge) H. Magn. in Thor Reference Thor1997) was described by Søchting & Olech (Reference Søchting, Olech, Schroeter, Schlensog and Green2000) and is mentioned in a footnote in Øvstedal & Lewis Smith (Reference Øvstedal and Lewis Smith2001). All original data for 2001–02 are archived at the Swedish Polar Research Secretariat. Data for 1991–92 are published in Thor (Reference Thor1997).
Number of transects, plots and quadrats for the lichen taxa recorded in the 1992 and 2001–02 surveys. Unidentified records not included.
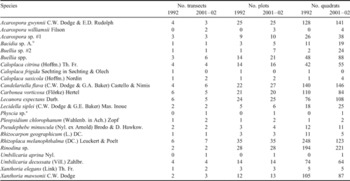
¤Bacidia trachona (Ach.) Lettau in Thor (Reference Thor1997), *Refers to either Physcia caesia (Hoffm.) Fürnr. or P. dubia (Hoffm.) Lettau.
Statistical analyses
In the statistical analyses we only used the 81 sample plots that were surveyed in both 1992 and 2001–02. To test for changes in the terrestrial vegetation between the surveys we used the difference in lichen species density and abundance, respectively, for each sample plot (2001–02 value minus the 1992 value). Species density was defined as the number of lichen species per sample plot. Unidentified lichens were included as a separate species for a sample plot if they could not be linked to any of the present species within the plot. Lichen abundance was defined as the total number of lichen records per sample plot, adding the quadrat frequencies for each species present in the sample plot. Mosses were not included in the statistical analyses of species density and abundance.
First, we tested for overall changes in lichen species density and abundance, irrespective of transect location, between 2001–02 and 1992. Such changes could reflect regional and large-scale environmental changes. These overall changes were tested for by one-sample t-tests using the difference between the 2001–02 and the 1992 values for species density and abundance, respectively, for all 81 sample plots. The t-test examined whether these differences were deviating from zero across all transects (if zero, then the test indicate no overall change).
Second, we tested for variation among the transects in terms of changes in species density and abundance, in order to evaluate possible local human impact on the terrestrial vegetation caused by activities closest to the research stations. To test for such variation among the transects we used General Linear Models (GLM). Besides testing the effect of transect as an independent variable, we included the initial values of species density and abundance from the 1992 survey as covariates in these models. The rationale for this was that the 2001–02 values, and thereby the differences in species density and abundance, can depend on the initial density and abundance, which can be limited by the species pool and plot size, respectively. It is also biologically relevant to examine these relationships because dispersal and colonization within a sample plot can depend on the initial abundance. To evaluate the GLMs, the residuals were checked for normality and independence.
Results
We recorded 23 lichen taxa in the 81 plots surveyed in both 1992 and 2001–02 (Tables I & II). The number of moss records was 79 in both surveys (Table I). In general, the results showed high consistency between the surveys although they suggest a slight overall increase in both species density and abundance (Tables I & II).
Species density
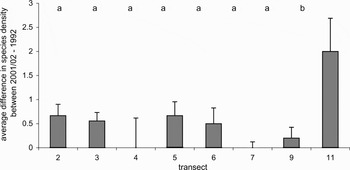
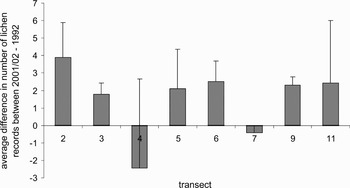
Lichen species density ranged from 0–9 species per sample plot at both surveys. The average species number per plot was 2.91 in 1992, and 3.39 in 2001–02, with an average increase by 0.44 ± 0.24 species per plot. The one sample t-test indicated this difference as an overall significant increase in species density per sample plot between the two surveys (t = 3.73, P < 0.001, n = 81). This increase in species density was seen for all transects except for number 4 and 7, which were the transects next to the research stations, Svea and Wasa, respectively (Fig. 2). The strongest increase in species number per sample plot was found for transect 11, located at the nunatak ‘Fossilryggen’ (Fig. 2). For this transect, we found an average increase of two species per sample plot (Fig. 2).
Transect-wise average difference in lichen species density per sample plot between 2001–02 and 1992 (± s.e.). Different letters indicate significant differences among transects at the P < 0.05 level in pairwise comparisons with the least square means from the GLM model.

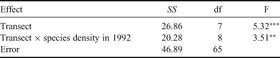
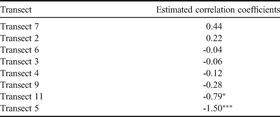
The GLM indicated that there was a significant difference among the transects in terms of the difference in species density per sample plot between the surveys (Table IIIa, model R2 = 0.49, F = 4.17, P < 0.001). This difference was due to the higher increase in species density in transect 11 compared with all other transects, which did not differ (Fig. 2). In the GLM, the interaction term between the initial species density in 1992 and transect was significant (Table IIIa). This means that the relationship between the initial species density in 1992 and the difference in species density between the surveys varied among the transects. The relationship was positive for transect 2 and 7, while negative for the other transects (Table IIIb). Significant negative relationships were found for transect 5 and 11 (Table IIIb). This means that in these transects, the increase in species number was highest in the sample plots with the lowest number of species in 1992.
Results from the GLM for the difference in lichen species density (species number per sample plot) between 2001–02 and 1992. The independent variables in the model were transect, species density in 1992 and the interaction term between these variables. Species density in 1992 is not included in the table since the interaction term was significant in the model.
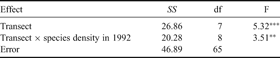
** = P < 0.01, *** = P < 0.001
Transect-wise correlation coefficients for the relationship between the 1992 value of species density and the difference in species density between the two surveys.
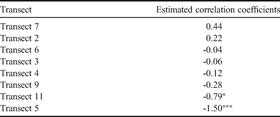
* = P < 0.05, *** = P < 0.001
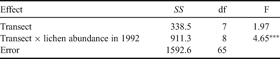
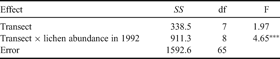
Results from the GLM for the difference in lichen abundance (total number of lichen records per sample plot) between 2001–02 and 1992 The independent variables in the model were transect, lichen abundance in 1992 and the interaction term between these variables. Lichen abundance in 1992 is not included in the table since the interaction term was significant in the model.
*** = P < 0.001
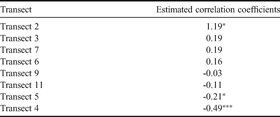
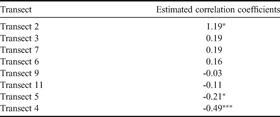
Transect-wise correlation coefficients for the relationship between the 1992 value of number of lichen records and the difference in the number of records between the two surveys.
* = P < 0.05, *** = P < 0.001
Lichen abundance
As for species density, there was a slight overall significant increase in lichen abundance, given as the number of lichen records, between the 2001–02 and 1992 surveys (t = 2.69, P < 0.01, n = 81). In 1992, the number of lichen records per sample plot ranged between 0 and 68, with an average of 15.47, and in 2001–02, between 0 and 71, with an average of 17.09 lichen records per plot. The average increase was 1.74 ± 1.29 number of lichen records per plot between 2001–02 and 1992.
Due to large variations among the sample plots, the GLM did not show any statistical differences among the transects in terms of change in lichen abundance between 2001–02 and 1992 (Fig. 3, Table IVa). However, the interaction term between transect and the 1992 number of records was significant (Table IVa, model R2 = 0.41, F = 3.02, P = 0.001). This was caused by a positive relationship between the increase in number of lichen records and the 1992 number of records in transect 2, while this relationship was negative in transect 4 and 5 (Table IVb). In these transects (4 and 5), sample plots with a high initial number of records showed no change or a decrease in lichen abundance (the number lichen records). In transect 4 this was largely caused by one sample plot, with 59 lichen records in 1992 compared with 28 in 2002. This was the largest decline among all the sample plots surveyed and mainly caused by a reduction of Rhizoplaca melanophthalma and Umbilicaria decussata. The decrease of these species at this site was clearly caused by damage from work around the Svea station, and the most obvious example of local human impact on the vegetation around the research stations.
Transect-wise average difference in lichen abundance (number of lichen records) per sample plot between 2001–02 and 1992 (± s.e.). No significant differences among transects were found in pairwise comparisons with the least square means from the GLM model.

Lichen species
For most species we found slightly more records in 2001–02 than in 1992 (Table II). This suggests that the slight overall increase in lichen abundance was caused by a small increase for the majority of the species. In contrast, Rhizoplaca melanophthalma, which was the most common species in 1992, showed a 50% decrease, counted as the number of quadrats, between the surveys (Table II). The total number of sample plots with R. melanophthalma, however, was 35 in both 1992 and 2001–02, of which 32 were the same sample plots in both surveys.
Xanthoria mawsonii is a conspicuous species with fewer records in 2001–02 than in 1992 (Table II). This was caused mainly by fewer records in transect, where a total of 88 records were found in 1992, compared with 70 in 2002. This transect is located c. 2000 m from the Svea station where the local human impact is low. In that same transect, also Candelariella flava, seemed to have decreased from 92 records in 1992 to 80 in 2002.
As already pointed out, transect 11 showed the largest increase in species number. Changes in individual species abundances were also most marked in this transect. The higher number of records for Bacidia sp. A, Buellia sp. #2 and Buellia spp. in 2001–02, originated mostly from transect 11, as well as the decrease of Carbonea vorticosa (23 records in transect 11 between 2001–02 and 1992). Rhizoplaca melanophthalma also showed a strong decline in transect 11 between 2001–02 and 1992 (78 records).
Discussion
This study was part of a monitoring programme to evaluate local human impact on the environment around the Swedish research stations Svea and Wasa (Modig Reference Modig and Grönlund1999). Comparing changes in lichen species density and abundance, and moss abundance, among transects at varying distances from the stations we found very small and local negative impact on the lichen vegetation from human activities over ten years of monitoring. In general, the results instead indicate overall high consistencies and even a slight overall increase in both average lichen species density and abundance per sample plot.
The only example of obvious local human impact in this study was found on the small rock-outcrop immediately behind the Svea station in Heimefrontfjella (transect 4). In this transect the lichens probably had been damage during station maintenance and from keeping equipment on the ground (see fig. 5 in Thor Reference Thor1997). For example Umbilicaria decussata, which is a foliose lichen and therefore likely to be more sensitive to direct physical disturbance than crustose species, was found in six subplots in 2002 compared with 13 in 1992. The transect closest to the Wasa station (transect 7) had partly been affected by tracked vehicles. These tracks were present already in 1992 (fig. 2 in Thor Reference Thor1997). However, the only species recorded in this transect, Rinodina sp., did not seem to be affected by this, although the species did not seem to increase in this transect. Compared with the other transects, the transects located closest to the research stations (transects 4 and 7) were the only ones where we did not observe any increase in either species density or abundance. Any other causes besides physical damage, are probably of minor importance to the terrestrial vegetation around the Wasa and Svea stations. For example, soil contamination has been found to be low and very local (Swartling Reference Swartling2003).
This study indicates a slight overall increase in lichen species density and abundance between 1992 and 2001–02, although the sample plots used in this study may not be representative for the area in this respect. Nevertheless, could such an increase observed over ten years be true? In maritime parts of Antarctica it has been shown that lichen and moss communities can respond relatively fast to climate change and increased nutrient load (Smith Reference Smith1995, Sancho & Pintado Reference Sancho and Pintado2004, Wasley et al. Reference Wasley, Robinson, Lovelock and Popp2006). However, at inland sites, such as our study area, the growth season is short and most lichens are crustose species with low growth rates (Kanda & Inoue 1994, Melick & Seppelt Reference Melick and Seppelt1997, Green et al. Reference Green, Seppelt, Sancho, Pugnaire and Valladares1999). Over longer time spans, however, Brabyn et al. (Reference Brabyn, Beard, Seppelt, Rudolph, Türk and Green2006), demonstrated that algae and mosses, in particular, can show a strong increase in their cover in continental parts of Antarctica. In general, there has been an overall increase of the mean temperature in Antarctica during the last century, although regional variation is large (Vaughan et al. Reference Vaughan, Marshall, Connolley, King and Mulvaney2001). A greenhouse gas driven model has indicated an increase in the mean annual temperature in Dronning Maud Land (Vaughan et al. Reference Vaughan, Marshall, Connolley, King and Mulvaney2001). However, there are no long-term climate records from the study area, but neither a climate model used by van de Berg et al. (Reference Van De Berg, Van Den Broeke, Reijmer and Van Meijgaard2005) to predict the climate from 1980–2004, nor climate records from 1998 and onwards, indicate any increase in average monthly temperatures for December–February at Wasa and Svea stations (Tijm-Reijmer, van de Berg and van den Broeke, personal communications 2006). Thus, we hesitate to use climate trends to support and explain a possible increase in lichens in these areas, but rather await future surveys to confirm this trend.
Examining the relationships between the 1992 data and the observed change in lichen species density and abundance may shed some further light on the increase in lichens. The initial sample plot values of species density showed a weak overall negative relationship with the change in species density. The largest increase in species density was found in plots with a low species number in 1992, while in plots with a high initial species number, no change, a slight increase or a slight decrease was found in 2001–02. In contrast, the initial sample plot abundance in 1992, measured as the number of lichen records, had low effect on the observed change. However, in transect 2, a higher increase of lichen records was found in sample plots with a high initial abundance. The low effect of the 1992 number of records on the observed change in lichen abundance can have both methodological and biological interpretations. Together with the overall negative relationships between the 1992 species density and the change in density, we believe that this supports a true change. Discrepancies between our surveys were more likely to have resulted in an overall positive relationship between the initial data and the observed change; the more records, the more likely it should be to get high differences in terms of absolute values. A positive relationship was found for lichen abundance in transect 2, but this could as well suggest that dispersal at the plot scale and favourable micro-site conditions are important. The negative relationship between initial data and the observed change for species density may result from a low total species pool in this ecosystem. Even though placed in areas with lichen growth, only 10% of the plots had more than five species, which means that the probability of getting many species in a plot is low.
Although our results suggest a slight increase in lichens, there was good consistencies between the surveys, in accordance with Kanda & Inoue (1994). For example, very small occurrences, only a few square millimeters, of conspicious lichens such as Acarospora gwynnii and Candelariella flava, were recorded in the same subplots in both 1992 and 2001–02. In contrast to the consistencies or even weak increase in lichen abundance was the decline of Rhizoplaca melanophthalma. For example, its frequency in the most abundant sample plots in transect 11 in 1992 were 22, 22, and 20 compared with 8, 7 and 5, respectively, in 2001–02. The decrease was found at all sites and might indicate impact from an overall factor, but as such, only acting specifically on R. melanophthalma. The species is fairly conspicuous and therefore we do not believe that our ability to record it in the field could account for the different results between our surveys. G. Thor noticed during fieldwork in 1991–92 that it often looked unhealthy and sometimes observed a lichenicolous Buellia species on the thalli of R. melanophthalma.
There are still very few long-term studies of the lichen and moss vegetation in Antarctica, especially at continental sites. The sample plots in the Wasa and Svea areas cover mosses and all lichen species, and the number of sample plots, 120, is fairly high. This makes them unique and valuable not only for monitoring local human impact but also to detect future overall environmental changes in Antarctica. Our results indicate a slight increase in lichen species density and abundance in our study area, and a species-specific drastic decline of Rhizoplaca melanophthalma. However, it is premature to draw any firm conclusions about the causes of these results. Local human impact was found to be small and very local. However, even if physical disturbance is very local it will make a long-lasting footprint due to the slow growth rates of lichens in continental Antarctica.
Acknowledgements
We are greatful to the Swedish Polar Reseach Secretariat who have initiated this study and supported the field work. During 2001–02 Anders Modig, Sven Lidström, Tomas Karlberg and Anders Bergvall from the Secretariat provided excellent on-site logistic service. We are also grateful to Carleen Tijm-Reijmer, Willem Jan van de Berg and Michiel van den Broeke for kindly providing climate data, to Joachim Strengbom and two anonymous reviewers who provided valuable comments on the manuscript.