1. Introduction
The origin of intracratonic basins is often related to the final evolution stages of rift systems (Leighton & Kolata, Reference Leighton, Kolata, Leighton, Kolata, Oltz and Eidel1990; Oliveira & Mohriak, Reference Oliveira and Mohriak2003). This is recognized in a great number of cases worldwide, where Palaeozoic strata of intracratonic basins are preceded by rift successions (e.g. Hudson Bay in Canada; Baltic in Northern Europe; Delaware, Midland, Illinois and Michigan in the USA; Paris Basin in France; Amazonas, Paraná and Parnaíba in Brazil; Oliveira & Mohriak, Reference Oliveira and Mohriak2003; Allen & Armitage, Reference Allen and Armitage2012; Daly et al. Reference Daly, Fuck, Julià, Macdonald, Watts, Daly, Fuck, Julià, Macdonald and Watts2018). However, in contrast to well-accepted models for the formation of foreland and rift basins, the origin of these huge geotectonic units remains under intense discussion (Daly et al. Reference Daly, Fuck, Julià, Macdonald, Watts, Daly, Fuck, Julià, Macdonald and Watts2018).
The transition from Proterozoic to Phanerozoic eons, after the break-up of Laurentia and Baltica, is marked by the assembly of the Gondwana supercontinent as consequence of a series of collisional events (e.g. Brasiliano Orogeny) (Bond et al. Reference Bond, Nickeson and Kominz1984; Meert & Van Der Voo, Reference Meert and Van Der Voo1997). In western Gondwana, the Neoproterozoic Brasiliano Orogeny (collage of the Amazonian, São Francisco, São Luís cratons and the Parnaíba Block) resulted in numerous Ediacaran–Cambrian continental rift systems, including the Jaibaras Basin (Brito Neves et al. Reference Brito Neves, Fuck, Cordani and Thomaz1984; Castro et al. Reference Castro, Fuck, Phillips, Vidotti, Bezerra and Dantas2014). These rift systems are preferentially oriented in the NE–SW direction and are unconformably overlaid by the sedimentary succession from the Serra Grande Group (Ordovician–Silurian) of the Parnaíba Basin (Oliveira & Mohriak, Reference Oliveira and Mohriak2003; Vaz et al. Reference Vaz, Rezende, Wanderley Filho and Travassos2007; Castro et al. Reference Castro, Fuck, Phillips, Vidotti, Bezerra and Dantas2014).
Despite some recent contributions focused on the basal units of the Parnaíba Basin (e.g. Castro et al. Reference Castro, Fuck, Phillips, Vidotti, Bezerra and Dantas2014, Reference Castro, Bezerra, Fuck and Vidotti2016; Daly et al. Reference Daly, Andrade, Barousse, Costa, McDowell, Piggott and Poole2014, Reference Daly, Fuck, Julià, Macdonald, Watts, Daly, Fuck, Julià, Macdonald and Watts2018; Tozer et al. Reference Tozer, Watts and Daly2017; Coelho et al. Reference Coelho, Julià, Rodríguez-Tribaldos, White, Daly, Fuck, Julià, Macdonald and Watts2018; McKenzie & Tribaldos, Reference McKenzie and Tribaldos2018; Menzies et al. Reference Menzies, Carter and Macdonald2018; Watts et al. Reference Watts, Tozer, Daly and Smith2018; Assis et al. Reference Assis, Porto, Schmitt, Linol, Medeiros, Martins and Silva2019; Caputo & Santos, Reference Caputo and Santos2020; Cerri et al. Reference Cerri, Warren, Varejão, Marconato, Luvizotto and Assine2020), there is still no consensus on which mechanisms were responsible for the genesis of this intracratonic basin. The tectonosedimentary evolution of the Serra Grande Group is widely discussed and some issues regarding the early phase of sedimentation in the Parnaíba Basin are tentatively addressed (Assis et al. Reference Assis, Porto, Schmitt, Linol, Medeiros, Martins and Silva2019), including: (i) the age of the sedimentary succession; (ii) its tectonic significance; and (iii) the palaeogeographic extension of the original depositional site. However, the few studies on the geochronology and stratigraphy of Jaibaras and Parnaíba basins (e.g. de Araújo et al. Reference de Araújo, Cordani, Basei, Castro, Sato and Sproesser2012 a; Hollanda et al. Reference Hollanda, Góes and Negri2018; Menzies et al. Reference Menzies, Carter and Macdonald2018; Assis et al. Reference Assis, Porto, Schmitt, Linol, Medeiros, Martins and Silva2019) do not focus specifically on an integrated model encompassing a comparison of tectonosedimentary origin, age and evolution.
Here we present novel geochronological U–Pb data from the uppermost unit of the Ediacaran–Cambrian Jaibaras Rift Basin (i.e. Aprazível Formation) and the lowermost unit of the Ordovician–Silurian Serra Grande Group, Parnaíba Basin (i.e. Ipu Formation). This analytical approach was adopted in order to answer three key questions concerning: (i) the maximum depositional ages of the Aprazível and Ipu formations; (ii) the similarities and differences in the provenance patterns between these units; and (iii) reconstruction of the palaeogeographic scenario at the initiation of the Parnaíba Basin in western Gondwana.
2. Geological setting
2.a. Jaibaras Basin: sedimentary archive of the rift phase
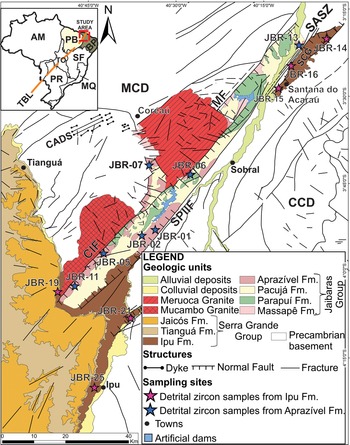
The Jaibaras Basin, bounded by the Sobral-Pedro II, Massapê and Café-Ipueiras faults, is the largest rift basin (120 km long and up to 15 km wide) among the Ediacaran–Cambrian Continental Rift System of the Borborema Province (Oliveira & Mohriak, Reference Oliveira and Mohriak2003; Castro et al. Reference Castro, Fuck, Phillips, Vidotti, Bezerra and Dantas2014; Figs 1, 2). It rests unconformably on Palaeoproterozoic and Neoproterozoic basement rocks encompassing a branch of the Transbrasiliano Lineament, in the boundary between two important crustal domains of the Borborema Province (i.e. the Ceará Central Domain and Médio Coreaú Domain; Figs 1, 3).
Detailed regional geological map of the Ediacaran–Cambrian Jaibaras Basin and the east margin of Parnaíba Basin (compiled from Costa et al. Reference Costa, França, Lins, Bacchiegga, Habekost and Cruz1979; Abreu et al. Reference Abreu, Nascimento, Santos, Veloso and Vilas2014; Gorayeb et al. Reference Gorayeb, Abreu, Santos and Silva Junior2014; Silva Junior et al. Reference Silva Junior, Santos, Moura, Nascimento and Vilas2014). CIF – Café–Ipueiras Fault; SPIIF – Sobral–Pedro II Fault; MF – Massapê Fault; SASZ – Santana do Acaraú Shear Zone; CADS – Coreaú–Aroeiras dyke swarm; SCG – Santana do Acaraú Graben; TBL – Transbrasiliano Lineament; SZ – shear zone; MCD – Médio Coreaú Domain; CCD – Ceará Central Domain. Tectonic provinces: AM – Amazonas; TO – Tocantins; BP – Borborema; MQ – Mantiqueira. Sag basins: PB – Parnaíba; PR – Paraná.

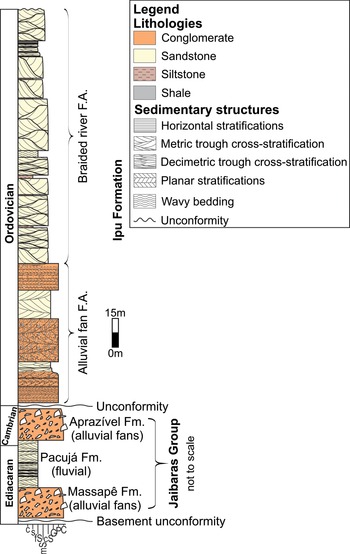
Composite schematic stratigraphic section of Jaibaras Basin (not to scale) and Ipu Formation (Serra Grande Group), showing facies distribution along these sedimentary successions. FA: facies association. The granulometric scale of the stratigraphic section ranges over c: clay; s: silt; fS: fine sand; mS: medium sand; cS: coarse sand; G: gravel; P: pebble; C: cobble.

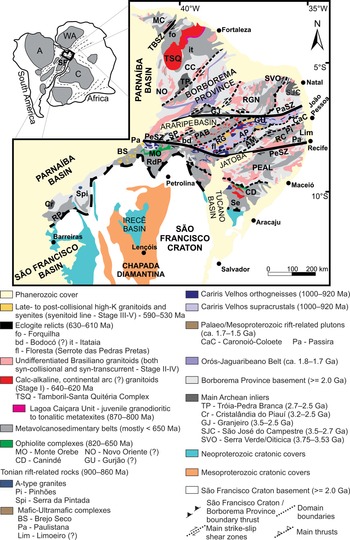
Simplified geological map of the Borborema Province, NE of Brazil (Caxito et al. Reference Caxito, Santos, Ganade, Bendaoud, Fettous and Bouyo2020). A – Amazon Craton; WA – West Africa Craton; C – Congo Craton; SF – São Francisco Craton; RP – Rio Preto; RdP – Riacho do Pontal; Se – Sergipano; PEAL – Pernambuco–Alagoas; RC – Rio Capibaribe; AM – Alto Moxotó; AP – Alto Pajeú; RG – Riacho Gravatá; PAB – Piancó-Alto Brígida; SP – São Pedro; MC – Medio Coreaú; CC – Ceará Central; RGN – Rio Grande do Norte; Sr – Seridó; PeSZ – Pernambuco Shear Zone; PaSZ – Patos Shear Zone; TBSZ – Transbrasiliano Shear Zone.
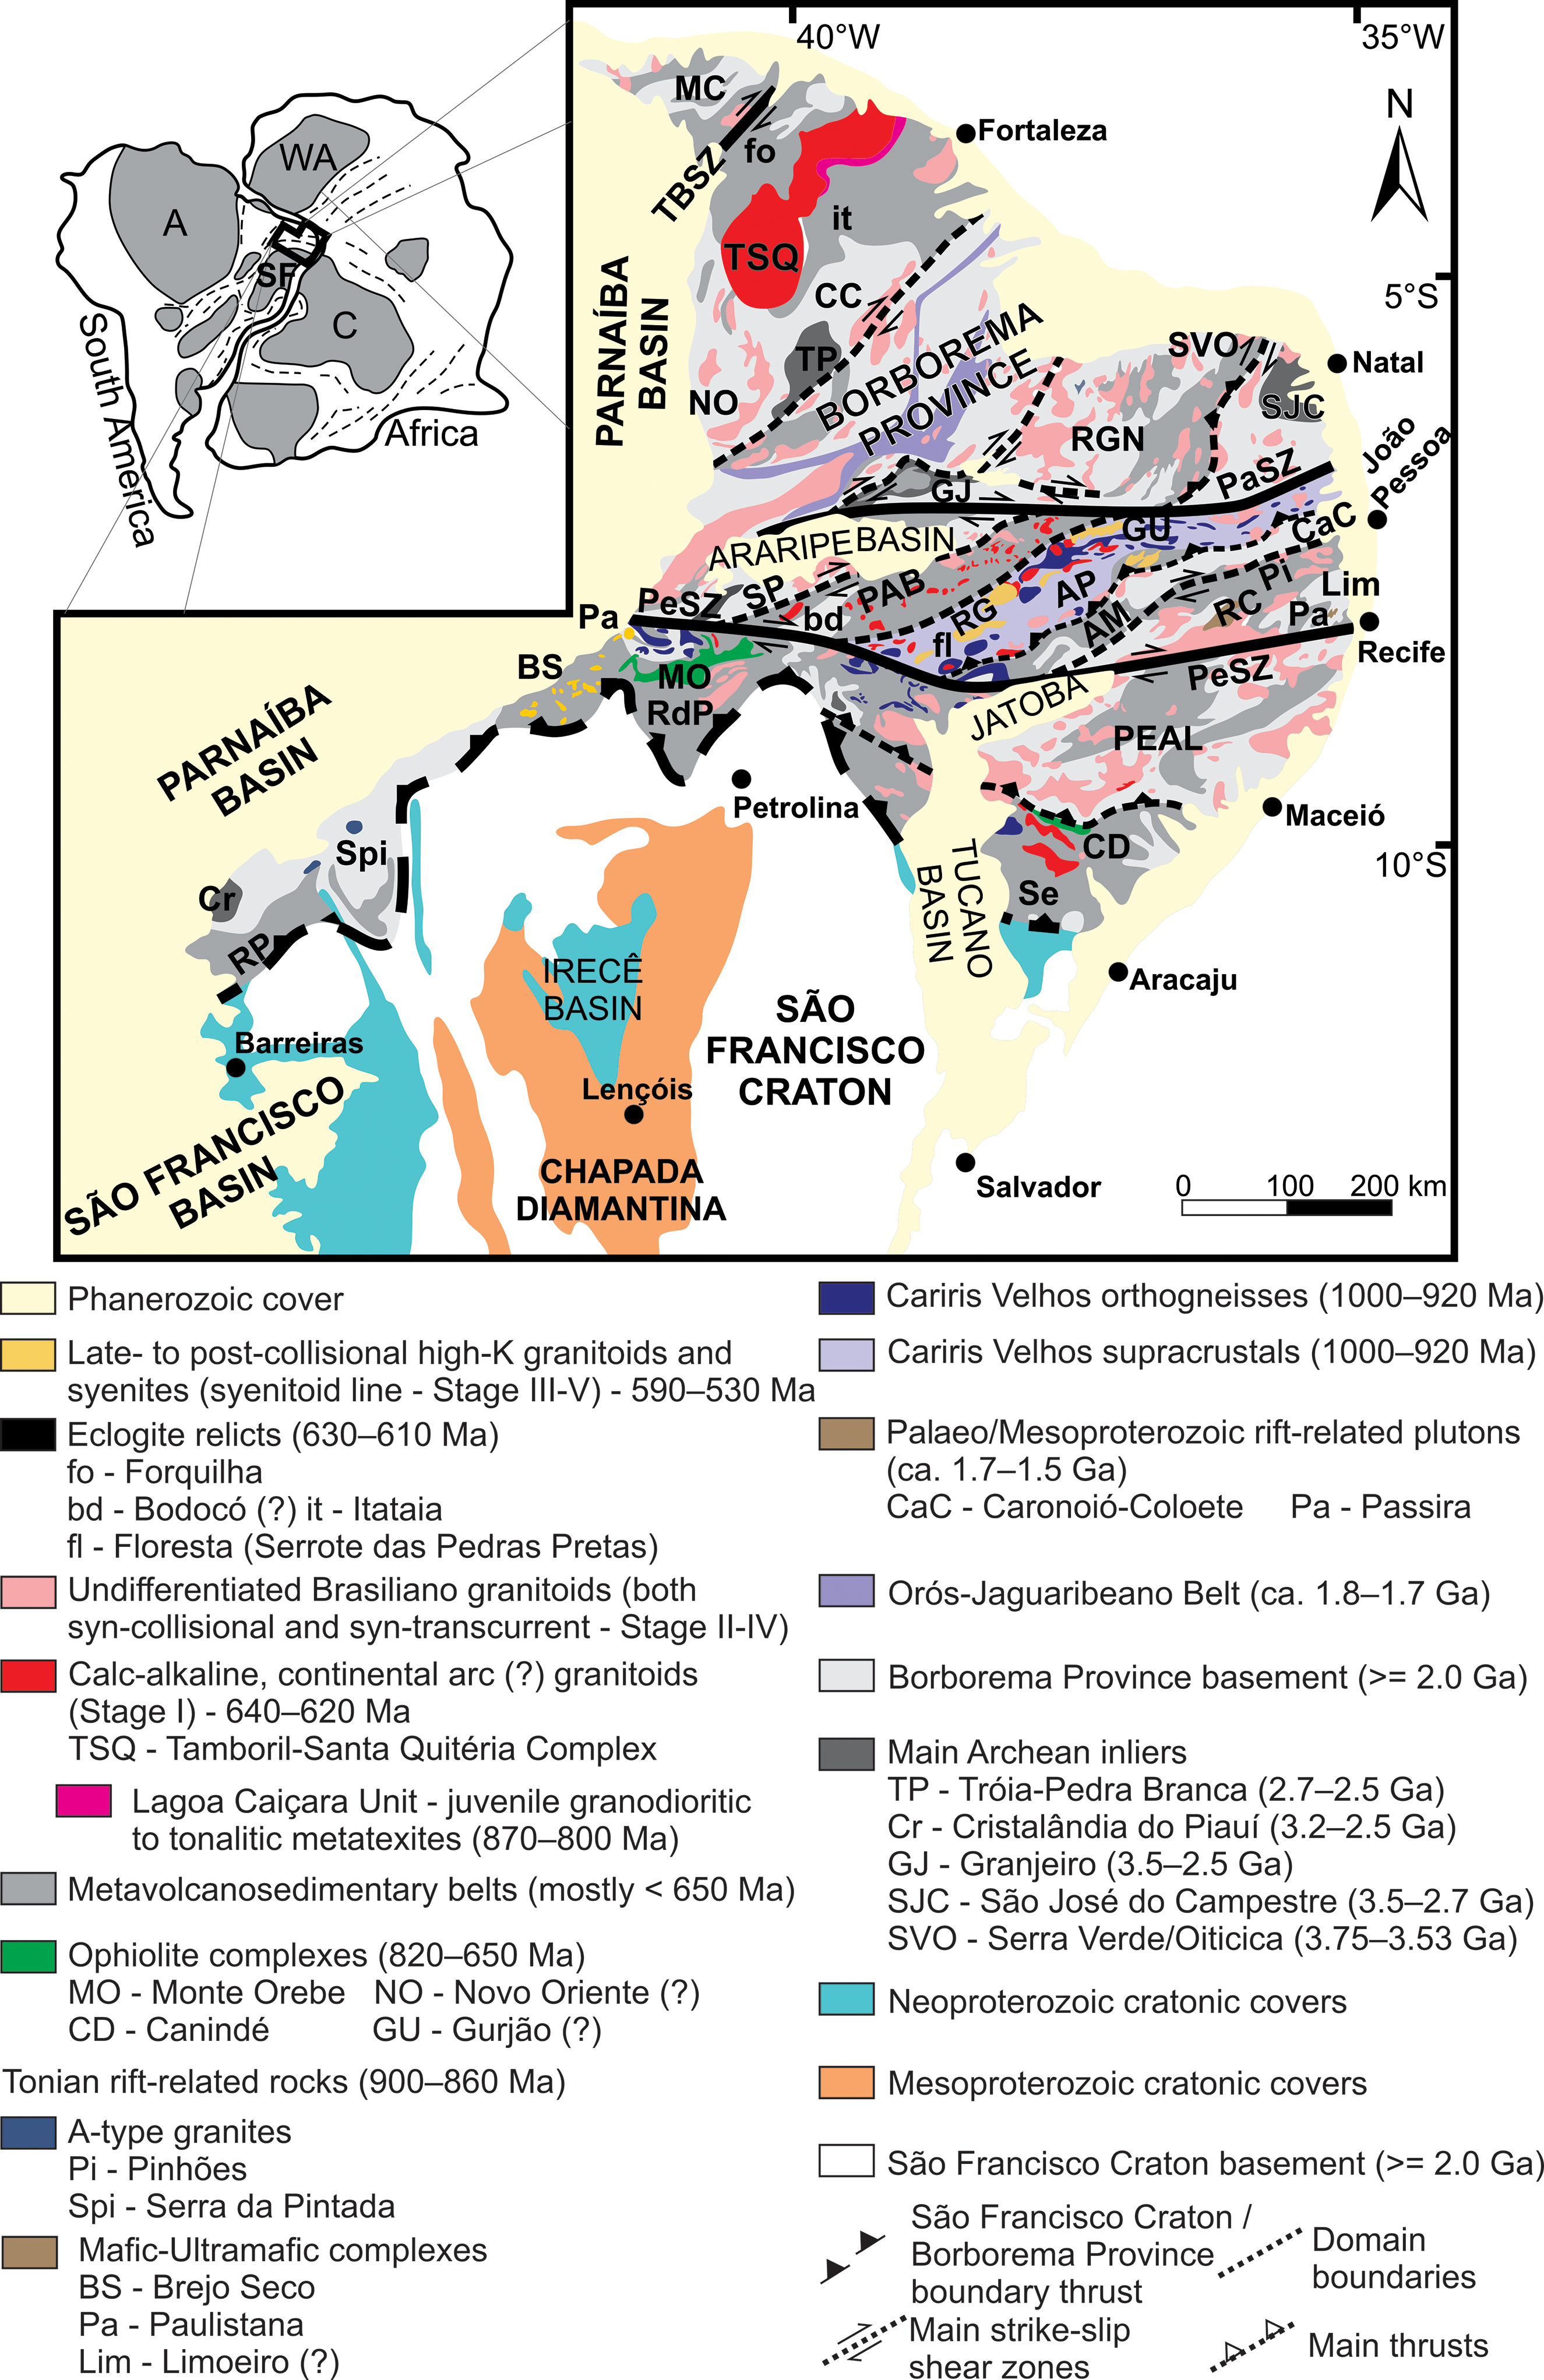
The Ceará Central Domain comprises medium- to high-grade metamorphic rocks, constituting part of the Ceará Complex (Neoproterozoic supracrustal rocks and Archean–Palaeoproterozoic basement) and the Tamboril–Santa Quitéria Complex (Neoproterozoic syn-, late- and post-collisional granite and migmatite complex) (Fetter et al. Reference Fetter, Santos, Van Schmus, Hackspacher, Brito Neves, Arthaud and Wernick2003; Pedrosa Jr et al. Reference Pedrosa, Vidotti, Fuck, Branco, Almeida, Silva and Braga2017; Fig. 3). The Médio Coreaú Domain comprises gneiss and granulites of the Palaeoproterozoic Granja Complex, schists, gneisses and quartzites of the Neoproterozoic Martinópole Group, and low-grade metamorphic rocks of the Neoproterozoic Ubajara Group (Fig. 3). Post-collisional granite and gabbro intrusions related to the Meruoca and Mucambo granites (Fig. 1), and Early Cambrian volcanic and sedimentary rocks from the Jaibaras Basin and Jaguaripi Graben, are also included in the Médio Coreaú Domain (Pedrosa Jr et al. Reference Pedrosa, Vidotti, Fuck, Branco, Almeida, Silva and Braga2017).
The Jaibaras Basin (Figs 2, 4) encompasses two distinct rift sequences: (i) Ediacaran–Cambrian (Alfa Inferior or Rift 1), represented by the Massapê, Pacujá and Parapuí formations; and (ii) Cambro–Ordovician? (Alfa Superior or Rift 2), represented by part of the Parapuí and Aprazível formations (Oliveira & Mohriak, Reference Oliveira and Mohriak2003; Parente et al. Reference Parente, Silva Filho, Almeida, Mantesso Neto, Bartorelli, Carneiro and Brito Neves2004). The basement rocks and sequences of the Jaibaras Basin are intruded by the Meruoca Granite, emplaced at 523 ± 9 Ma (Archanjo et al. Reference Archanjo, Launeau, Hollanda, Macedo and Liu2009) and 541 ± 9 Ma (Santos et al. Reference Santos, Oliveira, Parente, Garcia and Dantas2013), and the Mucambo Granite, dated at 532 ± 7 Ma (Santos et al. Reference Santos, Fetter, Hackspacher, Van Schums and Nogueira Neto2008 a).
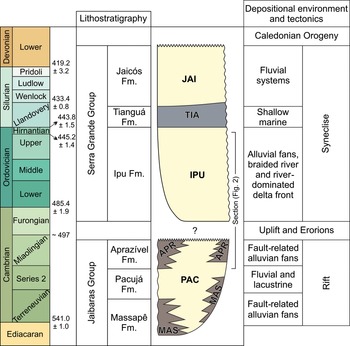
Schematic stratigraphic chart of Parnaíba and Jaibaras basins (modified from Vaz et al. Reference Vaz, Rezende, Wanderley Filho and Travassos2007). The last two columns represent the depositional environment and tectonics settings in which Aprazível and Ipu formations were deposited, respectively.
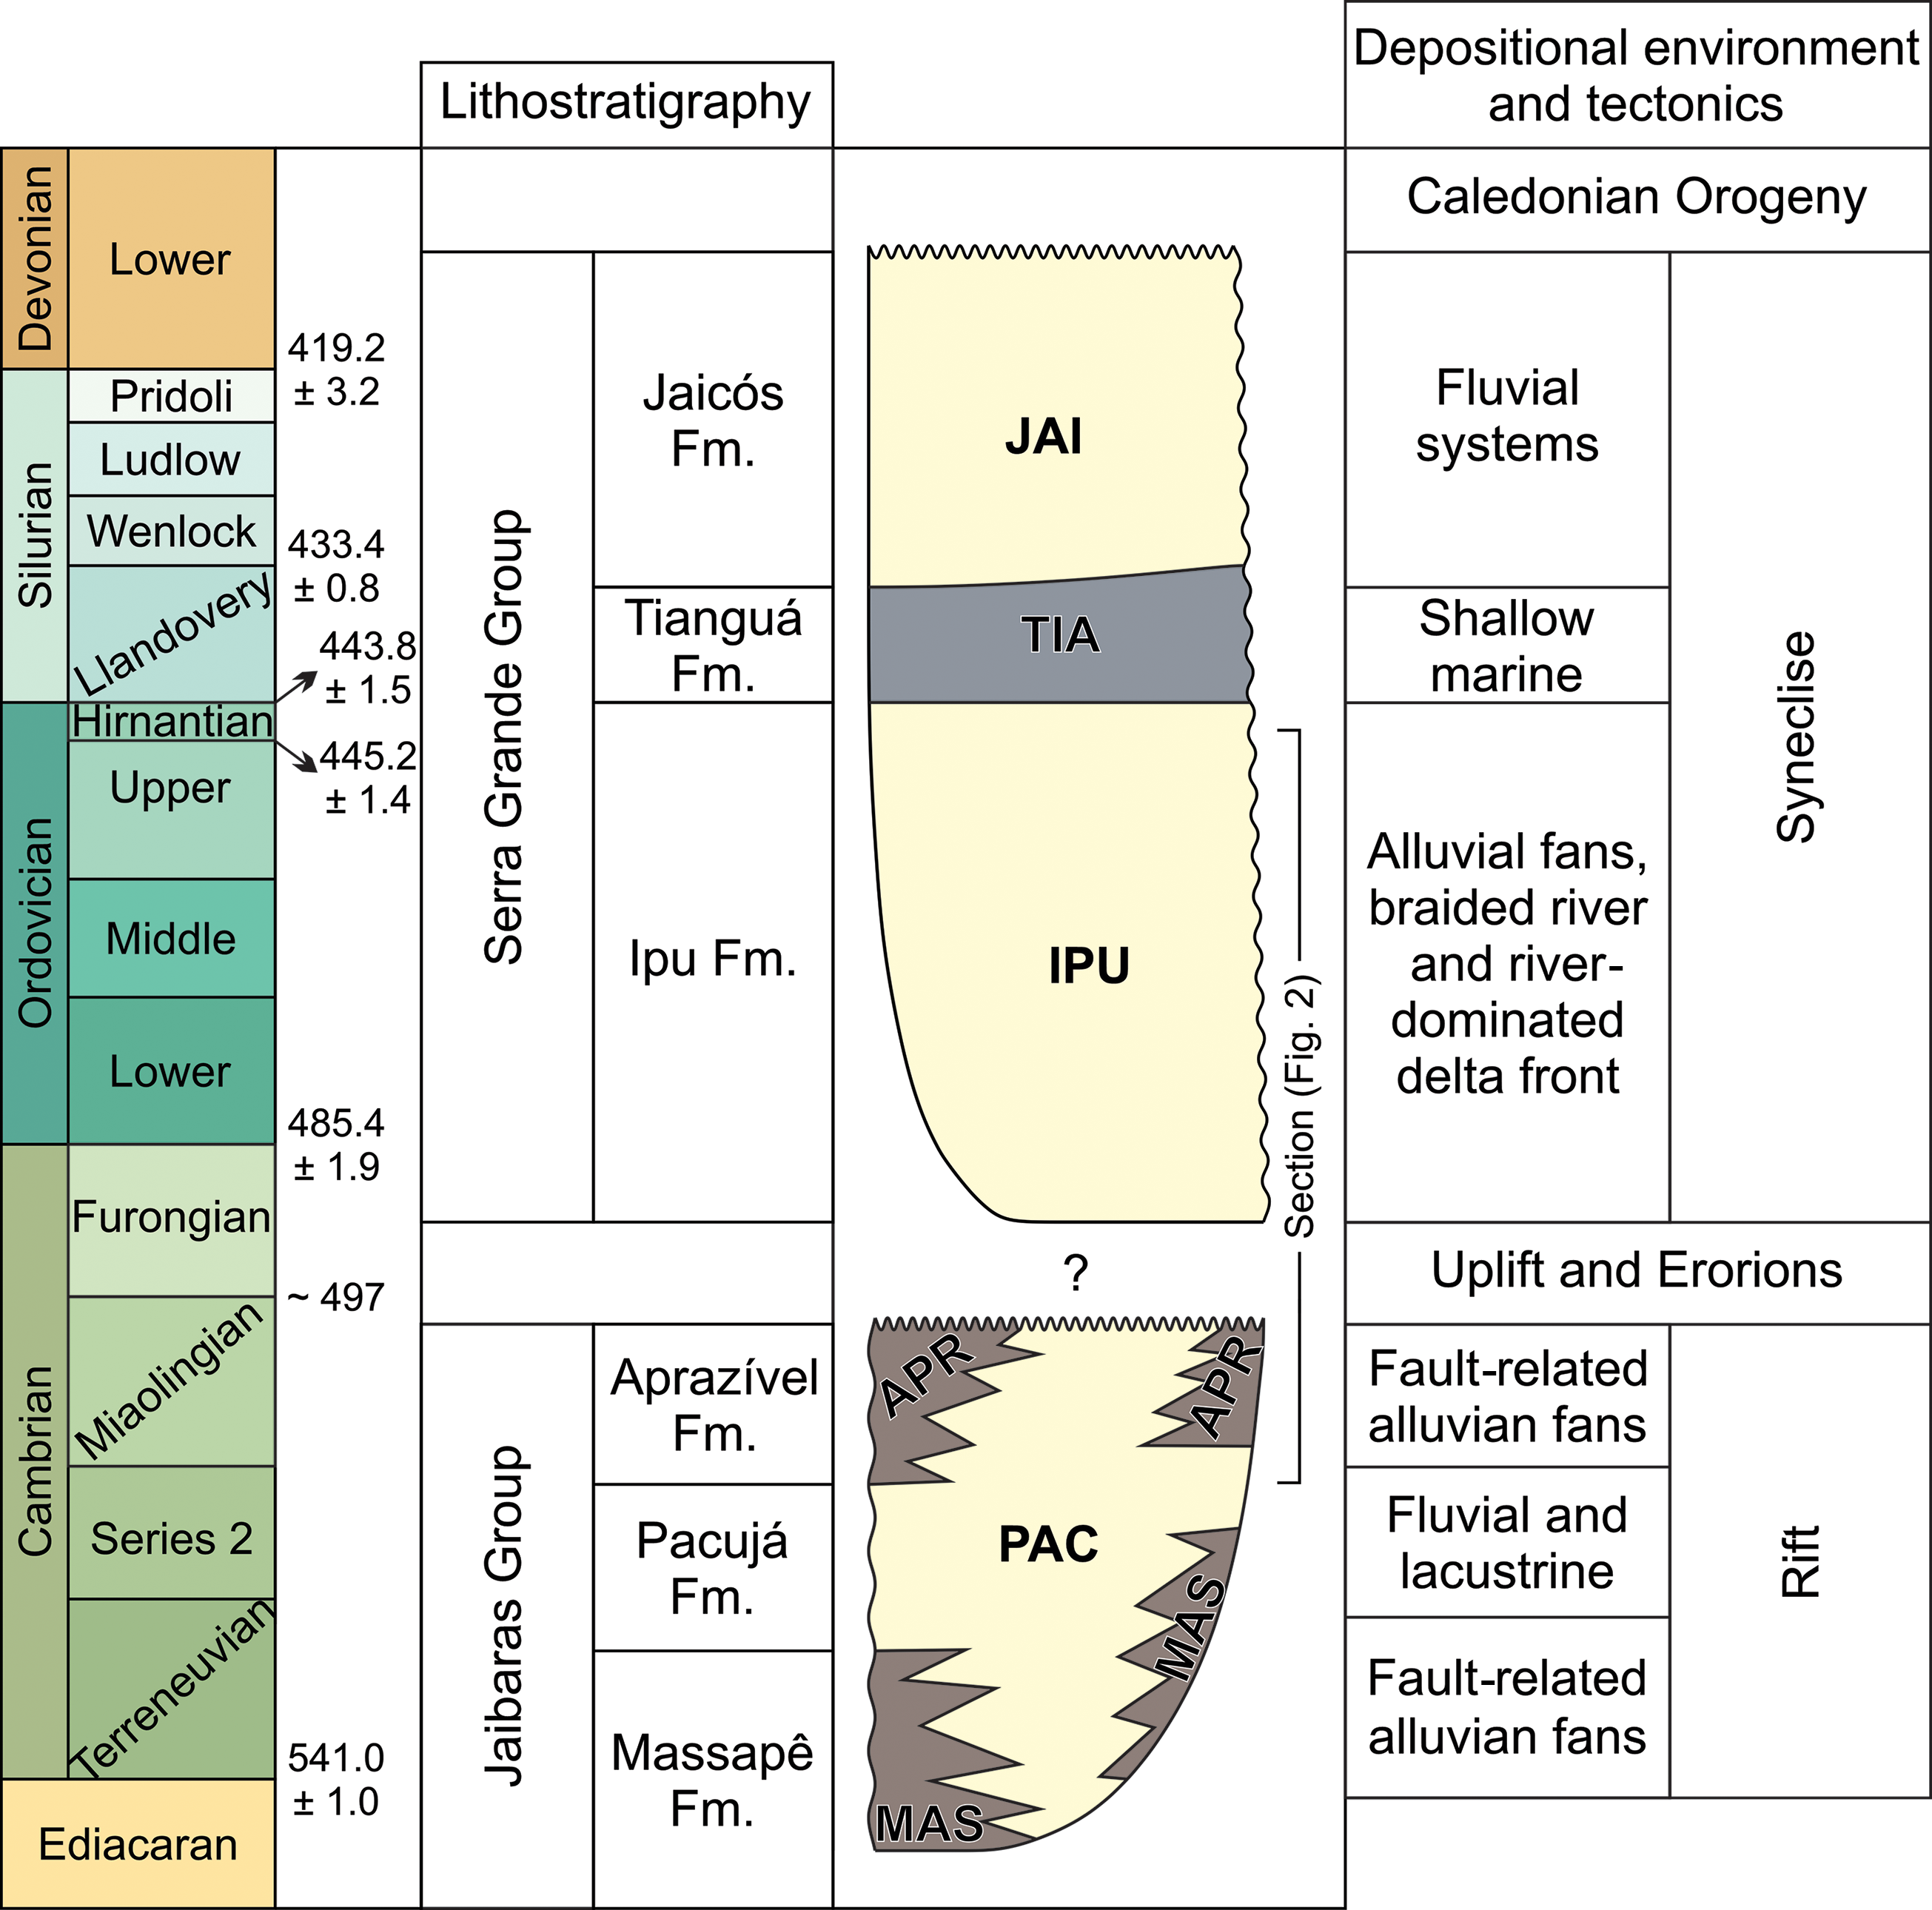
The Massapê Formation, the base of Jaibaras Group (see Figs 1, 2), comprises coarse-grained sandstones and polymictic ortho- to para-conglomerates with arkose matrix and angular to subangular pebbles to cobbles (Costa et al. Reference Costa, França, Bacciegga, Habekos and Cruz1973, Reference Costa, França, Lins, Bacchiegga, Habekost and Cruz1979; Oliveira & Mohriak, Reference Oliveira and Mohriak2003). The conglomerate framework consists of clasts from the surrounding gneiss–migmatitic Precambrian basement and Ubajara Group rocks, indicating a proximal source area (Costa et al. Reference Costa, França, Bacciegga, Habekos and Cruz1973, Reference Costa, França, Lins, Bacchiegga, Habekost and Cruz1979).
The Pacujá Formation is made up of coarse- to fine-grained, trough cross-bedded and rippled cross-laminated sandstones (reddish brown in colour) at the basin borders, while siltstone and shale occur at the centre of the basin (Gorayeb et al. Reference Gorayeb, Abreu, Correa and Moura1988; Quadros et al. Reference Quadros, Abreu and Gorayeb1994; Oliveira & Mohriak, Reference Oliveira and Mohriak2003). The Pacujá Formation is interpreted as deposited in fluvial systems that graded to deltas and lakes bounded by faults (Gorayeb et al. Reference Gorayeb, Abreu, Correa and Moura1988; Quadros et al. Reference Quadros, Abreu and Gorayeb1994). Recent geochronological studies on detrital zircon grains from reddish sandstones of the Pacujá Formation yielded U–Pb ages of 542–630 Ma (de Araújo et al. Reference de Araújo, Cordani, Basei, Castro, Sato and Sproesser2012 a) and 535.6 ± 8.5 Ma (Garcia et al. Reference Garcia, Parente, Silva Filho and Almeida2010).
The Parapuí Formation comprises a complex continental suite of bimodal igneous rocks (Oliveira & Mohriak, Reference Oliveira and Mohriak2003; Garcia et al. Reference Garcia, Parente, Silva Filho and Almeida2018), with the presence of basalt and basalt–andesitic subvolcanic and/or plutonic rocks (gabbro, microgabbro and diabase), dacite, rhyolite, tuff, breccia and peperite (Garcia et al. Reference Garcia, Parente, Silva Filho and Almeida2018). Recently, Garcia et al. (Reference Garcia, Parente, Silva Filho and Almeida2018) dated a rhyolite dyke that cross-cut the Aprazível Formation, yielding ages of 527–509 Ma.
The Aprazível Formation is the terminal sedimentary unit of the Jaibaras Basin (Costa et al. Reference Costa, França, Bacciegga, Habekos and Cruz1973; Quadros et al. Reference Quadros, Abreu and Gorayeb1994), encompassing clast-supported polymitic conglomerates and very coarse-grained sandstones, deposited in scarp-controlled alluvial fans during rifting (Oliveira & Mohriak, Reference Oliveira and Mohriak2003). Near the major faults that limit the Jaibaras Basin, massive, matrix- to clast-supported conglomerates dominate. Conglomerate with planar cross-stratification and associated pebbly sandstone, sandstone with horizontal lamination and mudstone with subaerial exposure features (i.e. mud cracks), are common in the central part of the basin (Cerri et al. Reference Cerri, Warren, Varejão, Marconato, Luvizotto and Assine2020). Clasts from the basement and from the underlying units are the most common constituents of the conglomerates from the Aprazível Formation (Costa et al. Reference Costa, França, Bacciegga, Habekos and Cruz1973; Oliveira, Reference Oliveira2001; Cerri et al. Reference Cerri, Warren, Varejão, Marconato, Luvizotto and Assine2020). The coarse-grained rocks from the Aprazível Formation differ from those of the Massapê Formation in terms of the presence of clasts from the Mucambo and Meruoca granites and from the Parapuí Formation (Oliveira & Mohriak, Reference Oliveira and Mohriak2003).
2.b. Parnaíba Basin: sedimentary archive of the sag phase
The Parnaíba Basin covers an area of approximately 670 000 km2 in the north and NE regions of Brazil, comprising a sedimentary succession with a maximum thickness of 3.5 km (Vaz et al. Reference Vaz, Rezende, Wanderley Filho and Travassos2007). Interpreted as a classic intracratonic (sag) basin, the Parnaíba Basin rests unconformably on the Precambrian basement characterized by Neoproterozoic structural arches and metamorphic mobile belts formed during the Brasiliano/Pan-African orogenic cycle (Tribaldos & White, Reference Tribaldos and White2018). The basin is limited to the ESE by the Rio Preto and Riacho do Pontal belts (orogenic areas related to the Brasiliano Cycle; Fig. 3), to the west and south by the Brasilia and Araguaia fold belts, and to the north by the Gurupi Belt and the São Luis Craton (Almeida et al. Reference Almeida, Brito Neves and Carneiro2000; Tribaldos & White, Reference Tribaldos and White2018).
The Parnaíba Basin (Fig. 4) is divided into five tectonostratigraphic (TS) units (Tozer et al. Reference Tozer, Watts and Daly2017), encompassing: (i) the pre-sag, Jaibaras and Riachão sequences (TS1 and TS2; of Ediacaran–Cambrian age); (ii) the basinal sag, Parnaíba Sequence (TS3; of Silurian–Triassic age); (iii) the central sag, Mearin Sequence (TS4; of Late Triassic – Early Cretaceous age); and (iv) the opening of Equatorial Atlantic Margin, Grajaú Sequence (TS5; of Late Cretaceous age).
The early stage of deposition in the Parnaíba Basin developed in response to isostatic adjustments and lithospheric cooling after the assembly of Gondwana (Castro et al. Reference Castro, Fuck, Phillips, Vidotti, Bezerra and Dantas2014). This suggests that subsidence effectively started after the end of the Brasiliano/Pan-African orogenic cycle (Daly et al. Reference Daly, Fuck, Julià, Macdonald, Watts, Daly, Fuck, Julià, Macdonald and Watts2018). It is important to note that several small grabens, including the Jaibaras and Cococi basins, occur underneath the Parnaíba Basin, composing a complex and understudied NE–SW rift system. Because of this characteristic, several authors interpreted these structures as the obvious precursors of the post-Brasiliano/Pan-African subsidence that accompanied the formation of the Parnaíba Basin (Castro et al. Reference Castro, Bezerra, Fuck and Vidotti2016; Tozer et al. Reference Tozer, Watts and Daly2017). The Riachão Basin (first pre-sag sequence, TS1), for example, is interpreted as an Ediacaran foreland basin located in the mid-western region of Parnaíba Basin (Porto et al. Reference Porto, Daly, La Terra and Fontes2018). Ediacaran–Cambrian (Ordovician?) NE–SW-elongated continental rifts, including the Jaibaras Basin, represent the second pre-sag tectonostratigraphic phase (TS2) (Oliveira & Mohriak, Reference Oliveira and Mohriak2003; Tozer et al. Reference Tozer, Watts and Daly2017), and are interpreted as failed rifts controlled by reactivations of normal and strike-slip faults related to the Transbrasiliano Lineament evolution (Castro et al. Reference Castro, Bezerra, Fuck and Vidotti2016). The Transbrasiliano Lineament (continental-scale tectonic suture) transects all the South American Platform and part of northwestern Africa (where it is named the Kandi Lineament), and is considered the most important Precambrian tectonic structure within the Parnaíba Basin (Schobbenhaus et al. Reference Schobbenhaus, Campos, Derze and Asmus1984). The Transbrasiliano Lineament was continuously reactivated during the Phanerozoic Eon, especially during the Mesozoic and Cenozoic eras (Brito Neves & Fuck, Reference Brito Neves and Fuck2014; Tribaldos & White, Reference Tribaldos and White2018). Despite the clear alignment of the depocentres from the Serra Grande Group with the Transbrasiliano Lineament (Caputo & Lima, Reference Caputo and Lima1984; Tozer et al. Reference Tozer, Watts and Daly2017), recent studies demonstrate that the lowermost part of the Ipu Formation is composed of fault-scarp-related alluvial fan deposits, filling NE–SW-elongated Ediacaran–Cambrian graben-like structures (Assis et al. Reference Assis, Porto, Schmitt, Linol, Medeiros, Martins and Silva2019). According to this interpretation, the earliest sedimentation episode of the Parnaíba Basin was putatively influenced by post-Brasiliano/Pan-African tectonic reactivations following the assembly of Gondwana.
The Serra Grande Group is the lowermost unit of the Parnaíba Basin (Fig. 4), representative of the first sedimentary cycle at the end of the Brasiliano/Pan-African Orogeny during Cambrian–Ordovician time (Góes & Feijó, Reference Góes and Feijó1994). The Serra Grande Group comprises fluvial to marine deposits (Ipu, Tianguá and Jaicós formations) organized in a complete transgressive–regressive cycle (Caputo & Lima, Reference Caputo and Lima1984; Góes & Feijó, Reference Góes and Feijó1994). The lower part of the Ipu Formation is strongly influenced by mega-fault systems associated with thermal contraction that occurred after the end of the Brasiliano orogenic cycle (Góes & Feijó, Reference Góes and Feijó1994). There, conglomerates deposited in alluvial fans and fluvial systems present a consistent palaeocurrent direction towards the NW (Assis et al. Reference Assis, Porto, Schmitt, Linol, Medeiros, Martins and Silva2019; Cerri et al. Reference Cerri, Warren, Varejão, Marconato, Luvizotto and Assine2020). The lower conglomerates grade upwards to coarse-grained cross-stratified sandstones disposed in channelized beds, and are interpreted as deposited in a braided fluvial system (Assis et al. Reference Assis, Porto, Schmitt, Linol, Medeiros, Martins and Silva2019; Cerri et al. Reference Cerri, Warren, Varejão, Marconato, Luvizotto and Assine2020). Diamictites (tillites) are locally present in the upper part of the Ipu Formation, attesting a glacial influence for, at least, part of this unit (Caputo & Lima, Reference Caputo and Lima1984; Santos & Carvalho, Reference Santos and Carvalho2009; Assis et al. Reference Assis, Porto, Schmitt, Linol, Medeiros, Martins and Silva2019; Caputo & Santos, Reference Caputo and Santos2020). A regional and irregular erosive surface (i.e. disconformity) defines the boundary with the overlaying marine deposits of the Tianguá Formation (Assis et al. Reference Assis, Porto, Schmitt, Linol, Medeiros, Martins and Silva2019), and an erosional unconformity defines the boundary between Parnaíba and Jaibaras basins, as well as between Parnaíba Basin and the Precambrian basement (Vaz et al. Reference Vaz, Rezende, Wanderley Filho and Travassos2007).
3. Sampling and analytical procedures
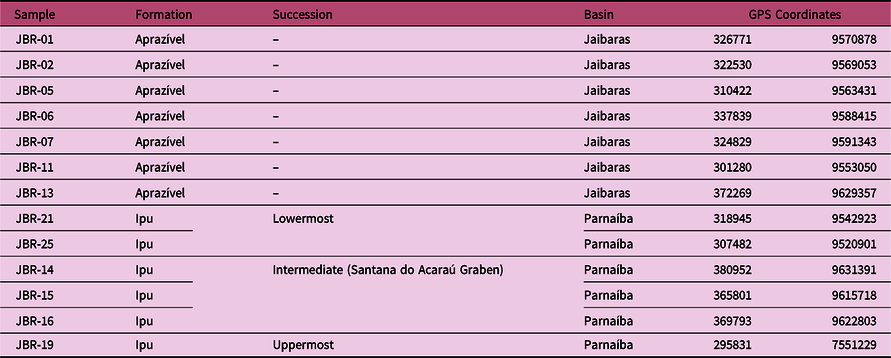
We have collected rock materials from seven locations within the Aprazível Formation (JBR-01, -02, -05, -06, -07, -11 and -13), and in six locations within the Ipu Formation (see Fig. 1 and Table 1 for sampling site location). Samples JBR-14, -15 and -16 correspond to the intermediate succession of the Ipu Formation and were collected in the Santana do Acaraú Graben (Fig. 1). Samples JBR-21 and -25 are representative of the lowermost succession and were collected near the contact with the Precambrian basement, and JBR-19 was collected from the uppermost succession of Ipu Formation, close to the contact with Tianguá Formation.
Aprazível and Ipu formations sampling site information. The GPS coordinates are in WGS84 datum.

The detrital zircon grains were separated from rock samples (5–7 kg) using standard techniques including crushing, sieving and separation by Frantz isodynamic magnetic separator and heavy liquid (bromoform). For heavy mineral separation, only detrital zircon grains smaller than 300 µm were considered. Zircon grains were handpicked under a binocular stereo microscope, mounted on adhesive tape and enclosed in epoxy resin mounts. These mounts were polished to about half their sizes and imaged by cathodoluminescence (using a JEOL 6510 electron microscope with a coupled cathodoluminescence detector), aiming to characterize internal features (recrystallization rings, fractures, inclusions) of the individual zircon grains. All samples were prepared at the sample preparation facilities from the Universidade Estadual Paulista (Unesp, Rio Claro, Brazil).
3.a. U–Pb geochronology
The U–Pb dating of detrital zircon grains was performed at the Isotope Geology Laboratory at Universidade Federal de Ouro Preto (UFOP, Ouro Preto, Brazil). Samples were analysed using a laser ablation microprobe (Photon-machines Excimer Laser 193) coupled with a sector field inductively coupled plasma mass spectrometry (LA-SF-ICP-MS; Element 2). The LA-SF-ICP-MS data were acquired with a spot size of 25 µm, a repetition rate of 5 Hz, laser output of 35%, shot count of 180 and a fluence of 2.65 J cm–2. To evaluate the accuracy and precision of the laser-ablation results (see reference material data in online Supplementary Materials A and B, available at http://journals.cambridge.org/geo), the primary, secondary and tertiary reference materials employed the BB-1 zircon (562.58 ± 0.26 Ma; Santos et al. Reference Santos, Lana, Scholz, Buick, Schmitz, Kamo, Gerdes, Corfu, Tapster, Lancaster, Storey, Basei, Tohver and Alkmim2017), GJ-1 zircon (608.5 ± 1.5 Ma; Jackson et al. Reference Jackson, Pearson, Griffin and Belousova2004) and Plešovice zircon (337 ± 1 Ma; Sláma et al. Reference Sláma, Košler, Condon, Crowley, Gerdes, Hanchar, Horswood, Morris, Nasdala, Norberg, Schaltegge, Schoene, Tubrett and Whitehouse2008), respectively. The raw data were corrected for background signal, and GJ-1 reference zircon were used to correct the laser-induced elemental fractionation and instrumental mass discrimination (Jackson et al. Reference Jackson, Pearson, Griffin and Belousova2004). Based on the Pb composition model of Stacey & Kramers (Reference Stacey and Kramers1975), the common Pb correction was applied. The data were corrected and reduced using the Glitter software (van Actherbergh et al. Reference van Actherbergh, Ryan, Jackson, Griffin and Sylvester2001), and the Isoplot-Ex were used for age calculation (Ludwig, Reference Ludwig2003). To better illustrate the results, all data were graphically represented using kernel density estimate plots (KDEs Java application, after Vermeesch, Reference Vermeesch2012) and pie charts. The R-package Provenance from Vermeesch et al. (Reference Vermeesch, Resentini and Garzanti2016) was also used to visualize the zircon age spectra through KDE plots and to perform a multi-sample comparison using multidimensional scaling (MDS). The maximum depositional ages (MDAs) were obtained by the Youngest Three Zircons method (see Zhang et al. Reference Zhang, Pease, Skogseid and Wohlgemuth-Ueberwasser2016; Ross et al. Reference Ross, Ludvigson, Möller, Gonzalez and Walker2017; Coutts et al. Reference Coutts, Matthews and Hubbard2019; for review). Detrital zircon ages are reported as 207Pb/206Pb ages for grains older than 1.4 Ga (considering the correlated discordance of 206Pb/238U to 207Pb/206Pb), or 206Pb/238U ages for grains younger than 1.4 Ga (considering the correlated discordance of 206Pb/238U to 207Pb/235U) (de Araújo et al. Reference de Araújo, Cordani, Basei, Castro, Sato and Sproesser2012 a). To perform the initial analysis of the geochronological dataset we tried to apply three distinct discordance filters of 3%, 15% and 30%. Although Gehrels (Reference Gehrels2014) recommended 30% of discordance (or more) for provenance studies, we tested distinct filters in order to check the accuracy and reliability of our results. Using 15% or 30% of discordance, the number of grains available for analysis increased by approximately 8 grains (less than 10% of the total). However, these procedures incorporated some zircon grains with unlikely ages (e.g. 6–5 Ga), resulting in final ages clearly skewed by unreliable data. In other words, the use of a discordance filter of 3% proved to be adequate, because it did not interfere with (older detrital zircon grains were not filtered or excluded in this analysis) or bias our data and results.
4. Results
4.a. Aprazível Formation U–Pb zircon age analysis
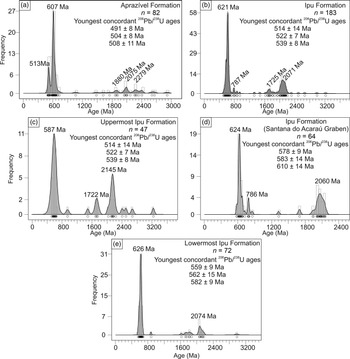
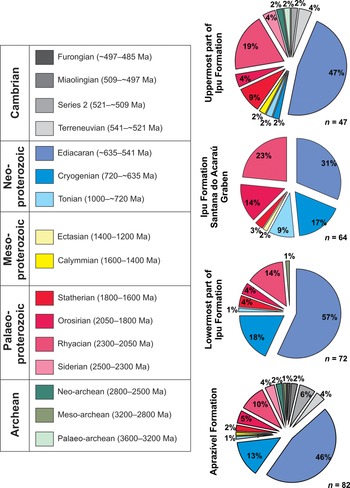
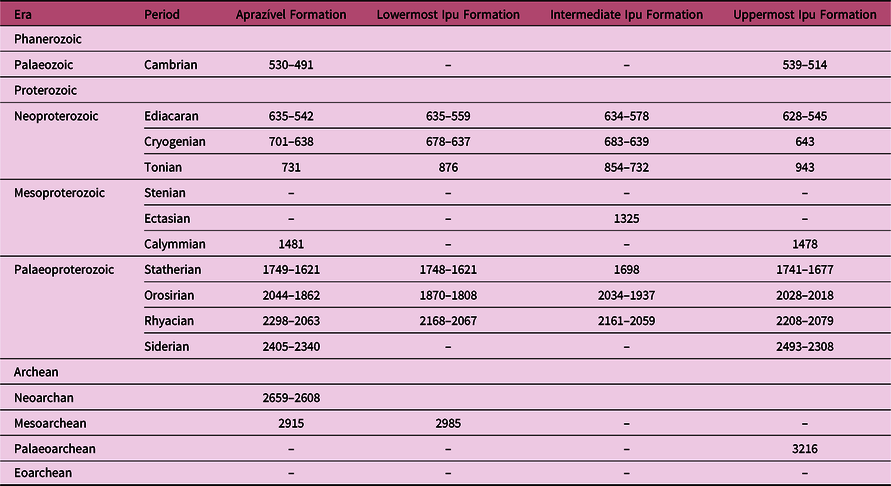
We analysed a total of 82 detrital zircon grains from conglomerates and conglomeratic sandstones from the Aprazível Formation (online Supplementary Material A). The detailed distribution of detrital zircon ages can be seen in Figures 5a, 6 and 7 and Table 2. Considering all the data analysed from the Aprazível Formation (Figs 5a–7; Table 2) we note an important presence of Cambrian (13% of the total analysed grains) and Neoproterozoic (especially Ediacaran with 46% of the total analysed grains) source areas, with important peaks at 513 Ma and 607 Ma respectively, and minor peaks at 1880 Ma (Orosirian), 2075 Ma and 2279 Ma (Rhyacian).
Kernel density estimate plots (KDEs) for the analysed detrital zircons of the Aprazível and Ipu formations; n is the number of detrital zircons analysed. Histograms and KDEs were built using the Java density plotter application (Vermeesch, Reference Vermeesch2012). (a) All the data analysed for (a) Aprazível Formation and (b) Ipu Formation. (c–e) The lowermost, intermediate and uppermost successions from the Ipu Formation.

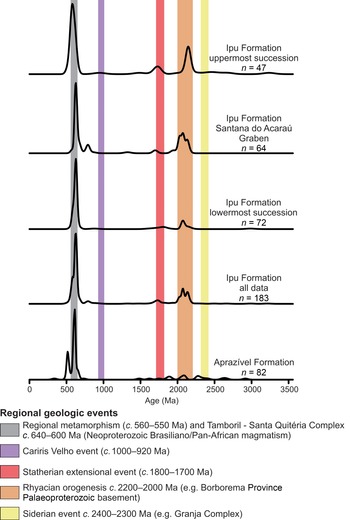
Kernel density estimate plots (KDEs) comparing ages of detrital zircons from Aprazível and Ipu formations. The coloured bars represent the main regional geological events (de Araújo et al. Reference de Araújo, Cordani, Basei, Castro, Sato and Sproesser2012 a).

Pie charts showing the percentage distribution of detrital zircon age populations for Aprazível and Ipu formations; n is the number of detrital zircon grains analysed. Ages according to the International Chronostratigraphic Chart 2019/05.

Main detrital zircon ages distribution throughout the Aprazível and Ipu formations. The ages displayed in the table (in Ma) correspond to the age interval obtained from detrital zircon U–Pb dating.

The youngest detrital zircon grain yielded an age of 491 ± 8 Ma (99% concordant) (Furongian). The second youngest detrital zircon grain found in the Aprazível Formation yielded an age of 504 ± 8 Ma (99% concordant) (Miaolingian), and the third youngest detrital zircon yielded an age of 508 ± 11 Ma (100% concordant) (Miaolingian).
4.b. Ipu Formation U–Pb zircon age analysis
A total of 183 detrital zircon grains (Fig. 5b) from conglomerates, conglomeratic sandstones and coarse-grained sandstones from the Ipu Formation were analysed (online Supplementary Material B). Aiming to detail the detrital zircon age populations throughout the Ipu Formation, we stratigraphically analysed the ages (Figs 5–7; Table 2) in order to represent the lowermost (near the contact with Precambrian basement), intermediate (Santana do Acaraú Graben) and uppermost (near the contact with the superimposed Tianguá Formation) successions of the unit. A detailed age distribution of the detrital zircons, together with the percentage of each age, can be seen in Figure 7 and Table 2. Considering all the analysed data from the Ipu Formation (Fig. 5b), there is a clear predominance of Neoproterozoic detrital zircon grains with an important peak at 621 Ma, and minor peaks at 1725 Ma (Statherian) and 2071 Ma (Rhyacian).
For the lowermost succession of the Ipu Formation, Neoproterozoic (Ediacaran, Cryogenian and Tonian) and Palaeoproterozoic (Statherian, Orosirian and Rhyacian) detrital zircon grains and a single Mesoarchean detrital zircon grain can be identified in the age analysis (Figs 5e, 6, 7; Table 2). The three youngest detrital zircon grains found in sandstones and conglomerates from the lowermost succession of the Ipu Formation yielded ages of 559 ± 8 Ma (98% concordant) (Ediacaran, Neoproterozoic), 562 ± 15 Ma (100% concordant) (Ediacaran, Neoproterozoic) and 582 ± 9 Ma (99% concordant) (Ediacaran, Neoproterozoic).
The intermediate succession of the Ipu Formation is very well exposed in the Santana do Acaraú Graben and corresponds to the thickest section of the unit, stratigraphically positioned above the alluvial fan facies deposits from the lower succession and below the fine-grained deltaic deposits from the uppermost succession (see Figs 1, 2). For this part of the Ipu Formation, the detrital zircon age populations comprise Neoproterozoic (Ediacaran, Cryogenian and Tonian) and Palaeoproterozoic (Statherian, Orosirian and Rhyacian) grains and a single Mesoproterozoic grain (Ectasian) (Figs 5d, 6, 7; Table 2). In this intermediate portion, Palaeoproterozoic ages are more abundant in comparison with lowermost and uppermost successions of the Ipu Formation. The three youngest detrital zircon grains from Santana do Acaraú Graben yielded ages of 578 ± 9 Ma (100% concordant) (Ediacaran, Neoproterozoic), 583 ± 14 Ma (99% concordant) (Ediacaran, Neoproterozoic) and 610 ± 14 Ma (99% concordant) (Ediacaran, Neoproterozoic).
The uppermost succession of the Ipu Formation is the only stratigraphic interval that contains Cambrian detrital zircon grains (Figs 5c, 6, 7; Table 2). The vast majority of detrital zircon grains from the uppermost succession yielded a Neoproterozoic age, in particular, Ediacaran. An important characteristic of this group is the lack of Neoproterozoic zircon grains older than 628 Ma (Figs 5c, 7; Table 2). In all the samples, only two grains presented ages older than 628 Ma: Cryogenian and Tonian (Figs 5c, 6, 7; Table 2). One single Mesoproterozoic detrital zircon grain was identified and revealed a Calymmian age (Figs 5c, 6, 7; Table 2), while the Palaeoproterozoic detrital zircon grains show ages ranging over Statherian, Orosirian, Rhyacian and Siderian (Figs 5c, 6, 7; Table 2). Two Archean zircon grains were identified in the samples, and yielded a Neoarchean and Palaeoarchean age (Figs 5c, 6, 7; Table 2). The youngest zircon grain yielded an age of 514 ± 14 Ma (100% concordant) (Cambrian Series 2), while the second and third youngest zircons found in the same sample yielded ages of 522 ± 7 Ma (99% concordant) (Terreneuvian) and 539 ± 8 Ma (99% concordant) (Terreneuvian), respectively.
5. Discussion
5.a. Rift basin provenance: source areas for Aprazível Formation
The sedimentary succession of the Aprazível Formation mainly comprises alluvial fan deposits that evolved associated with the border faults that limit the Jaibaras Basin. The most probable sources for detrital zircons are therefore located at the proximal areas, and correspond to: (i) the Médio Coreaú Domain and Ceará Central Domain Palaeoproterozoic terrains; (ii) post-collisional granitic intrusions; and (iii) older units of the Jaibaras Basin. As previously pointed out by Quadros et al. (Reference Quadros, Abreu and Gorayeb1994) and Oliveira (Reference Oliveira2001), the source areas located within the Jaibaras Basin clearly indicate that the recycling of sediment within the basin (basin autophagy) was an important process in the sedimentary filling.
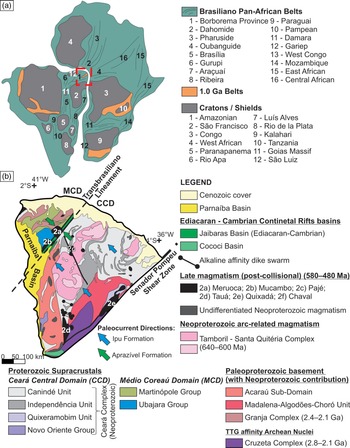
Considering this, the Cambrian detrital zircon grains (of age 530–491 Ma) were probably sourced from the erosion of older units from the Jaibaras Basin and surroundings, such as: (i) the bimodal volcanic rocks from the Parapuí Formation (537 ± 8 Ma; Garcia et al. Reference Garcia, Parente, Silva Filho and Almeida2018); (ii) the rhyolite dykes (527–509 Ma) that intrude the Aprazível Formation (Garcia et al. Reference Garcia, Parente, Silva Filho and Almeida2018); and (iii) the post-collisional intrusions of the Mucambo (532 ± 7 Ma; Santos et al. Reference Santos, Fetter, Hackspacher, Van Schums and Nogueira Neto2008 a) and Meruoca granites (542–514 Ma; Archanjo et al. Reference Archanjo, Launeau, Hollanda, Macedo and Liu2009; Santos et al. Reference Santos, Oliveira, Parente, Garcia and Dantas2013). Alternatively, the Coreaú-Aroeiras dyke swarm that cross-cuts the Ubajara Group (see Fig. 1), with U–Pb ages ranging from 524 ± 9 to 499 ± 28 Ma (Garcia et al. Reference Garcia, Parente, Silva Filho and Almeida2018), and anorogenic granites in the Ceará Central Domain with ages of 500–460 Ma, could also have been potential Cambrian sources (de Araújo et al. Reference de Araújo, Weinberg and Cordani2013).
Neoproterozoic detrital zircon grains from the Aprazível Formation within the interval of 622–542 Ma are derived from the 640–590 Ma Tamboril–Santa Quitéria granitic–migmatitic Complex (e.g. de Araújo et al. Reference de Araújo, Costa, Pinéo, Cavalcante and Moura2012 b), and secondarily sourced from the 550–520 Ma Canindé Unit, Ceará Complex (Fetter, Reference Fetter1999; Figs 3, 6, 8, 9a). The Neoproterozoic zircon grains could also have been derived from the Neoproterozoic Ubajara Group (Fetter et al. Reference Fetter, Santos, Van Schmus, Hackspacher, Brito Neves, Arthaud and Wernick2003), the Canindé Unit or the Independência Unit, which have zircon grains with metamorphic overgrowth ranging over 578–540 Ma (de Araújo et al. Reference de Araújo, Cordani, Basei, Castro, Sato and Sproesser2012 a; Figs 3, 8, 9a).
Tectonic elements and geological units of the study area in the context of the South America continent. (a) Location of the principal cratons/shields and the Brasiliano Pan-African belts; (b) simplified geological map of Borborema Province with the preferential source areas for Aprazível and Ipu formations indicated by arrows. Modified from de Araújo et al. (Reference de Araújo, Pinéo, Caby, Costa, Cavalcante, Vasconcelos and Rodrigues2010, Reference de Araújo, Cordani, Basei, Castro, Sato and Sproesser2012 a, b) and Cordani et al. (Reference Cordani, Ramos, Fraga, Cegarra, Delgado, Souza and Schobbenhaus2016).

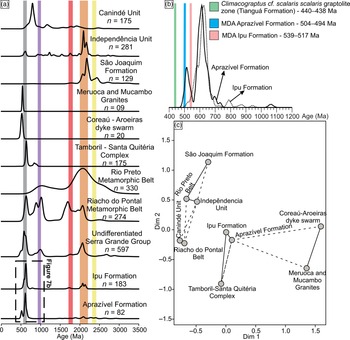
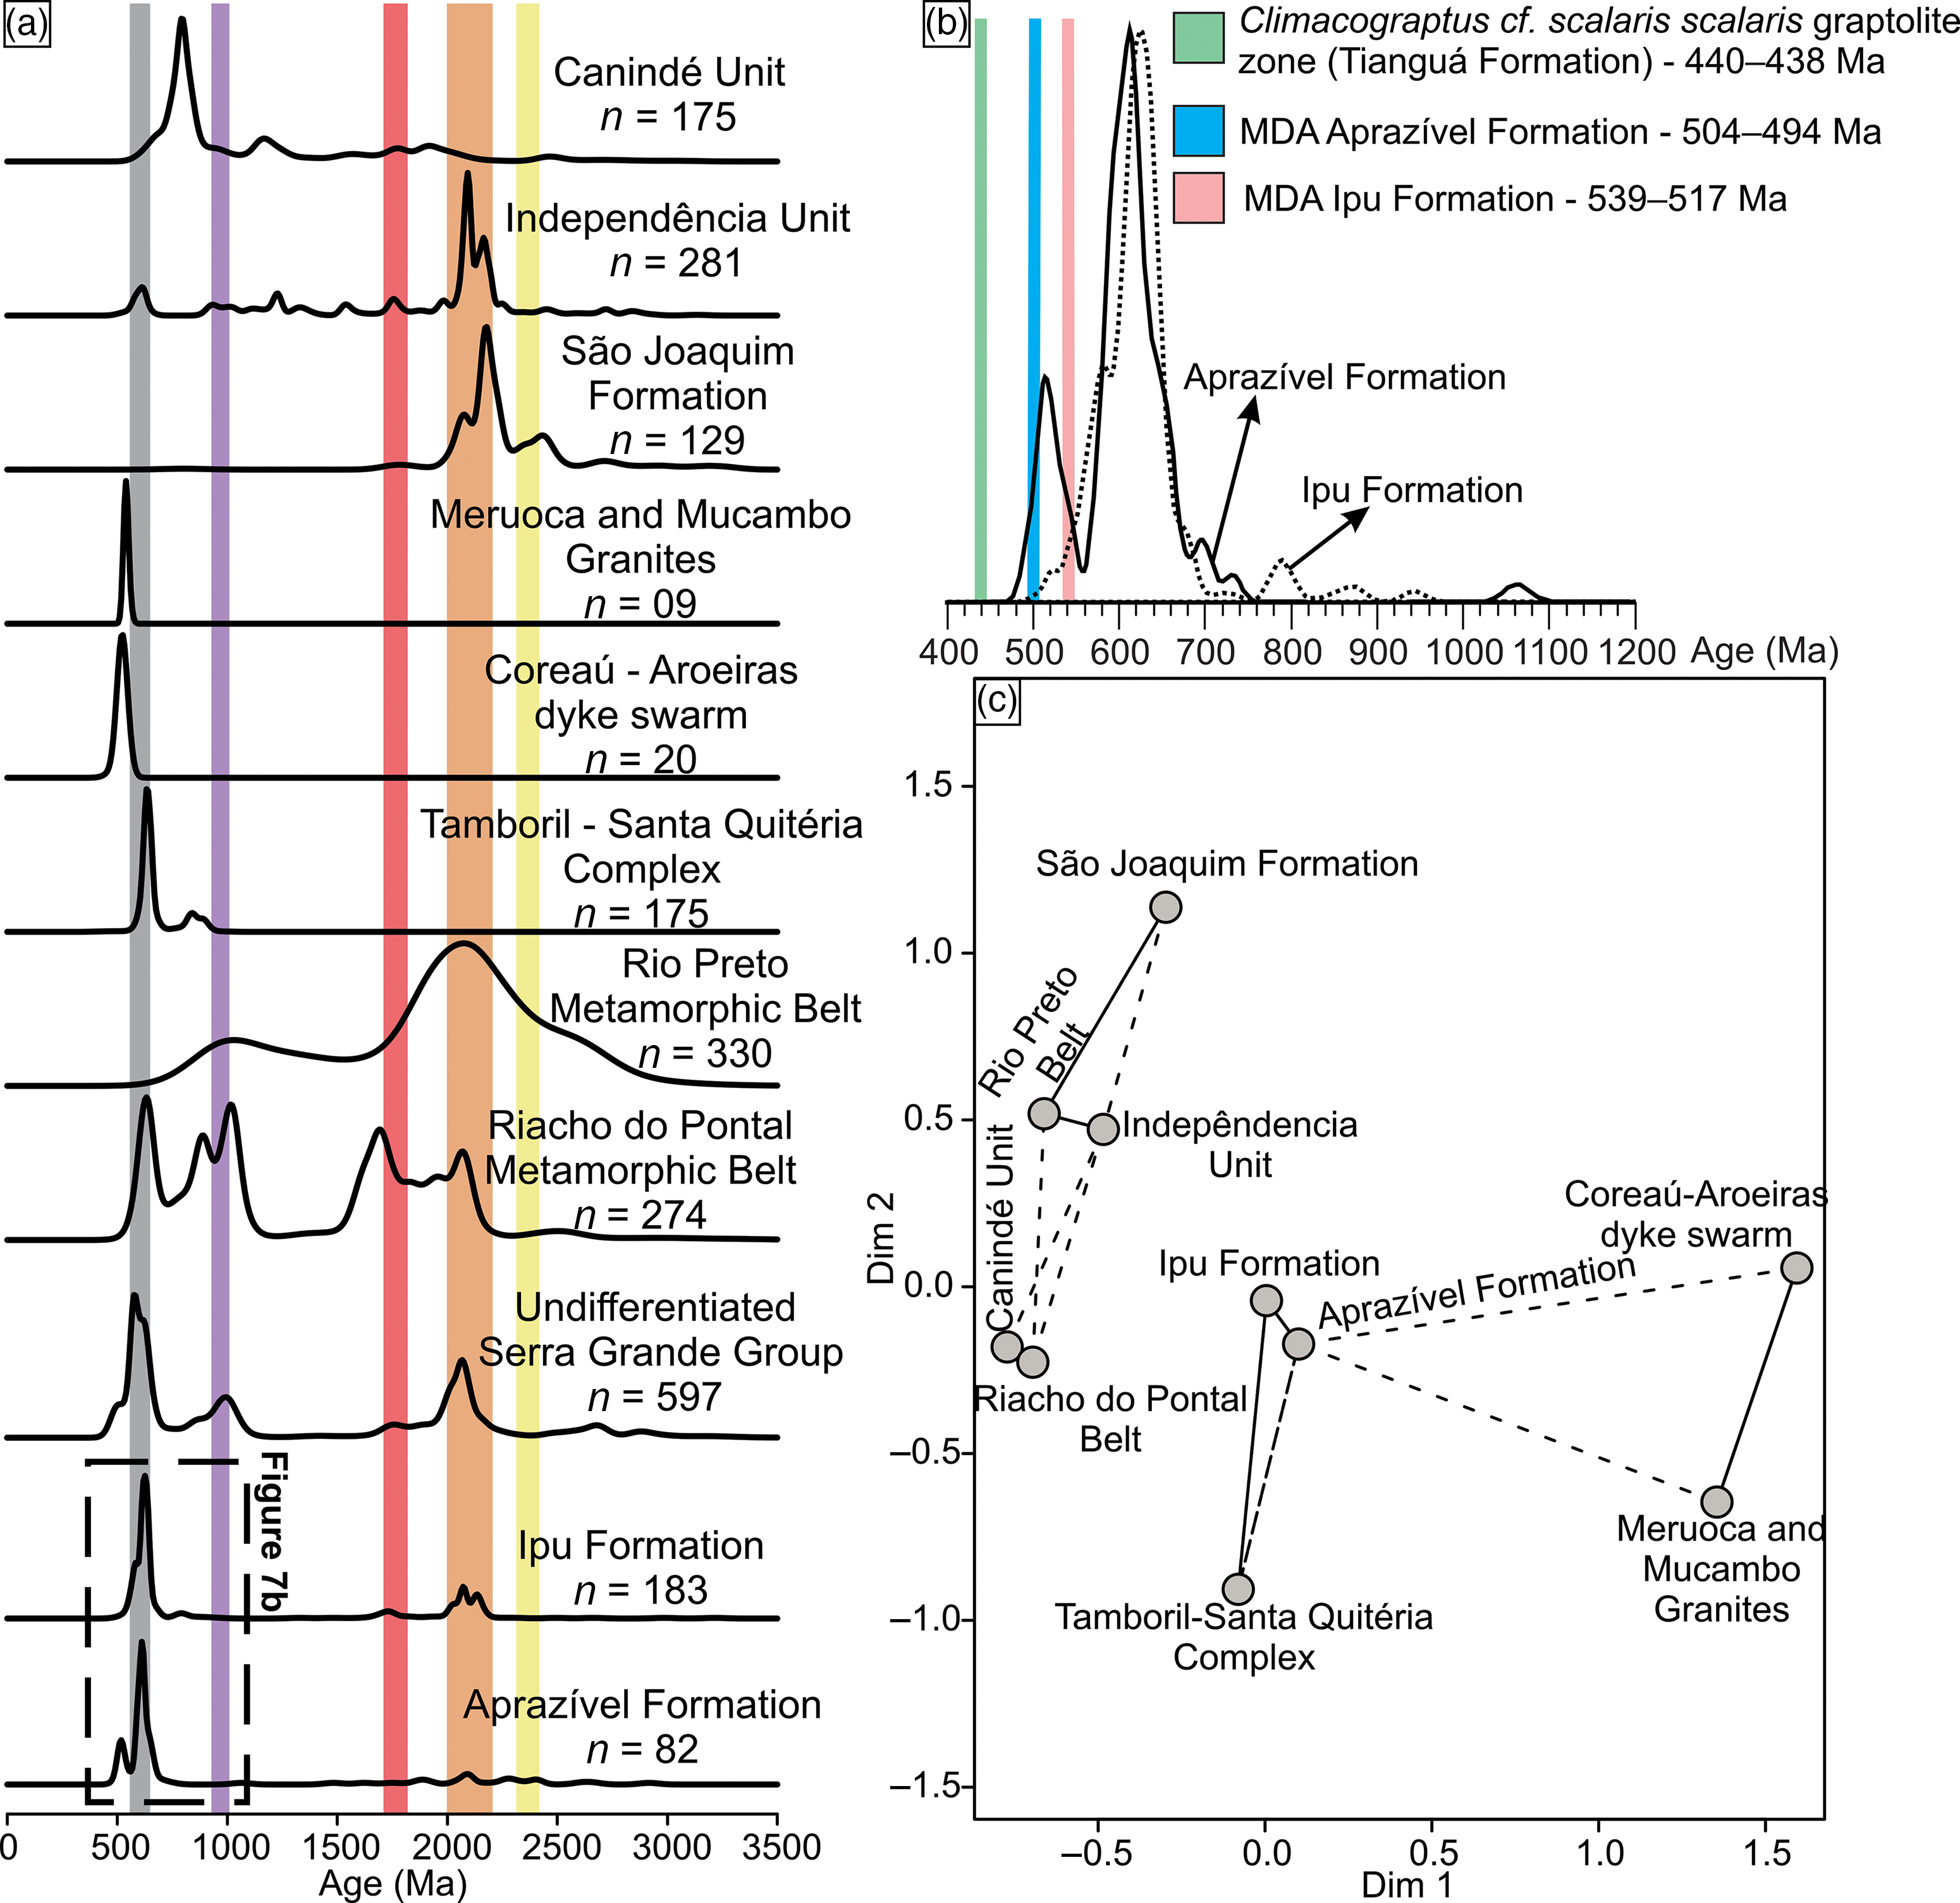
(a) Kernel density estimate plots (KDE) of Aprazível and Ipu formations (this work), undifferentiated Serra Grande Group (Hollanda et al. Reference Hollanda, Góes and Negri2018), Riacho do Pontal Metamorphic Belt (Caxito et al. Reference Caxito, Uhlein, Dantas, Stevenson, Salgado, Dussin and Nóbrega2016), Rio Preto Metamorphic Belt (Caxito et al. Reference Caxito, Dantas, Stevenson and Uhlein2014), Tamboril–Santa Quitéria Complex (Costa et al. Reference Costa, Araújo, Amaral, Vasconcelos and Rodrigues2013; de Araújo et al. Reference de Araújo, Cordani, Weinberg, Basei, Armstrong and Sato2014), Coreaú–Aroeiras dyke swarm (Garcia et al. Reference Garcia, Parente, Silva Filho and Almeida2018), Meruoca and Mucambo Granites (Fetter, Reference Fetter1999; Brito Neves et al. Reference Brito Neves, Passarelli, Basei and Santos2003; Garcia et al. Reference Garcia, Parente, Silva Filho and Almeida2018), and Canindé Unit, Indepêndencia Unit and São Joaquim Formation (de Araújo et al. Reference de Araújo, Cordani, Basei, Castro, Sato and Sproesser2012 a). Coloured bars indicate the main geological events and zircon age peaks (see Fig. 6 for legend). (b) KDE plots of Aprazível and Ipu formations (1200–400 Ma) with the calculated maximum depositional ages (MDA) and the Tianguá Formation palynological age (Grahn et al. Reference Grahn, Melo and Steemans2005). (c) Multidimensional scaling (MDS) diagrams using the aforementioned data. Note that even with the MDS indicating little or no resemblance, the zircon age spectra of the source areas fit perfectly with Ipu and Aprazível formations.
The scarce presence of Mesoproterozoic detrital zircon grains (only three grains in all analysed samples) and the near absence of terrains with this age in the surrounding basement make it difficult to define a probable source area for these grains. Similarly, the localized and punctual occurrence of Archean crust in the Borborema Province present in the southern part of Ceará Central Domain (Fig. 8) also precludes the definition of an obvious source area for sediments with this age.
Palaeoproterozoic igneous and metamorphic units are widely distributed in all domains within Borborema Province, with Siderian units preferentially distributed in the Médio Coreaú Domain basement, with subordinated occurrence in the Ceará Central Domain (Santos et al. Reference Santos, Fetter, Nogueira Neto, Pankhurst, Trouw, Brito Neves and Wit2008 b; de Araújo et al. Reference de Araújo, Cordani, Basei, Castro, Sato and Sproesser2012 a). The dated Palaeoproterozoic detrital zircon grains (2405–1621 Ma) were probably sourced from several units from the regional basement of the Borborema Province (e.g. 2.35–2.1 Ga Granja Complex, São Joaquim Formation, Independência and Canindé units; Figs 3, 6, 8, 9a).
When all detrital zircon ages are considered, the source areas of the Aprazível Formation are represented mostly by: (i) Cambrian rocks (e.g. bimodal volcanic rocks from Jaibaras Basin, and Meruoca and Mucambo post-collisional granitic plutons); (ii) Neoproterozoic basement related to regional metamorphism (c. 560–550 Ma); (iii) Tamboril–Santa Quitéria Complex (c. 640–590 Ma) related to the Neoproterozoic Brasiliano/Pan-African magmatism (Figs 6, 9a); and (iv) Palaeoproterozoic Borborema Province basement, associated with Statherian extensional events (c. 1800–1700 Ma), Rhyacian orogenesis (c. 2200–2000 Ma) and Siderian terrains (c. 2400–2300 Ma; Granja Complex) (Figs 6, 9a). The multidimensional scaling (MDS) (Fig. 9c) analysis show that Aprazível Formation has little resemblance to the above-mentioned basement units. This probably reflects the massive dominance of Palaeoproterozoic zircons in the source area: the Aprazível Formation has Palaeoproterozoic zircons but they are less dominant when compared with the basement unit that sourced this formation. In this way, the zircon age peaks (see Fig. 9a) reveal that the source of the Neoproterozoic zircons can be easily tracked, as well as the Palaeoproterozoic and Cambrian zircon sources.
5.b. Intracratonic basin provenance: source areas for the Ipu Formation
The age distribution for the Ipu Formation reveals an important Neoproterozoic contribution and secondary influence from Palaeoproterozoic (Statherian) rocks, suggesting source areas within the Borborema Province related to the Neoproterozoic Brasiliano/Pan-African orogeny (Figs 3, 6). Palaeocurrent data in the fluvial cross-strata of the Ipu Formation indicate a consistent direction of sediment transport towards the NW (Assis et al. Reference Assis, Porto, Schmitt, Linol, Medeiros, Martins and Silva2019; Cerri et al. Reference Cerri, Warren, Varejão, Marconato, Luvizotto and Assine2020), and consequently source areas located at the Ceará Central Domain of the Borborema Province and the Brasiliano mobile belts located to the south and SE. These observations are reinforced by the monomictic composition, size, roundness and sphericity of clasts larger than 2 mm (granules), indicating prolonged sedimentary transport (Cerri et al. Reference Cerri, Warren, Varejão, Marconato, Luvizotto and Assine2020). The conglomerates and very coarse- to coarse-grained sandstones from the lowermost succession of Ipu Formation, are almost exclusively formed of quartz vein clasts, indicating a substantial change in the sediment composition (and consequently of source area) in comparison with the Aprazível Formation (Cerri et al. Reference Cerri, Warren, Varejão, Marconato, Luvizotto and Assine2020). The sediment dispersion directions (Assis et al. Reference Assis, Porto, Schmitt, Linol, Medeiros, Martins and Silva2019; Cerri et al. Reference Cerri, Warren, Varejão, Marconato, Luvizotto and Assine2020) also support the hypothesis of distinct source areas for units (Cerri et al. Reference Cerri, Warren, Varejão, Marconato, Luvizotto and Assine2020). The macro provenance analysis performed by Cerri et al. (Reference Cerri, Warren, Varejão, Marconato, Luvizotto and Assine2020) therefore strongly indicates differences in the sedimentation style and source areas between the end of the rift (Aprazível Formation) and the beginning of the intracratonic basin (Ipu Formation). These changes show that a period of rearrangement of the source areas and erosion/non-deposition occurred between the Aprazível and Ipu formations, and that the intracratonic basins probably did not evolve from the rift basin.
Excluding the uppermost succession of the Ipu Formation, the lowermost and intermediate successions of this unit do not contain Cambrian zircon grains (Fig. 7; Table 2). The probable sources for the only three Cambrian grains dated in the uppermost succession (539–514 Ma) could be related to alkaline and anorogenic granites (c. 500–460 Ma) from the Borborema Province (Fig. 8, Archanjo et al. Reference Archanjo, Launeau, Hollanda, Macedo and Liu2009; de Araújo et al. Reference de Araújo, Weinberg and Cordani2013; Hollanda et al. Reference Hollanda, Góes and Negri2018).
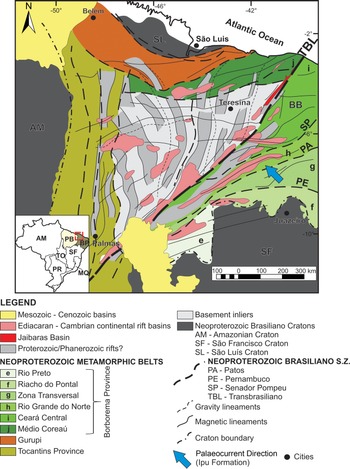
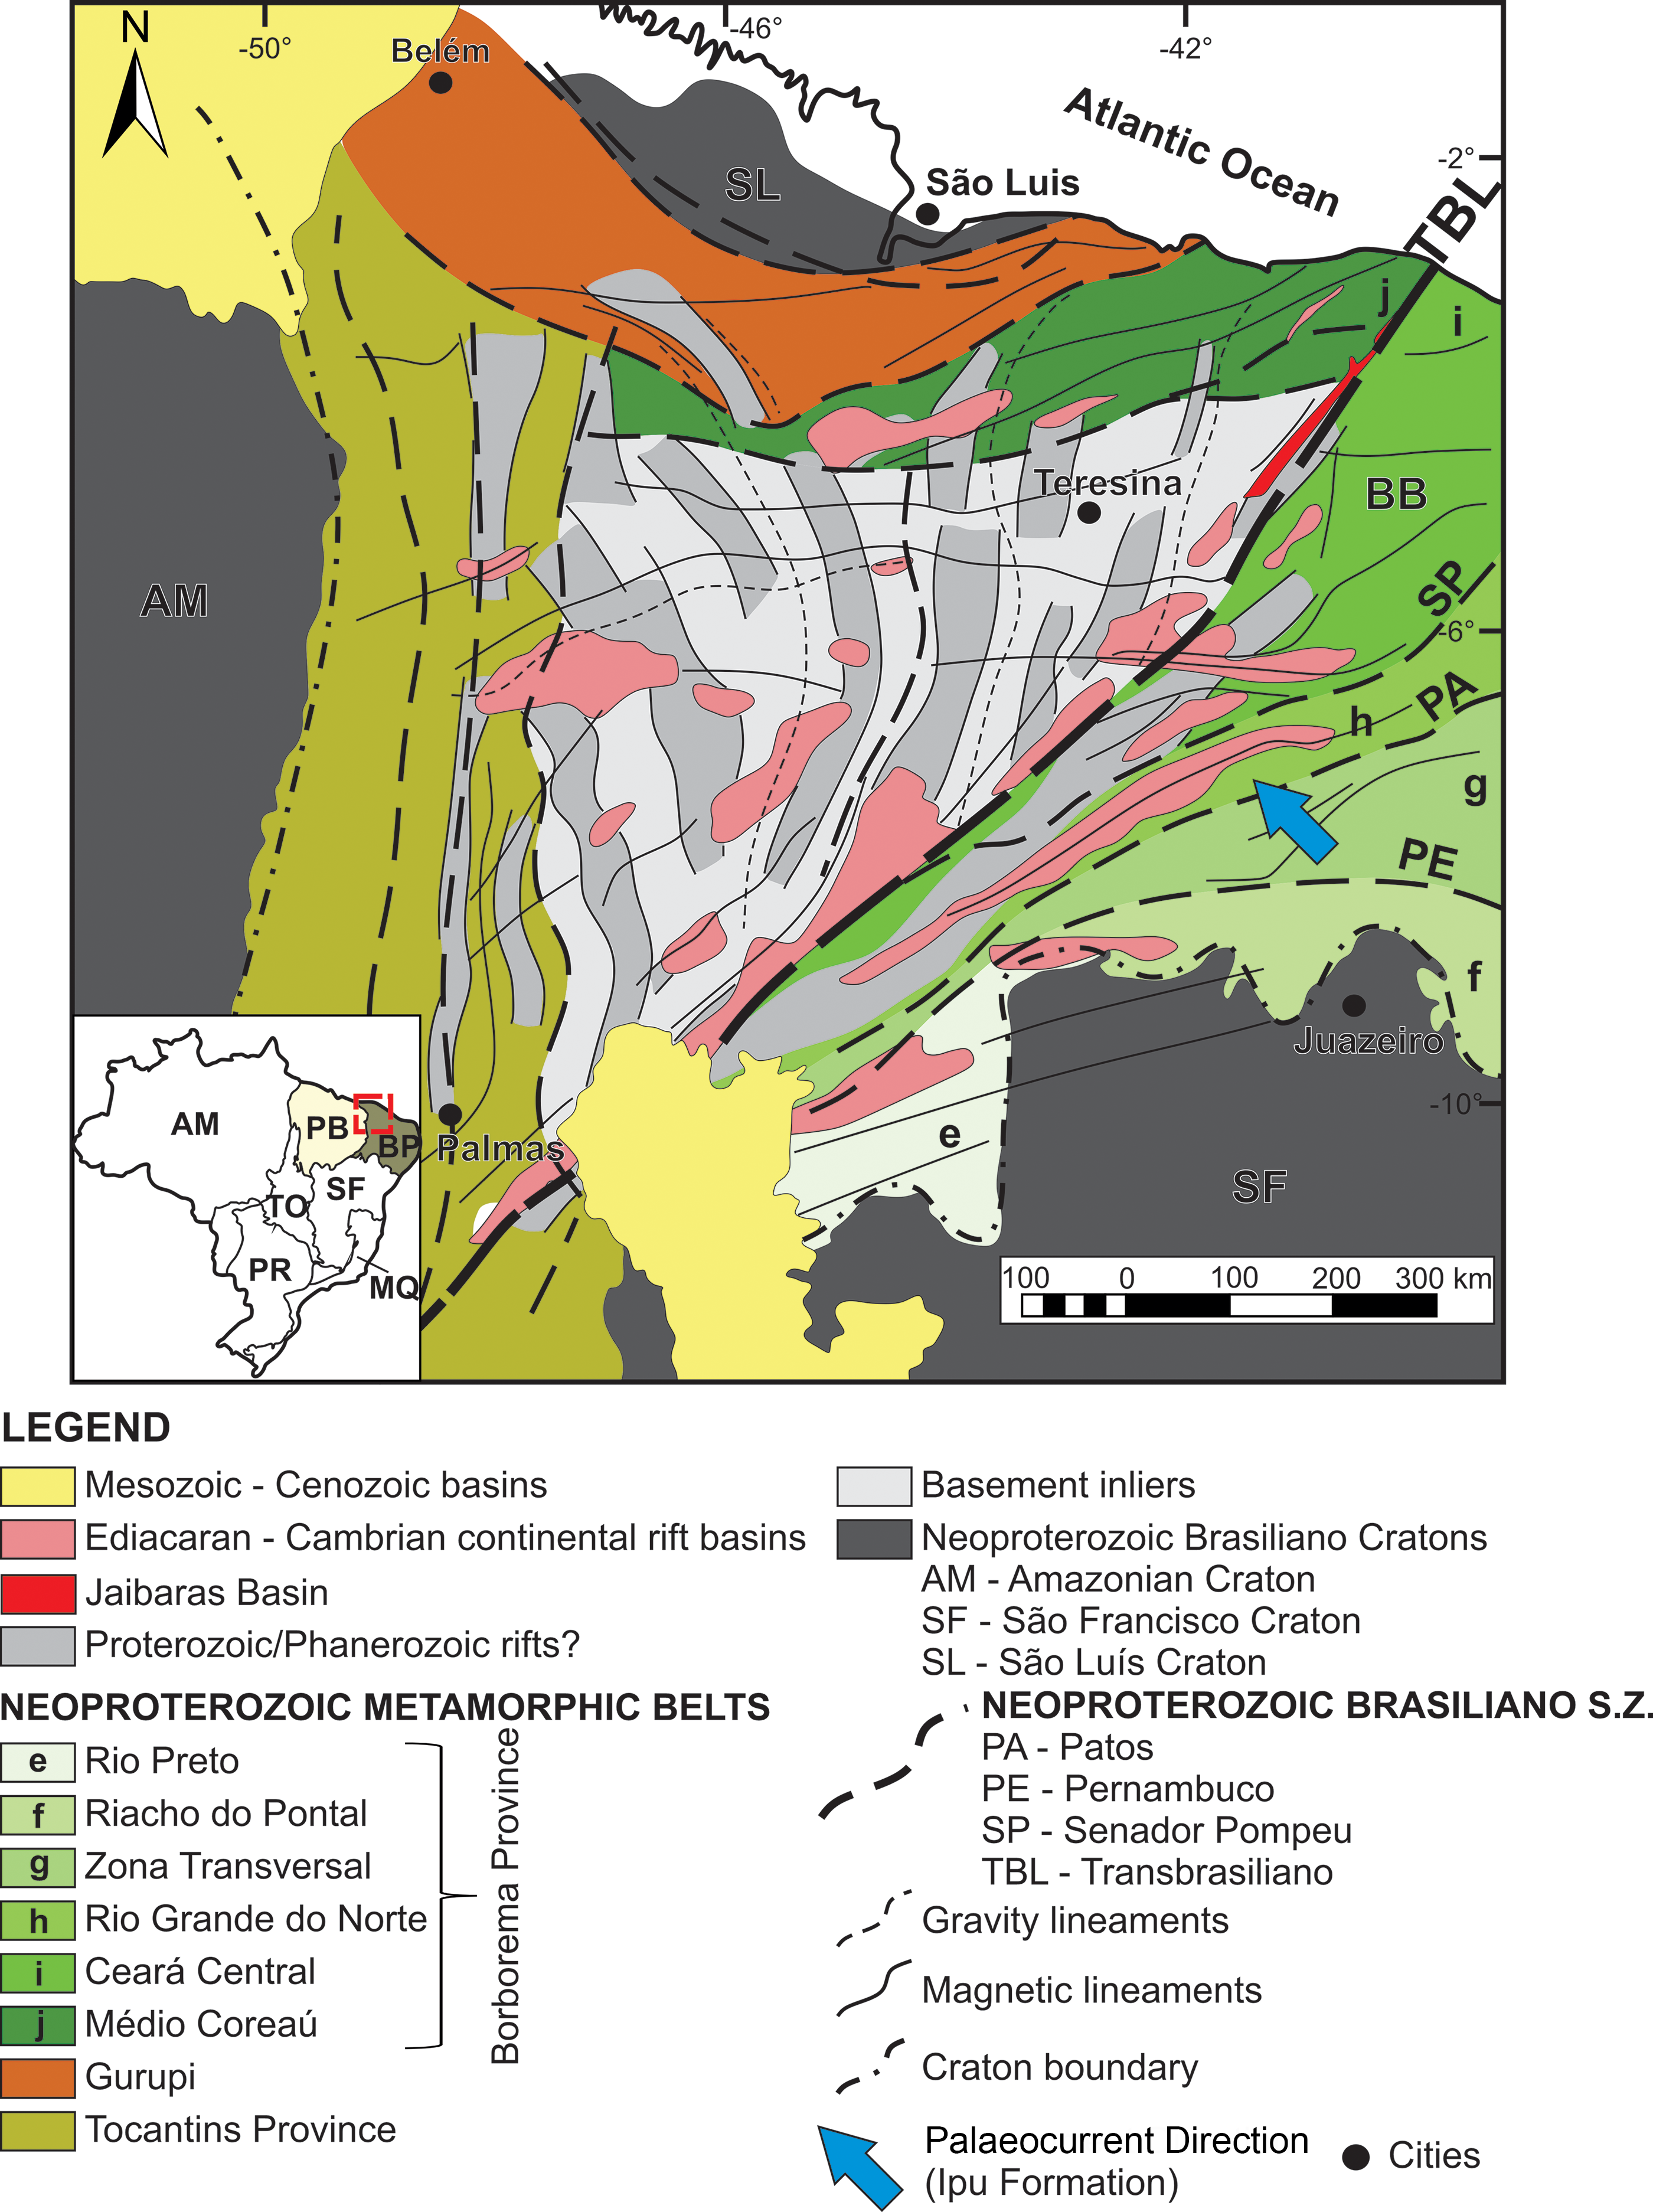
Neoproterozoic zircon grains are the major components in all analysed samples from the Ipu Formation, especially those with an Ediacaran age (635–545 Ma) (Figs 7, 9a; Table 2). For the lowermost and intermediate successions, Cryogenian grains (683–637 Ma) are the second most abundant population. For the uppermost Ipu Formation, virtually all the dated Neoproterozoic detrital zircon grains are Ediacaran in age (628–545 Ma). However, despite the abundance of Neoproterozoic zircon grains, rocks of this age are not common in the metasedimentary units from the Borborema Province. This effect is probably related to sources that preceded the main peak of the collisional Brasiliano magmatism during 620–540 Ma (Hollanda et al. Reference Hollanda, Góes and Negri2018). However, during this time interval, the emplacement of syn- to post-collisional magmatic bodies was particularly common, probably generating high areas subjected to erosion and subsequent transport in the Borborema Province (e.g. syn-collisional Tamboril–Santa Quitéria Complex, c. 640–590 Ma, and post-collisional Quixadá–Quixeramobim granitoids, c. 590–560 Ma; Fetter, Reference Fetter1999; Figs 3, 8). In the southeastern part of Parnaíba Basin and northern limit of the São Francisco Craton (Fig. 3), Neoproterozoic (630–530 Ma; Caxito et al. Reference Caxito, Uhlein, Dantas, Stevenson, Egydio-Silv, Salgado, Heilbron, Cordani and Alkmim2017) metamorphic belts related to the Brasiliano Orogeny – for example, the Rio Preto Canabravinha Formation (c. 820–630 Ma; Caxito et al. Reference Caxito, Uhlein, Dantas, Stevenson, Egydio-Silv, Salgado, Heilbron, Cordani and Alkmim2017), and Riacho do Pontal Mandacaru Formation (c. 630–530 Ma) and Serra da Aldeia/Caboclo Suite Barra Bonita Formation and Monte Orebe Complex (c. 820–630 Ma; Caxito et al. Reference Caxito, Uhlein, Dantas, Stevenson, Egydio-Silv, Salgado, Heilbron, Cordani and Alkmim2017) – can be considered the most probable sources for the Ipu Formation (Figs 3, 9a, 10).
Tectonic sketch of the Parnaíba Basin igneous and metamorphic basement. Modified from Castro et al. (Reference Castro, Fuck, Phillips, Vidotti, Bezerra and Dantas2014). TBL – Transbrasiliano Lineament; SZ – shear zones.
Palaeoproterozoic detrital zircon grains are mainly represented by Rhyacian grains (2168–2059 Ma) that prevail in the populations from the lower and uppermost successions of the Ipu Formation. In the Santana do Acaraú Graben (intermediate succession), a second Palaeoproterozoic zircon population with Orosirian ages of 2034–1936 Ma is recognized. Palaeoproterozoic detrital zircon populations were mainly derived from the Rhyacian orogenesis (c. 2200–2000 Ma), representing the Palaeoproterozoic basement of the Borborema Province (Figs 3, 6). The secondary peak of the Palaeoproterozoic zircon, found in the uppermost succession of the Ipu Formation, was probably sourced from the Statherian terrains formed during extensional events (c. 1800–1700 Ma), belonging to the Ceará Complex (Independência and Canindé units). It is noteworthy that the Borborema Province basement is composed predominantly of units older than c. 2.0 Ga (Caxito et al. Reference Caxito, Santos, Ganade, Bendaoud, Fettous and Bouyo2020). Considering the above-mentioned Brasiliano metamorphic belts, the Riacho do Pontal Belt could also provide zircon grains of Cryogenian – early Ediacaran (c. 820–630 Ma Barra Bonita Formation and Monte Orebe Complex), late Tonian – early Cryogenian (c. 900–820 Ma Paulistana, Brejo Seco and São Francisco de Assis complexes) and early Tonian (c. 1000–960 Ma Morro Branco and Santa Filomena complexes) ages (Figs 3, 9a), as well as of Archean–Palaeoproterozoic age (Morro do Estreito Complex) (Caxito et al. Reference Caxito, Uhlein, Dantas, Stevenson, Egydio-Silv, Salgado, Heilbron, Cordani and Alkmim2017, Reference Caxito, Santos, Ganade, Bendaoud, Fettous and Bouyo2020). The Rio Preto Belt could also provide Archean–Palaeoproterozoic grains (Formosa Formation and Cristalância do Piauí Complex) (Figs 3, 9a; Caxito et al. Reference Caxito, Uhlein, Dantas, Stevenson, Egydio-Silv, Salgado, Heilbron, Cordani and Alkmim2017, Reference Caxito, Santos, Ganade, Bendaoud, Fettous and Bouyo2020).
The lack of detrital zircon grains of age c. 1000–920 Ma in all the analysed samples from the Ipu and Aprazível formations reveals that the rocks related to the Cariris Velhos Orogenic Terrain (c. 1.0 Ga belts, Brito Neves et al. Reference Brito Neves, Van Schmus, Santos, Campos-Neto and Kozuch1995) (Figs 3, 6, 8a) were probably not exhumed during the deposition of these units, or that there was a physiographic barrier preventing the transport of sediments into the basin. Orthogneisses and supracrustals rocks from the Cariris Velhos can be found in the south portion of the Borborema Province, between the Patos and Pernambuco shear zones (Figs 3, 8a, 9a). The absence of detrital zircon grains from the Cariris Velhos rocks could indicate that the oldest sedimentary rocks in Parnaíba Basin were not sourced from units of the African continent. Considering the NW-directed fluvial palaeocurrents from the Ipu Formation and an African source area, the rocks of Cariris Velhos were not necessarily a sediment route for the fluvial system. Alternatively, the minor contributions of the Cariris Velhos grains could have been derived from the Riacho do Pontal metamorphic belt, from rocks that were not extensively exposed or available for erosion, for example, early Tonian (1000–960 Ma) Morro Branco and Santa Filomena complexes and the Afeição Suite (Caxito et al. Reference Caxito, Uhlein, Dantas, Stevenson, Egydio-Silv, Salgado, Heilbron, Cordani and Alkmim2017) (Figs 3, 9a).
The MDS analysis performed for the Ipu Formation and its probable source rocks shows some resemblance between this formation and the Tamboril–Santa Quitéria Complex (Fig. 9c), where the Neoproterozoic peaks are closely related. The non-relation between the Ipu Formation and the other source areas (e.g. Rio Preto and Riacho do Pontal metamorphic belts) may be due to the minor abundance and dominance of Palaeoproterozoic grains in the Ipu Formation. We also observe that the Palaeoproterozoic grains are highly dominant in the Indepêndencia Unit, Canindé Unit and in the São Joaquim Formation, despite the presence of Neoproterozoic grains in these units. Although the MDS did not show a clear link between sediment and source rocks, the Neoproterozoic and Palaeoproterozoic source areas can be traced through the KDEs (Fig. 9a): Neoproterozoic grains are mainly sourced from the Riacho do Pontal Belt and secondarily by Rio Preto Belt and Canindé Unit; and Palaeoproterozoic grains are present in the Riacho do Pontal and Rio Preto belts and also in the Indepêndencia Unit and São Joaquim Formation.
5.c. Maximum depositional ages of the Aprazível and Ipu formations
The boundary between the Jaibaras and Parnaíba basins corresponds to an erosional unconformity (Vaz et al. Reference Vaz, Rezende, Wanderley Filho and Travassos2007), but the time gap between the deposition of the upper and lower units of these basins is unknown. The presence of clasts from the Meruoca and Mucambo granites and intrusive volcanic rocks from Parapuí Formation (527–509 Ma) in the conglomerates from the Aprazível Formation provide unquestionable evidence that this unit is younger than of early Cambrian – Miaolingian age.
The Aprazível Formation presented an MDA of 504–494 Ma (c. 499 ± 5 Ma concordia age), corresponding to the middle Miaolingian – early Furongian (middle–late Cambrian) (Fig. 9b). Considering recently reported Ediacaran – early Cambrian U–Pb ages for the Pacujá Formation (below the Aprazível Formation; Garcia et al. Reference Garcia, Parente, Silva Filho and Almeida2010; de Araújo et al. Reference de Araújo, Cordani, Basei, Castro, Sato and Sproesser2012 a), our data seem to be reliable for the sedimentation of the last unit of the Jaibaras Basin. Because the Jaibaras Basin presents syn-depositional and syn-magmatic activity (input of detritus from uplifted near areas), the youngest detrital zircon record may provide an MDA close to the time of sediment accumulation (Dickinson & Gehrels, Reference Dickinson and Gehrels2009; Cawood et al. Reference Cawood, Hawkesworth and Dhuime2012). It is therefore plausible that the Aprazível Formation was deposited during sinistral strike-slip fault reactivation during middle–late Cambrian time, as previously interpreted by Oliveira & Mohriak (Reference Oliveira and Mohriak2003). Our data also suggest that the Aprazível Formation was mostly deposited during Cambrian (starting at Ediacaran and ending at Miaolingian–Furongian) time, without sedimentation during the Early Ordovician Epoch (as previous stated by Oliveira & Mohriak, Reference Oliveira and Mohriak2003).
Recent geochronological studies carried out in the entire (undifferentiated) Serra Grande Group, specifically, the basal part of the Parnaíba Basin (Hollanda et al. Reference Hollanda, Góes and Negri2018; Menzies et al. Reference Menzies, Carter and Macdonald2018), do not determine the precise MDA U–Pb ages of its individual units. In the model of Menzies et al. (Reference Menzies, Carter and Macdonald2018), the Serra Grande Group was deposited during late Silurian time (433.8–419.2 Ma); in the study of Hollanda et al. (Reference Hollanda, Góes and Negri2018) it was deposited during the Early Devonian Epoch (Pragian, 410–407 Ma). Notwithstanding, our data indicate that these depositional ages are valid only when considering the whole Serra Grande Group, but do not represent the real MDA for the first depositional episode of the Parnaíba Basin, represented by the Ipu Formation. Biochronological age constraints of the Serra Grande Group is given by palynomorphs and the presence of the Climacograptus cf. scalaris scalaris graptolite zone, in the Tianguá Formation (above Ipu Formation), which securely age this unit as Early Silurian (middle Llandovery; 440–438.5 Ma; Caputo & Lima, Reference Caputo and Lima1984; Grahn et al. Reference Grahn, Melo and Steemans2005). At the uppermost part of the Ipu Formation a tillite deposit related to the Hirnantian Glaciation (c. 443 Ma) is present, in direct contact with the overlying Tianguá Formation (Grahn et al. Reference Grahn, Melo and Steemans2005; Caputo & Santos, Reference Caputo and Santos2020). The sedimentation of the Ipu Formation is therefore older than of Early Silurian age, and possibly ended during the Late Ordovician Epoch (Hirnantian) (Caputo & Santos, Reference Caputo and Santos2020). Analysing the zircon age spectra of the undifferentiated Serra Grande Group (Hollanda et al. Reference Hollanda, Góes and Negri2018) (Fig. 9a), we observe that the data acquired from the Ipu Formation in this study (analysis restricted to the lower portion of the Serra Grande Group) are very similar and reliable if the age spectra are compared.
The U–Pb detrital zircon age data presented in this contribution indicate a MDA of 539–517 Ma (c. 528 ± 11 Ma concordia age) for the Ipu Formation, pointing to a deposition during early Cambrian time (Terreneuvian–Series 2) (Fig. 9b). However, the youngest zircon record in basins situated in intraplate setting (‘tectonically stable’ without or with little syn-depositional igneous activity) may provide an MDA tens or hundreds of million years older than the real time of the sediment accumulation (Cawood et al. Reference Cawood, Nemchin and Strachan2007, Reference Cawood, Hawkesworth and Dhuime2012). In this sense, the lack of any Cambrian grains younger than 514 Ma in the Ipu Formation do not necessarily attest that the Ipu Formation was deposited during early Cambrian time, but that the unit is no older than of Cambrian Stage 2 – Miaolingian age.
As mentioned in Sections 4.b and 5.b, the primary source of the Ipu Formation is undoubtedly Neoproterozoic, with only three Cambrian detrital zircon grains in the uppermost succession of this unit. As clearly shown in the graphics of Figures 6 and 9a, the sediment sources for the Aprazível and Ipu formations are not the same. While the source areas of the Aprazível Formation were mainly proximal (i.e. close to the depositional site), the Ipu Formation was sourced from far terrains in the SE, probably related to the elevated orogenic areas correlated with the Neoproterozoic Brasiliano/Pan-African orogeny. Considering all available data, our integrative model assumes that the beginning of the Ipu Formation sedimentation could have started during late Cambrian and/or Early Ordovician time, and lasted until the Late Ordovician Epoch (ending with the Hirnantian tillite deposit).
5.d. Variation in source areas and palaeogeography reconstruction from the Jaibaras (rift) to Parnaíba (intracratonic) basins
The provenance changes between the rift and the intracratonic successions seem to be related with deep modifications in the sedimentary style, pattern of dispersion and distance from the primary source areas, as verified by: (i) changes in the detrital zircon ages between the Aprazível and Ipu formations, highlighting the lack of Cambrian grains within the lowermost succession of the Ipu Formation, and the substantial increase in the input of Palaeoproterozoic (Rhyacian) detrital zircon grains (Fig. 6); (ii) a diversified Neoproterozoic source for both units, despite the prevalence of Ediacaran and Cryogenian detrital zircon grains in Ipu Formation, especially in the lowermost and intermediate successions of this unit; and (iii) the fact that Cryogenian (683–637 Ma) grains became less representative throughout the uppermost part of the Ipu Formation, accompanied by an increase in Statherian (1748–1621 Ma) grains and the return of Cambrian grains.
This situation confirms that the Jaibaras Rift Basin was active during Neoproterozoic – early Cambrian time, in the final stages of the Brasiliano cycle and before the beginning of subsidence in the Parnaíba Basin (late Cambrian – Early Ordovician). Regardless of the time involved between the end of mechanical subsidence and the beginning of the thermal subsidence, this long-lived change may have produced a deep modification in the source areas between the rift and intracratonic basins. Synchronously to this passage, the collisional processes related to the final stages of Neoproterozoic Brasiliano/Pan-African orogeny at c. 550 Ma (e.g. Rio Preto and Riacho do Pontal orogenic belts; see Figs 3, 8, 9a, 10) were responsible for the uplift of many cratonic terrains located at south and SE parts of Borborema Province. The continued process of exhumation of this area (Brito Neves et al. Reference Brito Neves, Fuck and Pimentel2014) led to a substantial increase in the production of sediments that were apparently dispersed and deposited by continental-scale fluvial systems (Squire et al. Reference Squire, Campbell, Allen and Wilson2006; Cawood et al. Reference Cawood, Hawkesworth and Dhuime2012; Linol et al. Reference Linol, De Wit, Kasanzu, Da Silva Schmitt, Corrêa-Martins, Assis, Linol and Wit2016). These huge rivers, including that represented by the sedimentary record of the Ipu Formation, ultimately flowed to the margins of the Gondwana supercontinent (Torsvik & Cocks, Reference Torsvik and Cocks2011, Reference Torsvik and Cocks2013; Cao et al. Reference Cao, Flament, Zahirovic, Williams and Müller2019).
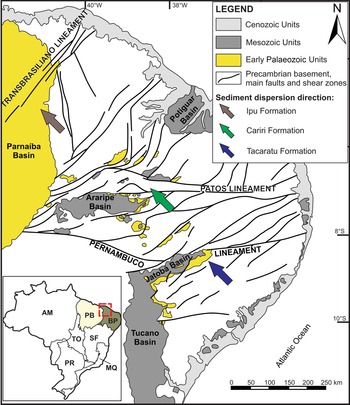
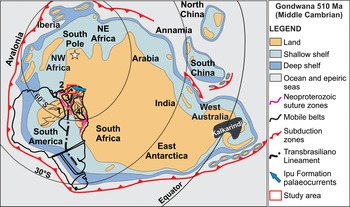
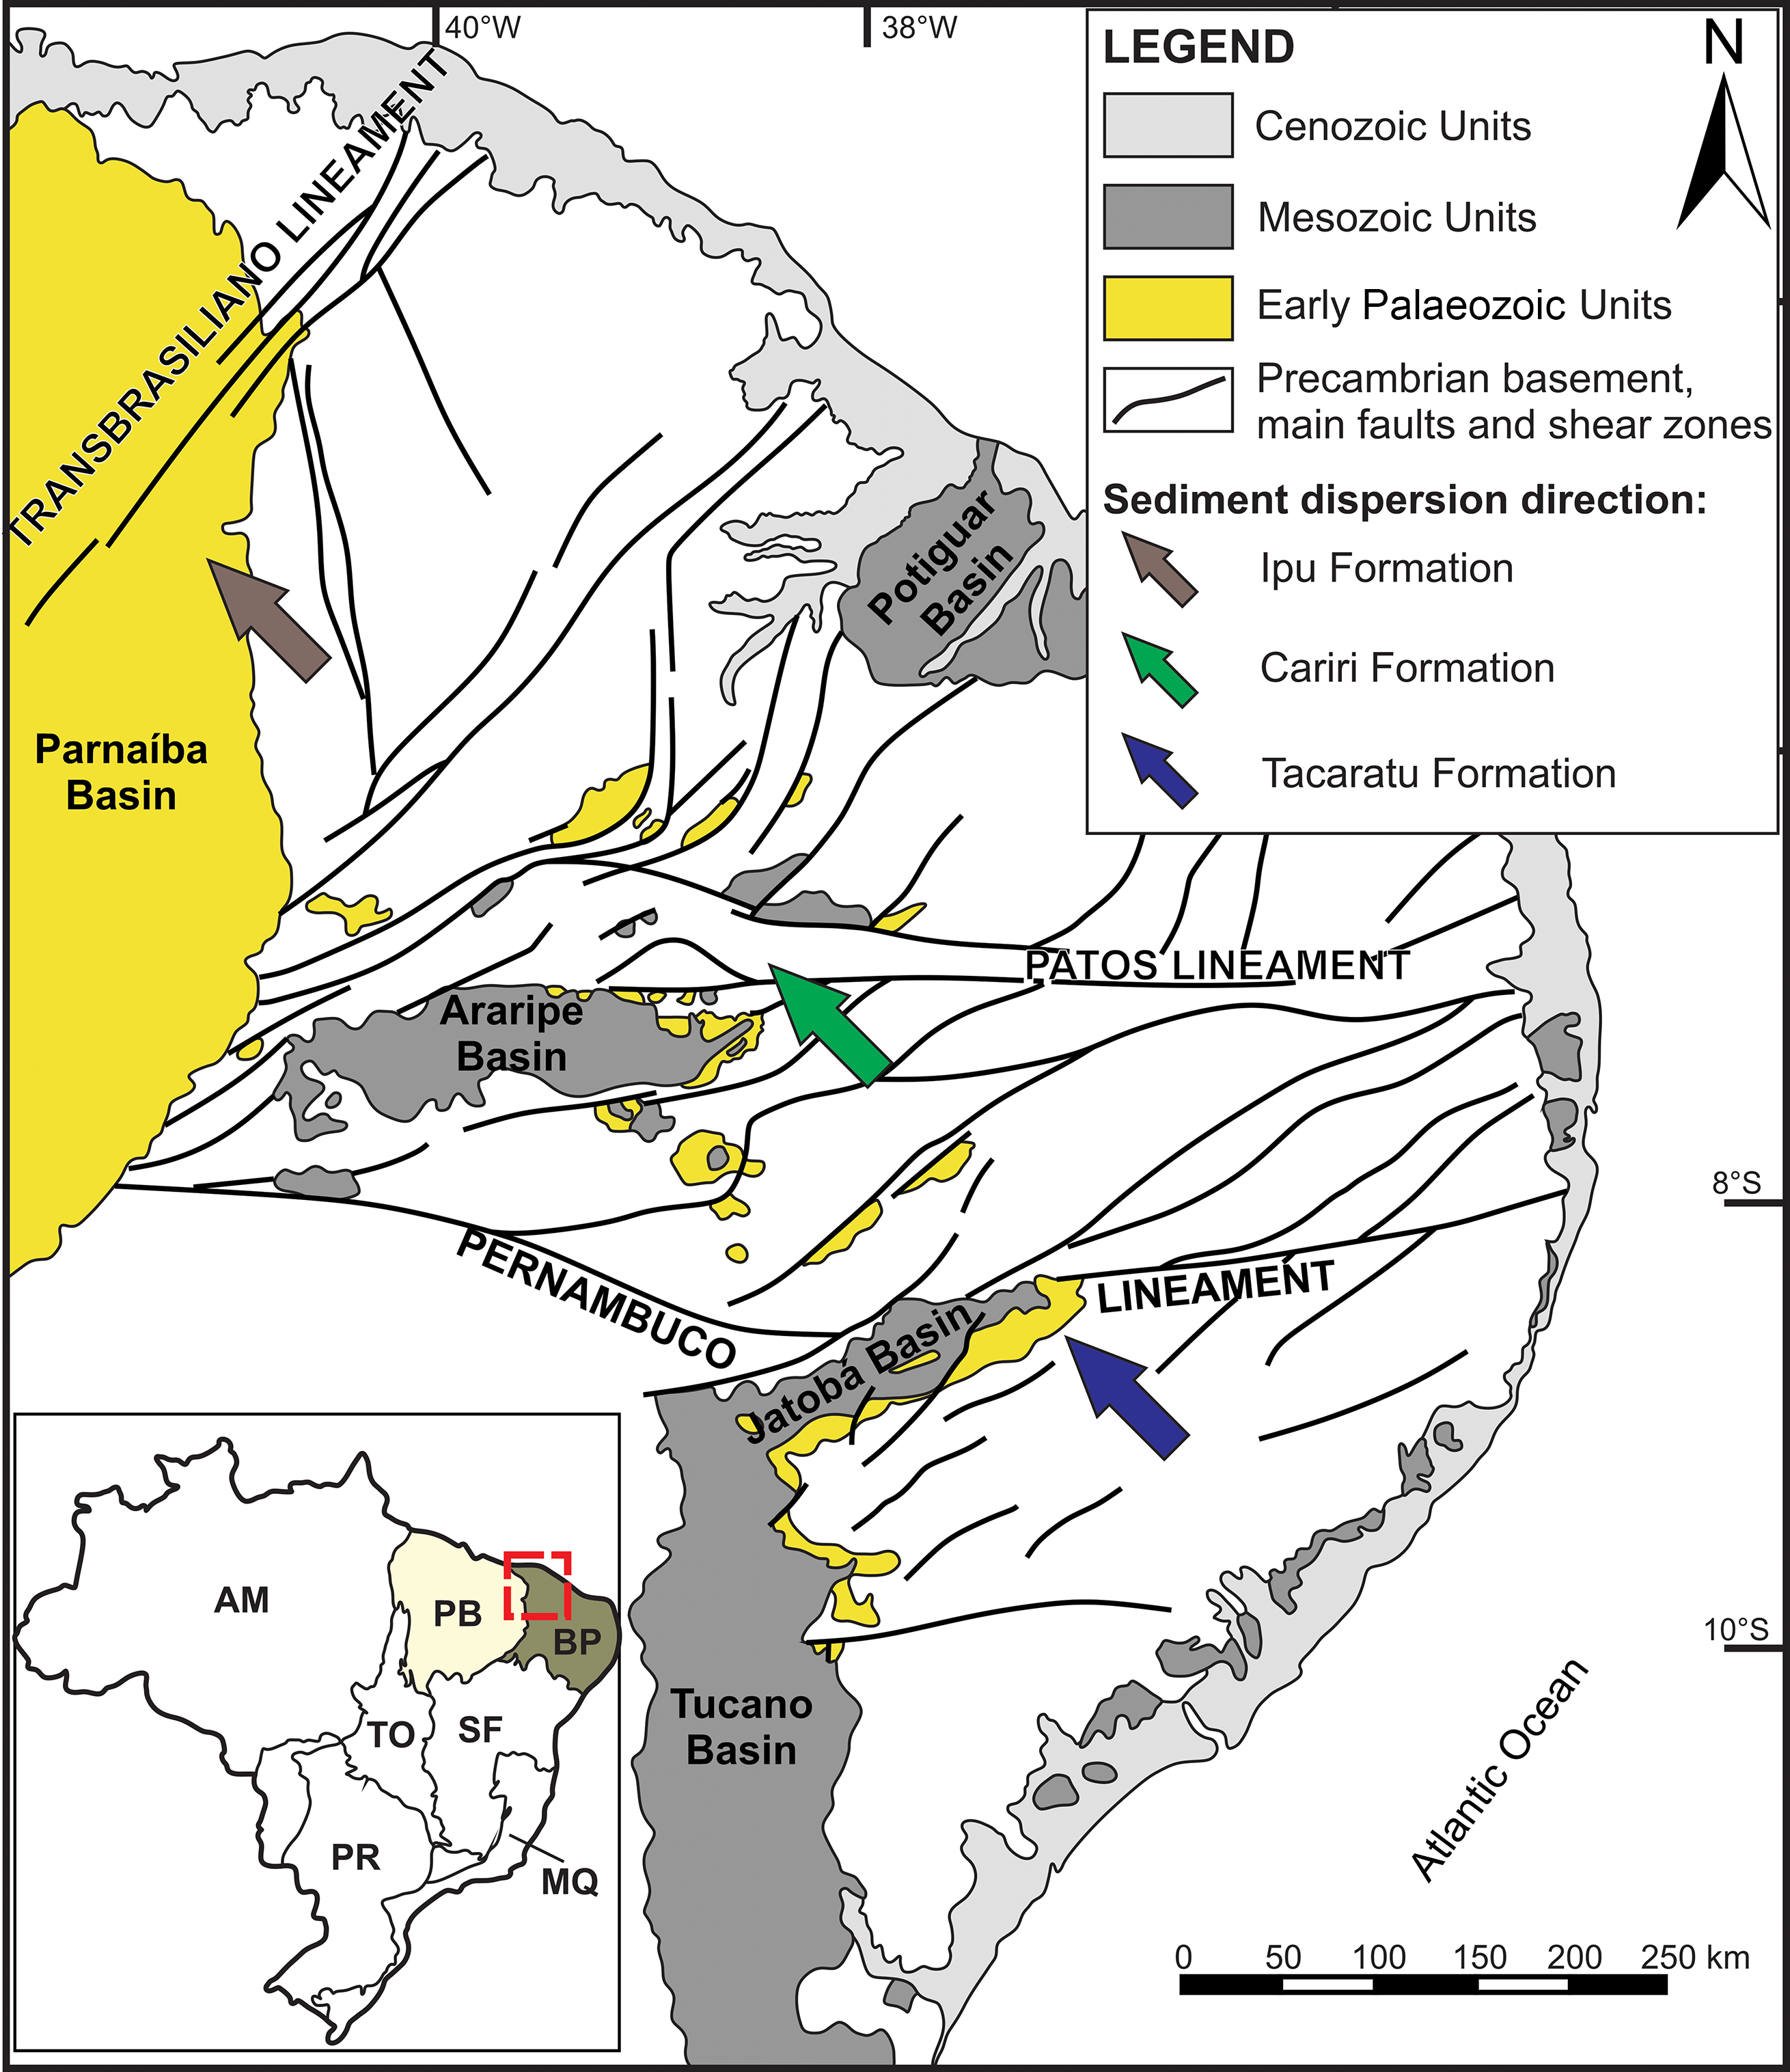
At this point it is important to consider that the initial sedimentation in the Parnaíba Basin is assumed to originally extend beyond the present-day basin limits (Braun, Reference Braun1966; Ghignone, Reference Ghignone1979). It is therefore plausible that the original record of the Ipu Formation might have extended to the south and SE, where the Cariri Formation of the Araripe Basin and the Tacaratu Formation of the Jatobá and Tucano basins are recorded (Braun, Reference Braun1966; Ghignone, Reference Ghignone1979; Caputo & Crowell Reference Caputo and Crowell1985; Assine, Reference Assine1992, Reference Assine1994; Fig. 11). The Cariri Formation is part of the Syneclise Sequence (early Palaeozoic) of the Araripe Basin, and as well as the Tacaratu Formation (Carvalho et al. Reference Carvalho, Neumann, Fambrini, Assine, Vieira, Da Rocha and Ramos2018), and is composed of fining-upwards successions characterized by quartz-dominated conglomerate and coarse-grained sandstone, with trough and planar cross-stratification, horizontal stratification and massive bedding, interpreted as deposited in a huge braided river plain (Assine, Reference Assine1992, Reference Assine2007; Arai, Reference Arai2006; Batista et al. Reference Batista, Valença, Silva, Neumann, Santos and Fambrini2012; Silvestre et al. Reference Silvestre, Fambrini and Santos2017). Although there is no absolute dating of these successions, Early Ordovician – Silurian (Assine, Reference Assine1992; Ponte & Ponte Filho, Reference Ponte and Ponte-Filho1996) and Late Ordovician – Early Devonian (Assine, Reference Assine2007) ages are attributed to its deposition based on regional correlation with the Serra Grande Group and the consistent palaeocurrent pattern between these units (Assine, Reference Assine1994). The palaeocurrents of the Cariri Formation indicate palaeoflow towards the NW, and subordinately to the NE (Assine, Reference Assine1994; Batista et al. Reference Batista, Valença, Silva, Neumann, Santos and Fambrini2012; Silvestre et al. Reference Silvestre, Fambrini and Santos2017), in agreement to that observed for the Tacaratu Formation (Carvalho et al. Reference Carvalho, Neumann, Fambrini, Assine, Vieira, Da Rocha and Ramos2018). The palaeocurrent (Cerri et al. Reference Cerri, Warren, Varejão, Marconato, Luvizotto and Assine2020) and fluvial architecture (Janikian et al. Reference Janikian, Almeida, Galeazzi, Tamura, Ardito and Chamani2019) of Ipu and Jaicós formations of Serra Grande Group corroborate the regional sedimentary dispersion pattern and indicate the presence of a marine basin to the west and NW, with a marine transgression (represented by Tianguá Formation) towards the east and SE. It is therefore plausible that this sediment route from the elevated orogenic mountain areas of the Brasiliano/Pan-African orogens at the south and SE possibly flowed to the oceanic areas located at the west and NW margins of the Gondwana supercontinent (Fig. 12).
Schematic map from the NE region of Brazil, highlighting the Parnaíba, Araripe and Tucano-Jatobá basins. Light yellow indicates Palaeozoic units interpreted as correlatives of Ipu Formation, including Cariri (Araripe Basin) and Tacaratu formations (Tucano and Jatobá basins). Modified from Assine (Reference Assine1994) and Fambrini et al. (Reference Fambrini, Neumann, Barros, Silva, Galm and Menezes Filho2013).
Gondwana reconstruction at 510 Ma highlighting the South American continent and Neoproterozoic suture zones (pink line) and mobile belts (black line). 1, Amazon Craton; 2, São Luis Craton; 3, Parnaíba Block; 4, São Francisco Craton. Modified from Torsvik & Cocks (Reference Torsvik and Cocks2013) and Cordani et al. (Reference Cordani, Ramos, Fraga, Cegarra, Delgado, Souza and Schobbenhaus2016).

6. Insights into the Parnaíba Basin origin from the perspective of Ipu Formation sedimentary evolution
The first subsidence pulse of intracratonic basins possibly starts as a huge and broad regional tilting of the continent in areas of weakened lithosphere (e.g. Sloss, Reference Sloss1963, Reference Sloss1988; Allen & Armitage, Reference Allen and Armitage2012). For example, in the Proterozoic – Lower Ordovician Sauk Sequence (Sloss, Reference Sloss1963), the widespread distribution of accumulated sediments suggests a ramp-like tilting of the North American craton towards its edges (Iapetus Ocean) (Armitage & Allen, Reference Armitage and Allen2010; Allen & Armitage, Reference Allen and Armitage2012; Armitage et al. Reference Armitage, Jaupart, Fourel and Allen2013). In the North American case, the intracratonic basins (region of tilted continent) developed within the break-up and dispersal of Gondwana, the formation of Pangea and its consequent break-up and dispersal (Armitage & Allen, Reference Armitage and Allen2010), and were transected in high angle by a previously formed rift system (i.e. Reelfoot Rift beneath the Illinois Basin) (Quinlan, Reference Quinlan, Beaumont and Tankard1987; Armitage & Allen, Reference Armitage and Allen2010; Allen & Armitage, Reference Allen and Armitage2012). Apparently, this pattern is also observed in the intracratonic basins of North Africa (e.g. Al Kufrah, Murzuk and Ghadames), in which the initial sedimentation zone was part of a large extensive platform or ramp during the Cambro-Ordovician interval (Allen & Armitage, Reference Allen and Armitage2012). Analogously to the example of the North American intracratonic basins, the North African Cambro-Ordovician palaeogeographical scenario points to the existence of a broad platform sloping gently to the north and opened to the ocean, characterizing a huge continental area covered by siliciclastic sediment deposits (Wang et al. Reference Wang, Spencer, Hamdidouche, Zhao, Evans and McDonald2020). In the North African case, the initial subsidence process related to the formation of a tilted ramp was influenced by weakened lithosphere represented by the Precambrian–Cambrian rift-related basins in the original platform (Allen & Armitage, Reference Allen and Armitage2012). It therefore seems that the wide regional tilting of the continent (in a ramp-like geometry) towards the basin edges (oceanic domains) may be a generic characteristic related to supercontinental break-up and passive margin development (Allen & Armitage, Reference Allen and Armitage2012; Armitage et al. Reference Armitage, Jaupart, Fourel and Allen2013).
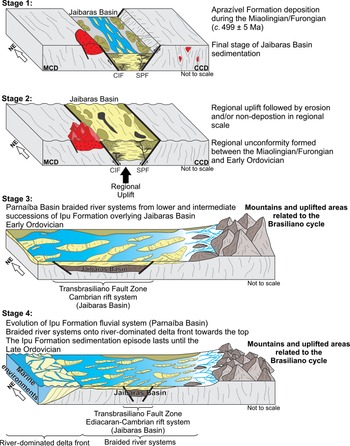
The characteristics observed in the North American and North African intracratonic basins (Allen & Armitage, Reference Allen and Armitage2012; Armitage et al. Reference Armitage, Jaupart, Fourel and Allen2013; Wang et al. Reference Wang, Spencer, Hamdidouche, Zhao, Evans and McDonald2020) are similar to that recorded in the Parnaíba Basin. First, it is necessary to consider that the boundary between the Jaibaras Rift Basin and the cratonic Parnaíba Basin is diachronous (Fig. 13, Stage 2). Second, the existence of stratigraphic onlaps and offlaps seems to be a common characteristic in the contact between rift and intracratonic basins (Dewey, Reference Dewey1982; White & McKenzie, Reference White and McKenzie1988). Both situations are recognized in the Jaibaras and Parnaíba basins, including the presence of stratigraphic onlap of the Ipu and Tianguá formations over the Precambrian basement at the eastern border of the Parnaíba Basin (Menzies et al. Reference Menzies, Carter and Macdonald2018), and the off-lapping geometry of the Parnaíba Basin sedimentary successions (Tozer et al. Reference Tozer, Watts and Daly2017; Daly et al. Reference Daly, Fuck, Julià, Macdonald, Watts, Daly, Fuck, Julià, Macdonald and Watts2018). According to the available data, the subsidence history of the Parnaíba Basin is marked by an initial fast subsidence rate that decreased through time (see similar cases in Allen & Armitage, Reference Allen and Armitage2012), but neither the basement nor the stratigraphic record show clear evidence of extensive crustal stretching and thinning (Tozer et al. Reference Tozer, Watts and Daly2017; McKenzie & Tribaldos, Reference McKenzie and Tribaldos2018). Although thermal cooling, loading history and plate strengthening could also have contributed to the initial subsidence of the Parnaíba Basin during late Cambrian–Ordovician time (Tozer et al. Reference Tozer, Watts and Daly2017), the early sedimentation of the Ipu Formation seems to have been much more influenced by the localized transtensional reactivation along the NE–SW structures inherited from the rift system and the Transbrasiliano Lineament (Destro et al. Reference Destro, Szatmari and Ladeira1994; Oliveira & Mohriak, Reference Oliveira and Mohriak2003; Hasui, Reference Hasui, Hasui, Carneiro, Almeida and Bartorelli2012; Castro et al. Reference Castro, Bezerra, Fuck and Vidotti2016; Abelha et al. Reference Abelha, Petersohn, Bastos, Araújo, Daly, Fuck, Julià, Macdonald and Watts2018; Assis et al. Reference Assis, Porto, Schmitt, Linol, Medeiros, Martins and Silva2019). The lithospheric re-equilibrium and thermal contraction along the Transbrasiliano Lineament following the end of the rift process resulted in a widespread and long-lived subsidence episode, probably related to the negative buoyancy effect (Oliveira & Mohriak, Reference Oliveira and Mohriak2003; Castro et al. Reference Castro, Bezerra, Fuck and Vidotti2016). It is therefore correct to say that the initial subsidence of the Parnaíba Basin was not directly associated with the previous rift subsidence, but influenced by the reactivation of these rift structures. In this way, the available models indicate an initial evolution comparable to the North American and North African intracratonic basins (Allen & Armitage, Reference Allen and Armitage2012; Armitage et al. Reference Armitage, Jaupart, Fourel and Allen2013; Wang et al. Reference Wang, Spencer, Hamdidouche, Zhao, Evans and McDonald2020).
Schematic evolution of the Ediacaran Jaibaras and Ordovician Parnaíba basins, beginning with the final deposition of Aprazível Formation and culminating with the deposition of the Ipu Formation. The figures are not to scale. CIF – Café–Ipueiras Fault; SPS: Sobral–Pedro II Fault; MCD – Médio Coreaú Domain; CCD – Ceará Central Domain.

In the context of the early stages of intracratonic subsidence, a transcontinental fluvial sediment system developed, flowing from the remaining elevated areas of the Brazilian mobile belts towards the NW margin of the newly formed western Gondwana (similarly to the North African case; Wang et al. Reference Wang, Spencer, Hamdidouche, Zhao, Evans and McDonald2020). This included the rivers responsible for the deposition of the Ipu, Cariri and Tacaratu formations (Fig. 11) that flowed through the tilted subsiding ramp crossing the palaeorelief generated by the Ediacaran–Cambrian Continental Rift System (Fig. 13, Stages 3 and 4), finally reaching the ocean located at northwestern part of Gondwana. In this palaeogeographic context, the drainage was locally captured by previously formed grabens such as the Jaibaras Basin (the Ipu Formation thickens across graben structures; Assis et al. Reference Assis, Porto, Schmitt, Linol, Medeiros, Martins and Silva2019) and by the topographic depressed areas of the newly subsiding Parnaíba Basin, where it deposited the thick fluvial succession of the Ipu Formation over the palaeorelief generated by the erosion of the Ediacaran–Cambrian Continental Rift System (Fig. 10). These first continental deposits were lately covered by marine deposits that represent the end of the initial depositional cycle of the Parnaíba Basin.
7. Conclusions
We performed an integrated analysis combining U–Pb detrital zircon geochronology with stratigraphic and provenance data of the Aprazível and Ipu formations in order to identify differences and similarities in the source areas and sedimentary style between the Jaibaras Rift Basin and the intracratonic Parnaíba Basin. Our data reveal important changes between the last depositional cycle from the Jaibaras Basin and the installation of the Parnaíba Basin, materialized by difference in stratigraphic architecture, sources areas and maximum depositional ages. We make the following conclusions. (i) The Aprazível Formation presents an MDA of 504–494 Ma (c. 499 ± 5 Ma, Furongian–Miaolingian). (ii) The Ipu Formation records an MDA of 539–517 Ma (c. 528 ± 11 Ma, Terreneuvian–Cambrian Series 2); however, because of its stratigraphic relationships with the lower Aprazível Formation (c. 499 ± 5 Ma) and the tillite deposits from the upper Ipu Formation (Hirnantian, Late Ordovician), the depositional age of this unit is certainly younger (late Cambrian and/or Early–Late Ordovician). (iii) There was an important modification in the provenance signal from the end of the rift (Aprazível Formation) to the beginning of the intracratonic basin (Ipu Formation), marked by a change in the source area characterized by the absence of Cambrian detrital zircon grains followed by a significant increase in Palaeoproterozoic grains in the Ipu Formation. (iv) The sediment sources for the initial sedimentation pulse of the intracratonic Parnaíba Basin are located to the south and SE of the palaeodepositional site, pointing to an important increase in the distance of the sediment route. Neoproterozoic orogens and other coeval units related to the Brasiliano Cycle from Borborema Province limit the Parnaíba Basin in its south and SE portion (collisional structural highs and Rio Preto and Riacho do Pontal belts), and were probably the main source of sediments for the Ipu Formation. (v) The palaeocurrents measured in other coeval units located in NE Brazil, such as the Cariri and Tacaratu formations, reinforce a consistent sedimentary transport towards the NW. These units are characterized by great facies and architectural similarity, indicating transport in a huge fluvial system in western Gondwana that flowed from orogenic mountain areas located in the south and SE regions of the Borborema Province, in a ramp-like tilted terrain, to low areas probably open to the ocean in the northwestern palaeoborders of the newly formed Gondwana Supercontinent.
Acknowledgments
The authors thank the São Paulo Research Foundation (FAPESP) (process 2017/19550-1) for RIC’s scholarship, and Petrobras (2014/00519-9) for financial support. We also thank the Instituto de Geociências Exatas, Universidade Estadual Paulista, Rio Claro for providing laboratory facilities.
Conflict of interest
None.
Supplementary material
To view supplementary material for this article, please visit https://doi.org/10.1017/S0016756821000236