The structures of clay minerals, most of which are phyllosilicates, are often enigmatic owing to the existence of various polytypes, stacking disorder, the interstratification of various kinds of unit layers and/or interlayer materials, etc. Because most of these structural variations in phyllosilicates represent variables along the stacking direction, whereas the periodicity of the structure within the layers or sheets is almost invariant, direct imaging of the atomic structure using transmission electron microscopy (TEM) is most effective when it is conducted with the incident electron beam parallel to the layers. As demonstrated in recent decades by a number of clay mineralogists, high-resolution TEM (HRTEM) has been successful at unravelling such complex structures of clay minerals and phyllosilicates (e.g. Baronnet, Reference Baronnet and Buseck1992; Peacor, Reference Peacor and Buseck1992). In this review, the author will introduce the basis and several examples of such HRTEM research in clay mineralogy.
The development of new technologies for electron microscopy has continued to advance, year by year, in response the requirements from various scientific fields. This progress should be introduced into clay science to solve a number of remaining problems pertaining to the structures of clay minerals. In the latter part of this review, several examples of the applications of such advanced electron microscopic technologies to clay minerals will be introduced, mainly to stimulate clay scientists in the coming decades.
Basics of HRTEM imaging of phyllosilicates
The first transmission electron microscope was created in 1931 by M. Knoll and E. Ruska to exceed the resolution of optical microscopes which is limited by the wavelength of visible light. Since then, the performance of TEM has improved rapidly. In particular, Menter (Reference Menter1956) first recorded lattice fringes in organic crystals and predicted that they may be useful tools for visualizing directly atomic arrangements in specimens on a screen. Imaging theory for HRTEM, developed in the 1960s, showed that ‘phase’ contrast can be obtained due to the interference between the direct and diffracted waves, which corresponds to the projection of the electrostatic potential in specimens along the incident beam. In this case, the resolution to reproduce the electrostatic potential (point resolution or Scherzer resolution: d s) is defined by Equation 1 for sufficiently thin specimens:
 $$d_{\rm s} = 0.66C_{\rm s}^{1/4} {\rm \lambda}^{3/4}$$
where C s is the spherical aberration coefficient of the objective lens and λ is the wavelength of the electron beam determined by the accelerating voltage (Spence, Reference Spence1981). Following this equation, transmission electron microscopes with an objective lens of low spherical aberration and a small wavelength (i.e. a high accelerating voltage) have been developed to achieve direct imaging of the atomic structure of specimens in detail. For instance, in the last century, the C s value of the objective lens was minimized (e.g. Yanaka et al., Reference Yanaka, Moriyama and Buchanan1989), and transmission electron microscopes with an ultra-high accelerating voltage of ~1 MV and a resultant point resolution close to 0.1 nm were developed (e.g. Ichinose et al., Reference Ichinose, Sawada, Takuma and Osaki1999). Haider et al. (Reference Haider, Rose, Uhlemann, Kabius and Urban1998) developed an electro-optic system termed a ‘C s corrector’, which acts as a concave lens and eliminates completely the spherical aberration of the objective lens. In this system, a similar resolution to that obtained using an ultra-high-voltage transmission electron microscope of huge size (and cost) was obtained with a normal acceleration voltage of near to or less than 200 kV. The application of such superior high-resolution imaging will be discussed later, but here the author would like to discuss HRTEM imaging using a conventional transmission electron microscope with an objective lens of C s ≈ 0.5 mm, operating at 200 kV (resulting d s ≈ 0.2 nm), working in his laboratory.
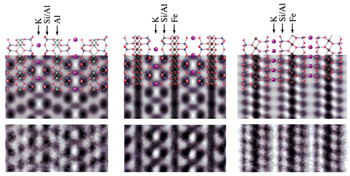
Figure 1 shows the correspondence between the crystal structures of dioctahedral and trioctahedral micas corresponding to simulated images (parameters for the simulation are listed in the caption for Fig. 1), with an optimum defocus value (–1.2C s1/2λ1/2), called the ‘Scherzer focus’, and experimental images (Kogure, Reference Kogure, Mottana, Sassi, Thompson and Guggenheim2002). The cation columns in the mica structures along the beam direction appear as dark dots in the simulated and experimental images, with a resolution of ~0.2 nm (Fig. 1). These are regarded as ‘blurred’ images from the projected electrostatic potential in the specimen. The images are formed by applying a low-pass filter corresponding to the objective aperture, which passes the spatial frequency of <5 (= 1/0.2) nm–1. Such images are often called ‘structure images’ (Spence, Reference Spence1981), which should be distinguished from so-called ‘lattice images’, in which image contrasts do not correspond directly to atomic columns, although both kinds of images are generally called ‘HRTEM images’ without discrimination. Structure images can be obtained with a sufficiently small specimen thickness (generally a few nanometres), proper focusing conditions and objective aperture, exact crystal orientation, complete elimination of astigmatism, etc. Although Fig. 1 is an example for micas, such results are applicable to most phyllosilicates, the structures of which include tetrahedral (T) and octahedral (O) sheets. In Fig. 1, if the structures are observed along [100], each sheet in the 2:1 layer has the following contrast: the T sheet has distinct dark spots separated from each other by b/2 (~0.45 nm) along the b-axis. Each spot corresponds to two tetrahedra (actually a tetrahedral chain in the T sheet along [100]). The O sheet between the two T sheets in muscovite also appears as dark spots separated by b/2, which corresponds to two occupied octahedra in the case of the trans-vacant dioctahedral sheet (Fig. 1, left column). On the other hand, the O sheet is imaged as a continuous, dark contrast if the sheet is trioctahedral (Fig. 1, centre column) because vacant M 1 sites in the dioctahedral sheet are also occupied by metal cations, and accordingly the cation columns are separated laterally by ~0.15 nm, which is less than the point resolution of ~0.2 nm. On the other hand, dark spots separated by a/2 (~0.26 nm), corresponding to single polyhedra, appear at both T and O sheets, if viewed along [010] (Fig. 1, right column). Moreover, the direction of the octahedral slant can be distinguished by the potential of oxygens coordinating octahedral cations, which is, for instance, useful in the polytypic analysis of chlorite with hydroxide (brucite-like) interlayer sheets (Kogure & Banfield, Reference Kogure and Banfield1998). Finally, in potassium micas, potassium ions at the interlayer region may be resolved as dark spots if viewed along [100], but they are not clearly identified in the image along [010], partly because of the difference in density of potassium ions in the columns along the beam direction. Sample preparation techniques are also an issue for such TEM imaging because phyllosilicates normally possess a platy morphology. Conventional and simple methods to disperse clay particles on an electron-transparent carbon film are not suitable, as most clay particles are oriented with their unit layers almost perpendicular to the incident beam. Ultramicrotomy, ion milling or focused ion beams are necessary to prepare sectional thin foils of clay particles or phyllosilicates.
Correspondence between (top row) crystal structures, (centre row) simulated images and (bottom row) experimental images of micas. (Left column) Muscovite-2M 1 viewed along [100]. (Centre column) Annite-2M 1 viewed along [100]. (Right column) Annite-2M 1 viewed along [010]. The experimental images for annite were actually taken from magnesian annite with a Mg/(Fe + Mg) ratio of 0.29. The parameters for the simulation are V acc = 200 kV, C s = 0.5 mm, defocus spread = 5 nm, reciprocal space limited by the objective aperture = 7 nm−1, defocus value = –42 nm and specimen thickness = 2.5 nm (Kogure, Reference Kogure, Mottana, Sassi, Thompson and Guggenheim2002).

Regarding the trigonal symmetry of T and O sheets, similar contrasts appear with the beam direction along the other zone axes (Fig. 2). A hexagonal crystal system, Xi (i = 1–3) and Yi (i = 1–3), is adopted according to Bailey (Reference Bailey1984), and one trioctahedral 2:1 layer (phlogopite) with a lateral shift between the lower and upper T sheets (represented by the bold blue arrow in the centre of Fig. 2) antiparallel to X 1 is assumed (Fig. 2). Images along ±Xi (i = 1–3) and those along ±Yi (i = 1–3) are identical, relative to the appearance of the T and O sheets. However, the six figures for ±Xi (or ±Yi) are different with respect to the direction and amount of the lateral shift between the closest two dark spots at the lower and upper T sheets, depending on the angle between the incident beam and the lateral shift between the two T sheets, as indicated by the white bars in Fig. 2, which connect the two spots in each image. In other words, one can determine the ‘orientation’ of a 2:1 layer, which is defined by the lateral shift between the lower and upper T sheets (as is shown below, the orientation of a 1:1 layer can also be determined) from such HRTEM images. In the actual HRTEM procedure, the specimen is tilted in the transmission electron microscope so that the beam direction is parallel to one of the six ±Xi (or ±Yi) directions. The orientations of individual 2:1 layers are then determined from the acquired image. Strictly speaking, however, the absolute determination of the layer orientation is impossible from only a single HRTEM image along a specific direction. For instance, the two images in Fig. 2 with the beam directions parallel (–X 1) and antiparallel (+X 1) to the lateral shift are identical. Hence, another image for the same layer(s) along another direction in Fig. 2 is necessary to distinguish them, as is seen in the next section for micas. In addition, the lateral shift between the contrasts from the adjacent layers, or that across the interlayer region, can also be determined from such HRTEM images containing the adjacent layers in the stacking analysis of phyllosilicates other than micas.
Simulated images of one trioctahedral 2:1 layer (phlogopite) with the incident electron beam along 12 major directions parallel to the layer. The direction of the lateral shift of a/3 from the lower T sheet to the upper one in the 2:1 layer is indicated by the blue arrow at the centre. The white bar in each image connects the nearest dark spots in the lower and upper T sheets, indicating the lateral shift between the contrasts at the two T sheets.

As mentioned above, for the rigorous determination of stacking sequences (layer orientation and lateral shift) in phyllosilicates by HRTEM, two images of the same layer along various beam directions are necessary. However, most clay minerals are too beam-sensitive to undergo high-quality HRTEM imaging twice. As such, we have to assess the stacking sequences using a single HRTEM image, along with other information such as diffraction. For instance, if the selected-area electron diffraction pattern along one of the ±Yi directions is completely discrete and shows no streaks along the reciprocal lattice rows parallel to c*, we can discuss – to some extent – the stacking sequences from only a single HRTEM image along one of the ±Xi directions. However, the acquisition of two images remains desirable. Overcoming the radiation damage problem is an issue for the future.
Stacking sequences in micas
Analysis of the stacking sequence or disorder in micas was one of the first applications of HRTEM in mineralogy (Iijima & Buseck, Reference Iijima and Buseck1978; Tomura et al., Reference Tomura, Kitamura and Sunagawa1978). Theoretically, the stacking sequence of micas is simpler than that of other phyllosilicates. In micas, the lateral shift across the interlayer regions is not allowed due to the alkaline and alkaline earth ions that occupy the central space between the upper and lower six-membered rings of the facing T sheets of the adjacent layers. The exceptions are sodium-bearing trioctahedral micas such as aspidolite and wonesite, in which the lateral shift at the interlayer regions is recognized in their HRTEM images (Kogure et al., Reference Kogure, Banno and Miyawaki2004, Reference Kogure, Miyawaki and Banno2005) (see below). For micas other than these exceptions, the analysis of the stacking sequences is equivalent to the determination of the orientation of individual 2:1 layers. In other words, it is equivalent to the determination of the mutual rotation angle between the adjacent layers. The orientation of a 2:1 layer is imaged as an inclination (or lack of inclination) of a bar connecting the closest two dark spots in the lower and upper tetrahedral sheets in a 2:1 layer (Fig. 2). If the electron beam direction is parallel to one of ±Xi, the inclination is towards the ‘right’, the ‘left’ or there is ‘no inclination’, depending on the angle between the beam direction and the lateral shift. If the beam is parallel to one of ±Yi, the inclination is towards the ‘right’ or the ‘left’ (Fig. 2). Figure 3 shows HRTEM images of fibrous Mg-rich illite (gümbelite) along one of ±Xi and one of ±Yi (Kameda et al., Reference Kameda, Miyawaki, Drits and Kogure2007a). Heavy stacking disorder is observable in the both images, but locally a two-layer polytype (probably 2M 2; see Kameda et al. (2007)) is formed. As mentioned above, because a TEM image is simply a projection of the specimen, two images of the same layer from the different directions are necessary to determine unambiguously the lateral shift in a 2:1 layer. Actually, two candidates of the standard polytypes are to be expected from the image contrast in Fig. 3a. However, this is often difficult to determine due to a limited specimen tilt angle in TEM or radiation damage, which does not allow us to acquire another HRTEM image from the same area. Examples of limited successful results are Kogure & Nespolo (Reference Kogure and Nespolo1999a) for long-period polytypes, Kogure & Nespolo (Reference Kogure and Nespolo1999b) for stacking disorder in biotite and Kogure et al. (Reference Kogure, Kameda and Drits2008b) for celadonite. Figure 4 shows two HRTEM images along [100] and [310] from the same area of a celadonite specimen (Kogure et al., Reference Kogure, Kameda and Drits2008b). The determination of the lateral shift in each 2:1 layer from the two images suggests that stacking faults with mutual rotation of 180° between adjacent layers frequently occur in the 1M polytype. Simulation of the powder XRD pattern indicated that the peak intensity and width of reflections with h = k will be modified to be weaker and larger, respectively, by these stacking faults, and this tendency was actually observed in the experimental XRD patterns (Kogure et al., Reference Kogure, Kameda and Drits2008b). Of course, a single image along one of ±Xi is still valid for determining the stacking sequence in micas (and other phyllosilicates), assuming that the mutual rotation between the adjacent layers is restricted to 0°, +120° or –120° (‘subfamily A’) (Backhaus & Ďurovič, Reference Backhaus and Ďurovič1984), which is indeed the case for most micas.
Filtered HRTEM images from gümbelite, Mg-bearing illite along (a) one of X i and (b) one of Y i. Note that the two images were taken from different regions. Noise contrast was removed using a Wiener filter, as described by Kogure et al. (Reference Kogure, Eilers and Ishizuka2008a), to identify the orientation of each 2 :1 layer. The white bars in (b) are the same as those introduced in Fig. 2 (Kameda et al., Reference Kameda, Miyawaki, Drits and Kogure2007a).

(a) Filtered HRTEM image of a crystallite from Krivoi Rog celadonite recorded along the [100] direction. Along this direction, no stacking faults are observed. (b) Filtered HRTEM image of the same region, but the crystallite is rotated by 30° about the c*-axis ([310] direction). The white bars in each layer in (b) are the same as those introduced in Fig. 2. The insets at the bottom-right of each image show the original raw HRTEM images (Kogure et al., Reference Kogure, Kameda and Drits2008b).

Kaolin-group minerals and pyrophyllite
For other 2:1 phyllosilicates and 1:1 phyllosilicates, lateral shift between the adjacent layers at the interlayer region in various directions and amounts becomes another origin of polytypism and/or stacking disorder, along with the orientation of individual layers. In general, the direction and amount of lateral shift are not diverse but very limited, similarly to the layer orientation with its six alternatives. This is mainly because hydrogen bonding is formed between the layers in 1:1 phyllosilicates and between the silicate layers and hydrated or hydroxylated materials at the interlayer region in 2:1 phyllosilicates other than micas. As described below, because phyllosilicates adopt either or both of these two types of variables (layer orientation and lateral shift) in the stacking sequence and they modulate diffraction patterns similarly, direct imaging of the individual layers by HRTEM is often the only solution to distinguishing them. In the following, kaolinite and pyrophyllite are selected as examples.
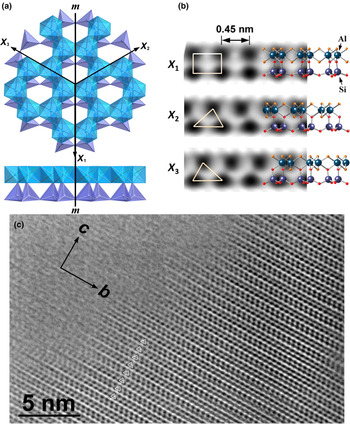
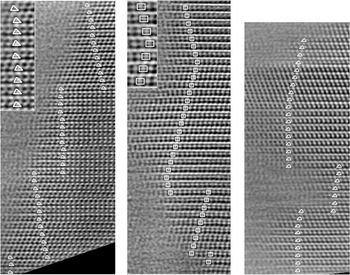
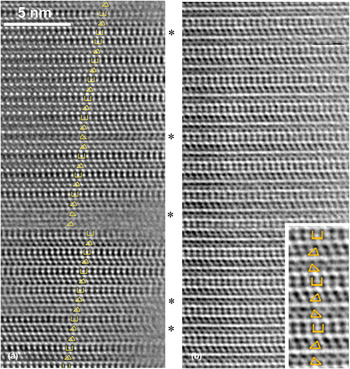
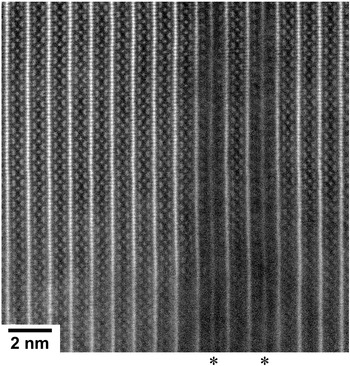
Kaolinite, a 1:1 dioctahedral phyllosilicate, is one of the most common clay minerals on the terrestrial surface. Standard polytypes found in nature and reported to date are 1A (1Tc) (kaolinite) and two 2M (dickite and nacrite) (Bailey, Reference Bailey1963), although the number of possible standard polytypes that can theoretically be derived is 52 (Zvyagin, Reference Zvyagin1962). In addition, a hydrated (but easily dehydrated) form that usually adopts a tubular morphology is known as halloysite. Kaolinite also shows various XRD patterns that are mainly dependent on the degree of stacking disorder (e.g. Giese, Reference Giese and Bailey1988). However, the actual structure of the stacking disorder used not to be clear, and several models were proposed to resolve this issue, such as those of disorder of layer orientation and of lateral shift (e.g. Brindley & Robinson, Reference Brindley and Robinson1946; Murray, Reference Murray1954; Plancon & Tchoubar, Reference Plançon and Tchoubar1977; Bookin et al., Reference Bookin, Drits, Plançon and Tchoubar1989). In 1:1 dioctahedral phyllosilicates, the mutual rotation of ±120° is almost equivalent to the displacement of the octahedral vacant site, and such disorder is regarded as the incorporation of the stacking mode of dickite (2M) into the ordered kaolinite (1A) structure. In burial diagenesis, the dickite/kaolinite volume ratio becomes greater as depth increases (Beaufort et al., Reference Beaufort, Cassagnabere, Petit, Lanson, Berger, Lacharpagne and Johansen1998). It is of interest as to whether kaolinite gradually transforms into dickite through the migration of aluminium in the octahedral sheet in the same kaolinite particles or through dickite crystals nucleating and growing independently irrespective of pre-existing kaolinite. Kogure & Inoue (Reference Kogure and Inoue2005a) gave a solution to this issue by reporting the first HRTEM images of kaolinite and dickite of sufficient quality to determine unambiguously the stacking sequences in the mineral. The specimen investigated was kaolinite/dickite collected from a sandstone core in the North Sea with a burial depth of ~3500 m (Beaufort et al., Reference Beaufort, Cassagnabere, Petit, Lanson, Berger, Lacharpagne and Johansen1998). HRTEM imaging of dickite particles showed completely ordered two-layer periodicity with alternation of the layer orientation of X 2 and X 3 (Fig. 5a,b), or alternation of the octahedral B and C sites for the vacancy location between adjacent layers (Fig. 5c). By contrast, all 1:1 layers in the HRTEM images of kaolinite particles showed the same contrast (i.e. the same orientation or vacant site for all layers), excluding dickite-like stacking (Fig. 6). These results imply that dickite is not a transition product of kaolinite, but rather is authigenically precipitated from solution during burial of the strata (Kameda et al., Reference Kameda, Saruwatari, Beaufort and Kogure2008). On the other hand, the HRTEM images of kaolinite in Fig. 6 showed frequent changes in the direction of the stacking or the direction of the lateral shift between adjacent layers. The analysis of the contrast in these images indicated that the lateral shift in the stacking represents alternation of t1 and t2, which were defined by Bookin et al. (Reference Bookin, Drits, Plançon and Tchoubar1989). These two shifts are parallel to X 2 and X 3 in Fig. 5a and are related to each other by the pseudo-mirror plane (m in Fig. 5a) in the underlying kaolinite layer, and the energy difference between the two should be subtle. Hence, such disorder is to be expected during the layer-by-layer growth of kaolinite. The existence of t2 as stacking disorder in ordered t1 stacking (or vice versa) is concordant with the proposal arising from the XRD profile analysis by Plançon & Tchoubar (Reference Plançon and Tchoubar1977). A similar feature of the stacking in kaolinite was also observed in a sample of sedimentary origin (Kogure et al., Reference Kogure, Elzea-Kogel, Johnston and Bish2010). On the other hand, a kaolinite/dickite sample (dickite is dominant from powder XRD) of hydrothermal origin showed more complicated stacking with a mixture of disorder of layer rotation and that of lateral shift (Fig. 7a) (Kogure & Inoue, Reference Kogure and Inoue2005b). These disordered crystals probably precipitated from a more oversaturated solution and/or over a shorter time period than those formed by diagenesis. In this specimen, various long-period polytypes were also observed (Fig. 7b). It is probable that such long-period polytypes formed via spiral growth.
(a) Axial setting for a kaolinite layer and location of the pseudo-mirror plane (m) in the layer. (b) Simulated images of a kaolinite layer along the three directions, showing the correspondence to the crystal structure. The parameters for the simulation are the same as those in Fig. 1. The triangles and square in the images are the patterns used to identify the orientation of the layer. (c) HRTEM image from dickite from a sandstone core in the North Sea, showing regular two-layer periodicity without stacking faults. The beam direction is along [100] of dickite (Kogure & Inoue, Reference Kogure and Inoue2005a).

Filtered HRTEM images of various kaolinite from a sandstone core in the North Sea. The triangles and squares superimposed on individual layers indicate the orientation of the layers, as is shown in Fig. 5b. The insets are enlarged images of a portion in the back images (Kogure & Inoue, Reference Kogure and Inoue2005a).

(a) HRTEM image of dickite-kaolinite from a hydrothermal origin. The stacking is mainly that of dickite (the beam direction is [110]), but the stacking disorder of the layer orientation and/or lateral displacement are frequently observed around the layers marked with asterisks. (b) HRTEM image of kaolinite with a three-layer periodicity (Kogure & Inoue, Reference Kogure and Inoue2005b).

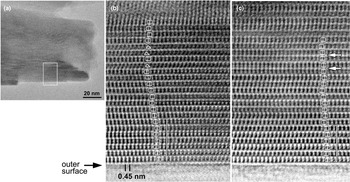
Later, Kogure et al. (Reference Kogure, Mori, Kimura and Takai2011, Reference Kogure, Mori, Drits and Takai2013b) successfully recorded high-quality HRTEM images from tubular halloysite, which unravelled the real stacking structure of the mineral, although more samples and/or observations are necessary for comprehensive conclusions to be drawn. Because halloysite is more beam-sensitive than kaolinite, the researchers used a transmission electron microscope with a new computer-assisted minimal-dose system (Hayashida et al., Reference Hayashida, Nomaguchi, Kimura and Takai2007; Kogure et al., Reference Kogure, Mori, Kimura and Takai2011). Previously, halloysite was suggested to possess two-layer periodicity from its electron diffraction (e.g. Honjo & Mihara, Reference Honjo and Mihara1954), but without a structure model. HRTEM images taken from a prismatic halloysite in Kogure et al. (2013) were similar to those reported for diagenetic kaolinite (Fig. 8). The orientation or octahedral vacancy position is almost the same for the constituting layers, but the layer shift with t1 or t2 is heavily disordered compared to diagenetic kaolinite, as is shown in Fig. 6. In general, the stacking does not have two-layer periodicity, although that with regular alternation of t1 and t2, which is the model proposed by Chukhrov & Zvyagin (Reference Chukhrov, Zvyagin, Heller and Weiss1966), was formed locally. Kogure et al. (2013) proposed the origin of a ‘two-periodicity-like’ diffraction pattern from the heavily disordered stacking sequence with similar populations of t1 and t2.
(a) Low-magnification image of a halloysite particle, showing the area of the HRTEM image in (b). Filtered HRTEM image of the rectangle in (a). The squares and triangles on the individual kaolinite layers indicate the layer orientation, as defined in Fig. 5b. The square bracket indicates a position where the stacking is regarded as a two-layer structure, as proposed by Chukhrov & Zvyagin (Reference Chukhrov, Zvyagin, Heller and Weiss1966). (c) Filtered HRTEM image of the side of another prismatic particle, showing a similar contrast. The interlayers indicated with the white arrows show no lateral shift between the contrasts at the two layers across the interlayer (Kogure et al., Reference Kogure, Mori, Drits and Takai2013b).

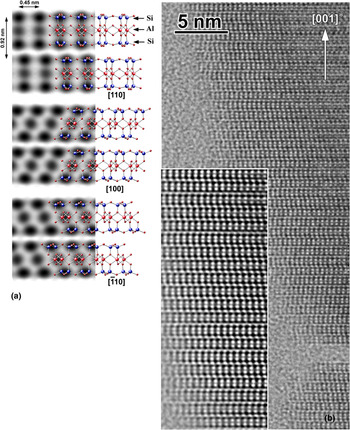
A similar stacking disorder of two kinds of interlayer shift but with rather uniform orientation of the unit layers was also observed in pyrophyllite, a dioctahedral 2:1 phyllosilicate with neither layer charge nor interlayer material (Fig. 9) (Kogure et al., Reference Kogure, Jige, Kameda, Yamagishi, Miyawaki and Kitagawa2006a). The origin of the disorder is also similar to that of kaolinite. The two kinds of interlayer shift are related to each other by a pseudo-mirror plane in a pyrophyllite layer. The disordered stacking sequence in Fig. 9 can explain the two broad peaks in the 02, 11 band in the powder XRD pattern from pyrophyllite (Kogure et al., Reference Kogure, Jige, Kameda, Yamagishi, Miyawaki and Kitagawa2006a), which were previously regarded as peaks from the 2M polytype (Brindley & Wardle, Reference Brindley and Wardle1970). Kogure et al. (Reference Kogure, Jige, Kameda, Yamagishi, Miyawaki and Kitagawa2006a) suggested that such uniform layer orientation in pyrophyllite originates from the surface corrugation of the dioctahedral 2:1 layer. A similarly ordered layer orientation was observed in sudoite, a chlorite with dioctahedral 2:1 layers (Kameda et al., Reference Kameda, Miyawaki, Kitagawa and Kogure2007b). On the other hand, the orientation of trioctahedral 2:1 layers in a talc specimen was heavily disordered (Kogure et al., Reference Kogure, Kameda, Matsui and Miyawaki2006b). When considering only layer orientation but not interlayer shift, corrensite with regular 1:1 interstratification of chlorite and smectite showed uniform two-layer periodicity (Kogure et al., Reference Kogure, Drits and Inoue2013a). Recently Kogure et al. (Reference Kogure, Ishii, Kikuchi, Miyuwaki and Yuguchi2017) reported that a portion of chlorite transformed from biotite in granite has an ordered layer orientation but disordered interlayer shift, which was ascribed to inheritance of the 2:1 layers from the original biotite, which was a 1M polytype.
(a) Crystal structure and simulated images of pyrophyllite-1A along three directions. (b) A HRTEM image of a pyrophyllite from Berozovska, Russia. The inset in the bottom-left is a filtered and magnified image from a portion of the back image. Notice that the orientation of each 2:1 layer is uniform, but the direction of lateral shift between adjacent layers is disordered with alternatives of ‘right’ or ‘left’ (Kogure et al., Reference Kogure, Kameda, Matsui and Miyawaki2006b).

Analyses of mixed-layer phyllosilicates
Beside analyses of the stacking sequences of a ‘pure’ mineral phase, mixed-layer phyllosilicates, which are also common clay minerals, are also suitable phases for HRTEM. Generally speaking, mixed-layer phyllosilicates may be divided into two categories: interstratification of various silicate layers (2:1 and 1:1 layers, cis- and trans-vacant 2:1 layers, etc.); and various interlayer materials or structures. An example of the former is interstratification of 2:1 and 1:1 layers, such as chlorite-serpentine. The latter are more common in phyllosilicates, especially in 2:1 phyllosilicates. In this case, the composition, layer charge and/or fine structure of the silicate layers may not be uniform, but generally HRTEM is not powerful enough to distinguish between such differences among the individual layers. HRTEM imaging for the interstratified structure of chlorite-serpentine (or berthierine) was conducted by Banfield & Bailey (Reference Banfield and Bailey1996), and later by Inoué & Kogure (Reference Inoué and Kogure2016a, Reference Inoué and Kogure2016b). In these works, the polytypic aspects of chlorite and serpentine could also be analysed owing to sufficient image resolution, which allowed the formation mechanism to be inferred. HRTEM of smectite-kaolinite interstratification was attempted by Amouric & Olives (Reference Amouric and Olives1998), but the resolution was in adequate, probably owing to the high beam sensitivity of the mineral. HRTEM investigations of 2:1 phyllosilicates containing various interlayer materials have been conducted, including of chlorite-vermiculite (Banfield & Murakami, Reference Banfield and Murakami1998), biotite-chlorite (Veblen & Ferry, Reference Veblen and Ferry1983; Eggleton & Banfield, Reference Eggleton and Banfield1985; Kogure & Banfield, Reference Kogure and Banfield2000), biotite-vermiculite (Kogure & Murakami, Reference Kogure and Murakami1996), phlogopite-aspidolite (Kogure et al., Reference Kogure, Banno and Miyawaki2004), chlorite-corrensite (Kogure et al., Reference Kogure, Drits and Inoue2013a), etc. One of the most common mixed-layer clay minerals in this type is illite-smectite, and HRTEM investigations have been conducted on these minerals, as well as XRD analysis (e.g. Peacor, Reference Peacor and Buseck1992). However, due to their high beam susceptibility and thin and bent crystallites (due to which accurate orientation setting in the transmission electron microscope is difficult), the acquired HRTEM images are not of high quality, and their interpretation (e.g. location of illite-smectite layers) is often ambiguous.
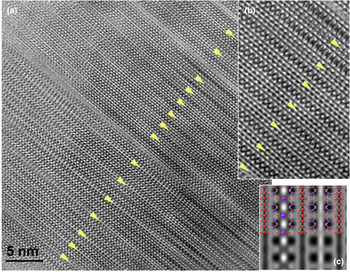
Kogure et al. (Reference Kogure, Banno and Miyawaki2004) reported HRTEM images of aspidolite (sodium phlogopite), interstratified with normal phlogopite, showing interstratification of sodium- and potassium-containing interlayer regions (Fig. 10). The two types of interlayer regions were distinguished through the contrast difference between the K and Na columns at the interlayer regions and the slight difference in basal spacing (1.01 nm for phlogopite and 0.98 nm for aspidolite). Interestingly, the two tetrahedral sheets below and above the interlayer region with sodium are slightly shifted laterally, because the ionic radius of sodium is too small compared to the space formed by the hexagonal ring of the tetrahedra in the trioctahedral 2:1 layer with its small ditrigonal rotation angle. Owing to the amount of interlayer shift estimated from HRTEM and electron diffraction, the experimental XRD pattern from aspidolite could be reproduced (Kogure et al., Reference Kogure, Banno and Miyawaki2004, Reference Kogure, Miyawaki and Banno2005). Such observation using HRTEM is also valuable for the observation of artificial ion exchange in phyllosilicates. For instance, Okumura et al. (Reference Okumura, Tamura, Fujii, Yamada and Kogure2014) reported the actual distribution of caesium in phlogopite by observing directly caesium columns in the interlayer regions. In the case of biotite-vermiculite, vermiculite-like interlayers with hydrated cations are generally collapsed by the vacuum environment in TEM, resulting in a similar basal spacing (0.95 nm) to biotite (1.01 nm). However, the vermiculite-like interlayers can be distinguished definitively through this smaller basal spacing than micas and the lack of the contrast corresponding to potassium columns at the interlayers (Fig. 11) (Kogure & Murakami, Reference Kogure and Murakami1996).
(a) Filtered HRTEM image of interstratified phlogopite-aspidolite-1M (sodium phlogopite) recorded down [100], showing interstratification of potassium-occupied (indicated with asterisks) and sodium-occupied interlayer regions. The inset at the bottom-right is a portion of the image near the top, indicating the difference of the basal spacing between the two kinds of layers. (b) Magnified image from near the centre of (a). ‘T’ and ‘O’ indicate the positions of tetrahedral and octahedral sheets, respectively. The white bars connect the dark spots in the upper and lower T sheets in each 2:1 layer. Note that the two T sheets across the sodium-occupied interlayer regions are shifted laterally (Kogure et al., Reference Kogure, Banno and Miyawaki2004).

(a) HRTEM image of interstratified biotite-vermiculite from Transvaal, South Africa, with the incident beam along an Xi direction. The interlayer regions indicated with the arrowheads originally contained hydrated cations with a basal spacing of ~1.4 nm, but they were collapsed to ~0.95 nm by vacuum during TEM. Locally regular 1:1 or 2:1 interstratification is recognized. (b) Enlarged image of a portion of the main image in (a). (c) Simulated image for a pair of potassium-occupied and vacant interlayer regions of biotite.

Recent advances in high-resolution imaging
As mentioned above, the performance of TEM for visualizing atomic structures in materials has advanced considerably since the late 1980s when the author started HRTEM analyses of phyllosilicates. In the rest of this review, several examples for the application of such ‘advanced’ electron microscope techniques will be introduced.
Scanning TEM annular dark-field imaging
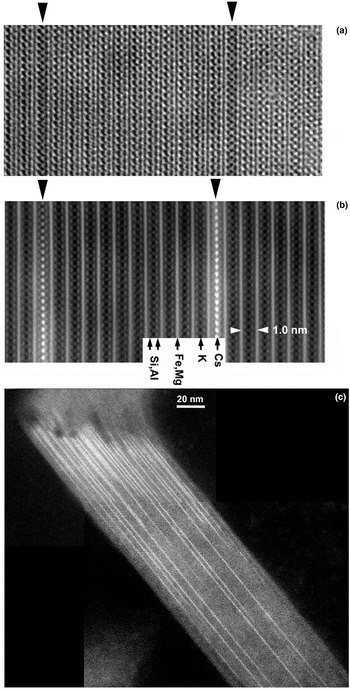
From the end of the last century, application of scanning TEM (STEM) to high-resolution imaging has expanded rapidly in the field of material sciences, mainly owing to the commercialization of a field-emission (FE) electron gun that uses a scanning probe that is far brighter than a conventional thermal-emission (TE) gun. Moreover, the invention of annular dark-field (ADF) imaging in STEM accelerated this trend. In this imaging mode, scattered electrons from the specimen are detected by a doughnut-like annular detector, and the signal from the detector forms an image, synchronizing with the scan of the beam on the specimen. The resolution of the image depends approximately on the probe size, which is determined by a compromise between the spherical aberration of the probe-forming lens (the magnetic pre-field of the objective lens is utilized for TEM/STEM shared machines) and the diffraction error, with an optimized conversion angle of the probe. The ability to resolve atomic columns in crystals using STEM-ADF is comparable to conventional TEM (CTEM) if the lens aberration and acceleration voltage are the same (Fig. 12). However, there are several advantages of STEM-ADF compared to CTEM. Firstly, the interpretation of the contrast is simple. In the case of CTEM, we need to select sufficiently thin areas in the specimen and a proper defocus value to obtain structure images from which atomic arrangements are interpretable. On the other hand, STEM-ADF is essentially incoherent imaging and so, for instance, inversion of the contrast due to focusing or specimen thickness does not occur, which makes the interpretation of the contrast very simple. The best focus is selected simply to give the sharpest contrast during observation. Figure 12 shows high-resolution images of biotite along one of the Xi directions from almost the same area using CTEM and STEM-ADF. In addition to the reversal of the contrast, the contrast of STEM-ADF is more interpretable, even for a thicker area (Fig. 12, top-right). However, the contrast is complicated and more difficult to interpret at the thicker area in the CTEM image. Another advantage of STEM-ADF is that the amount of scattered electrons at a high angle (2θ ≥ ~60 mrad at 200 kV) becomes approximately proportional to the square of the atomic number (Z 2) of the elements constituting the atomic columns. Such imaging and obtained contrasts are referred to as ‘high-angle ADF’ (HAADF) and ‘Z-contrasts’, respectively. Hence, atomic columns consisting of heavy elements are observed distinctly as bright spots in such STEM-HAADF images. The best examples for silicates are found in the publications by Okumura et al. (Reference Okumura, Tamura, Fujii, Yamada and Kogure2014) and Kikuchi et al. (Reference Kikuchi, Mukai, Kuramata and Kogure2015) (Fig. 13). The specimen in Fig. 13 is ferroan-phlogopite, in which interlayer potassium was partly exchanged with caesium by ion exchange in the laboratory. Owing to the greater atomic number of caesium than those of the other constituting elements, caesium ions at the interlayer regions are easily distinguished, and their distribution in the crystal can be distinguished even in the low-magnification image (Fig. 13c).
(Left) HRTEM and (right) STEM-HAADF images of biotite along an Xi direction, taken from almost the same region. Both images were taken using a JEOL JEM-2800F with a Schottky-type FE gun operated at 200 kV. The brightest lines in the STEM-HAADF image correspond to the O sheets in biotite, which can be traced to the thicker region at the top-right of the image. On the other hand, the contrast at the top-right in the HRTEM image cannot be matched to the structure due to the greater specimen thickness and subtle misorientation.

(a) CTEM image of ferroan-phlogopite along an Xi direction, where potassium (K) ions in the two interlayer regions (arrowheads) were substituted by caesium ions via ion exchange in the laboratory. (b) STEM-HAADF image of the same sample but in a different region, showing a distinct Z-contrast of caesium columns at the substituted interlayer regions. (c) STEM-HAADF image of the same sample taken at a low magnification. The distribution of caesium-substituted interlayer regions is clear (Okumura et al., Reference Okumura, Tamura, Fujii, Yamada and Kogure2014).

Higher-resolution imaging with a Cs corrector
As mentioned briefly above, the invention of the C s corrector has brought significant advances to resolution in electron microscopy. In oxides and phyllosilicates, the important minimum distance of cation columns is ~0.15 nm, which originates from the ionic radius of oxygen (Kogure & Okunishi, Reference Kogure and Okunishi2010). This value is easily exceeded by using a C s corrector with a normal acceleration voltage. The C s corrector is applicable to both the spherical aberration of the objective lens for CTEM imaging and that of the probe-forming lens for STEM imaging. However, owing to the advantages as described above, applications of the C s corrector for STEM imaging are more widespread than those for CTEM imaging in material sciences. Figure 14 shows a C s-corrected STEM-HAADF image of biotite with two interstratified chlorite layers, viewed along Xi using a JEOL ARM-200F operated at 200 kV. The octahedral sites, which are separated by ~0.15 nm, are well resolved in the O sheets in the biotite 2:1 layers. A pair of tetrahedra, which are also separated by ~0.15 nm, are almost resolved in the image (compared to the right-hand image in Fig. 13). Using such high-resolution imaging (exceeding 0.15 nm) and Z-contrast, Kogure & Okunishi (Reference Kogure and Okunishi2010) reported the distribution of Fe3+ in the T sheet in cronstedtite, and Kogure & Drits (Reference Kogure and Drits2010) showed site occupancies at M 1 and M 2 sites in the O sheet in celadonite, although the latter was an artefact formed due to dehydroxylation in TEM.
C s-corrected STEM-HAADF image of biotite-chlorite interstratification along an Xi direction, taken using a JEOL ARM200F with a C s corrector and cold-type FE gun operated at 200 kV. The hydroxide interlayer sheets of the chlorite layers are indicated with asterisks. The image was taken with a beam scan from the top to the bottom. Notice that the image is clearer at the beginning of the scan, probably due to there being less radiation damage.

Figure 14 shows that the proximity of the hydroxide sheet in the two chlorite layers indicated by the asterisks is smeared considerably and the atomic columns are not as visible as those in biotite layers due to degradation by radiation damage. Moreover, even in the biotite layers, the lower parts of the images are not as sharp as the upper parts; this is also due to radiation damage. Although the cause of this radiation damage is uncertain, it might be attributed to the combined effect of the increase in the specimen's temperature and beam radiation. The temperature of the lower part of the imaged region was gradually increased prior to scanning due to heat conduction from the upper part of the specimen, where the temperature was raised due to the beam scan. Hence, the specimen's temperature has a significant effect on the radiation damage to the minerals. It is interesting to discuss which of CTEM and STEM-ADF provides the greatest advantage in terms of offsetting the drawback of radiation damage, as the two techniques provide similar but not identical information. The author's opinion is that, at least in the case of clay minerals, CTEM is rather more advantageous than STEM-ADF.
Challenges of radiation damage
It is obvious that radiation damage is the greatest obstacle during HRTEM imaging of clay minerals. In general, radiation damage causes amorphization of the crystal structures. In addition, it causes preliminary dehydroxylation in dioctahedral 2:1 phyllosilicates, which had not been known of during previous studies (Kogure, Reference Kogure2007). There is no systematic research discussing radiation damage specifically for clay minerals. In the author's experience, electron-beam susceptibility is dependent on the composition and structure of minerals. Among phyllosilicates, iron-rich minerals such as biotite, chamosite and cronstedtite are far more durable in beam radiation than their isomorphic minerals with magnesium and aluminium. Among minerals with the same or similar mineral composition, for example, tubular halloysite is far more beam sensitive than kaolinite (Kogure et al., Reference Kogure, Mori, Kimura and Takai2011). In granular form, 2:1 unit layers on the surface (Kogure & Murakami, Reference Kogure and Murakami1998) or existing as stacking faults (Kogure et al., Reference Kogure, Jige, Kameda, Yamagishi, Miyawaki and Kitagawa2006a) are far more beam sensitive than the surrounding layers, suggesting that strain makes these structures less tolerant of beam radiation. In any case, due to this problem, HRTEM imaging, including STEM-ADF and the superior resolution that is achievable with a C s corrector, does not satisfy most of the requirements in clay science to date.
In order to avoid or overcome radiation damage in clay minerals, several strategies can be suggested. One is to find the optimum electron energy or acceleration voltage that minimizes this radiation damage. Previously, using a lower voltage led to worse resolution, but the inventions of the C s corrector and monochromator as electron sources have solved this problem, and sufficient resolution (~0.1 nm) is possible with ~40 kV electron sources (Bell et al., Reference Bell, Russo and Kolmykov2012). Such a low voltage reduced radiation damage to graphene but increased such damage to zeolites (Bell et al., Reference Bell, Mankin, Day and Erdman2014), and clay minerals would probably show similar results to the latter. The reason for this difference is that the origins of the damage in graphene and zeolites are mainly knock-on and radiolytic effects, respectively. According to these results, HRTEM observation of clay minerals under a voltage of >200 kV would probably offer improvements. It is impressive that a number of HRTEM images of zeolites using 400 kV and 1 MV transmission electron microscopes were reported in the last century (e.g. Terasaki et al., Reference Terasaki, Ohsuna, Alfredson, Bovin, Watanabe and Tsuno1991).
As mentioned above regarding the radiation damage in Fig. 14, increases in the specimen's temperature during TEM observation may enhance radiation damage. It follows that electron density should be reduced during observation/recording or that specimens should be cooled in the transmission electron microscope. The former approach is discussed below, and the latter suggests the use of a cold-stage specimen holder at a liquid-N2 or liquid-He temperature. The author and colleagues conducted a preliminary experiment to record HRTEM images of halloysite on a liquid-He specimen stage (Fujiyoshi et al., Reference Fujiyoshi, Mizusaki, Morikawa, Yamagishi, Aoki, Kihara and Harada1991), but without being able to demonstrate reductions in radiation damage. This may be due to the low heat conductivity of the mineral and/or carbon films supporting the particles.
Probably the most effective way to reduce radiation damage at present is to reduce the electron dose to the specimen through a series of the processes for recording HRTEM images. The imaging process in TEM includes several operations: selection of particles and/or thin areas suitable for high-resolution imaging; adjusting the exact crystal orientation using selected-area diffraction (convergent diffraction cannot be used for clays) by tilting the specimen stage; finding the optimum focusing; and exposure to a recording medium at the end of imaging. In general, minerals are continuously electron-radiated during this operation sequence and so are gradually degraded, and they are often vitrified before recording. Hence, quick operation by a skilled transmission electron microscope operator is very important to minimize the pre-dose amount before recording. On the other hand, continuous electron radiation is not absolutely required for these operations. According to this idea, a computer-assisted minimal-dose system with a high-speed beam blanker has been developed (Hayashida et al., Reference Hayashida, Nomaguchi, Kimura and Takai2007). With this system, electrons are radiated only during exposure to a camera, which can drastically decrease the electron dose received before recording the final HRTEM images. Using a transmission electron microscope with this system, Kogure et al. (Reference Kogure, Mori, Kimura and Takai2011) first recorded successfully the stacking sequence of halloysite. In this case, one could occasionally find properly oriented grains without orientation setting, which requires a greater electron dose, owing to its tubular morphology. In the future, further developments of such transmission electron microscopes and their commercialization are eagerly anticipated.
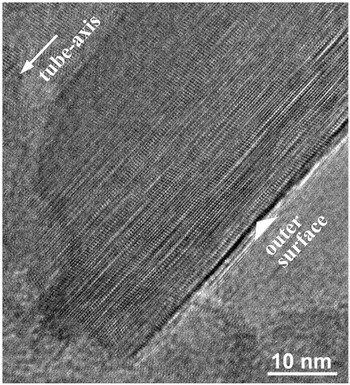
Another promising advance in the HRTEM imaging of beam-sensitive materials is the development and commercialization of high-speed or high-sensitivity cameras using complementary metal-oxide semiconductor (CMOS) technologies. The most advanced cameras with the greatest sensitivity adopt a technology that allows an individual electron entering into the camera to be detected directly as a signal by the semiconductor, not through photoelectric conversion with a scintillator (McMullan et al., Reference McMullan, Faruqi, Clare and Henderson2014). These cameras have improved significantly the resolution of single-particle cryo-TEM for the structural analysis of macromolecules. Even for conventional cameras using scintillators, CMOS technologies improved drastically the readout speed of the acquired images, and such high-speed cameras are also beneficial for HRTEM recording of beam-sensitive materials. For instance, continuous image recording of 4K × 4K images with a rate of ~25 frames per second is possible with using a recent CMOS camera (One-View Camera, Gatan, Inc.), by which HRTEM images of halloysite were successfully obtained (although they were not complete) (Fig. 15). This image was constructed through the integration of 20 acquired images in series after the image shift due to specimen drift was corrected, thereby improving the signal-to-noise ratio. Electron pre-dose was almost eliminated, as the images were continuously recorded like a ‘video’ at a sufficiently high magnification for HRTEM, and during recording, the specimen grid was moved until an appropriate halloysite particle entered the field of view.
HRTEM image of tubular halloysite from Eureka, Nevada, recorded using a Gatan One-View high-speed CMOS camera attached to a TEM (JEOL ARM200F with a C s corrector and cold-type FE gun) operated at 200 kV. The image was constructed through the integration of 20 acquired images in series after the image shift due to specimen drift was corrected for in order to improve the signal-to-noise ratio.

Although they may not be directly related to high-resolution imaging, several new technologies may be beneficial for clay sciences. Cryo-TEM, involving the embedding of fine particles in vitreous ice, should enable the observation and recording of clay minerals while avoiding dehydration or dehydroxylation. An interesting result using this technique was reported by Gilbert et al. (Reference Gilbert, Comolli, Tinnacher, Kunz and Banfield2015), who recorded swelling smectite in sodium chloride solution, showing delaminated smectite layers with an almost planar morphology without bending.
Future perspective of high-resolution imaging
As demonstrated in the above sections through a number of images, high-resolution imaging of clay minerals sheds valuable light on their atomic structures, which are poorly elucidated when using other analytical techniques, including XRD or spectroscopy. Sub-ångstrom resolutions with a C s corrector and new high-sensitivity cameras are also promising for advancing the structural analysis of clay minerals. There are still a number of unresolved or unclear matters with respect to clay structures. For instance, discrimination of cis- and trans-vacant 2:1 layers in illite or smectite is important when considering the possibility of their interstratification and/or relationship to particle size, morphology and chemical compositions, but their HRTEM imaging has not been successful due to their rapid structural alteration by dehydroxylation (Kogure, Reference Kogure2007). HRTEM imaging of kaolin-group minerals along Yi directions may also provide valuable information for this mineral group. Smectite, or smectite-illite, is one of the most abundant clay minerals, and its HRTEM imaging while avoiding radiation damage using these new technologies, like that of other minerals presented in this paper, is eagerly anticipated. However, at least in the author's opinion, studies of clay minerals at the atomic scale with TEM/STEM are not as common as might be expected, despite their importance. There are several reasons for this situation. For instance, long and diligent training as well as sufficient knowledge of electron microscopy and crystallography are necessary to become a skilful operator of these technologies and to obtain meaningful results while overcoming radiation damage. On the other hand, recent high-specification transmission electron microscopes with various functions are too expensive to install in any single laboratory unit, and they tend to be the common property of a faculty or university, which limits the machine-time necessary to train skilful electron microscopists. However, we must overcome such challenges and encourage young clay scientists to achieve understanding of the true structures of the clay minerals, whose importance will only increase in the future as the most intimate inorganic materials known to humankind.
Acknowledgements
I thank Stephen Hillier and two anonymous reviewers for their valuable comments and suggestions to improve this manuscript. Simon Kemp, Clay Minerals Group chairman, kindly hosted me during my George Brown of Lecture 2019. With respect to my research for clay mineralogy over a quarter of a century, I am grateful to the many mineralogists who collaborated with me. In particular, Jillian Banfield and Takashi Murakami guided me towards this scientific field at the beginning of my research. I learned a lot from Massimo Nespolo with respect to the structure of micas. Stephen Guggenheim assisted me numerous times in the preparation of manuscripts and gave valuable comments on them. I also thank a number of the students and post-doctoral researchers who collaborated with me in my laboratory. Finally, since we met in 2005, Victor Drits has always encouraged and supported my research – to him, I would like to express my deepest thanks.