





1. Introduction
Ancient Roman mortars, particularly pozzolana-based ones, have been extensively studied in the literature to explore their raw materials composition and production technologies (Jackson et al. Reference Jackson, Marra, Deocampo, Vella, Kosso and Hay2007; Marra et al. Reference Marra, Deocampo, Jackson and Ventura2011; Miriello et al. Reference Miriello, Bloise, Crisci, De Luca, De Nigris, Martellone, Osanna, Pace, Pecci and Ruggieri2018; Izzo et al. Reference Izzo, Arizzi, Cappelletti, Cultrone, De Bonis, Germinario, Graziano, Grifa, Guarino, Mercurio, Morra and Langella2016; Rispoli et al. Reference Rispoli, De Bonis, Guarino, Graziano, Di Benedetto and Esposito2019; Secco et al. Reference Secco, Previato, Addis, Zago, Kamsteeg, Dilaria, Canovaro, Artioli and Bonetto2019). Research on pozzolana mortars has also focused on evaluating their properties—such as long-term structural resilience, and durability as building materials—while examining the role of newly formed reactive alumino-silicates and their hydraulic properties (Jackson et al. Reference Jackson, Chae, Mulcahy, Meral, Taylor, Li, Emwas, Moon, Yoon, Vola, Wenk and Monteiro2013, Reference Jackson, Mulcahy, Chen, Li, Li, Cappelletti and Wenk2017; Rispoli et al. Reference Rispoli, De Bonis and Esposito2020).
Radiocarbon measurements on pozzolana mortars have been performed since the 1960s, yielding results that are challenging to interpret. Their hydraulic behaviour and compositional complexity have never been analyzed, and the application of preliminary characterization was not so widespread. In particular, only one published application of 14C dating to pozzolana mortars from Pompeii is currently available, conducted by one of the pioneering laboratories in this field, led by Åsa Ringbom, Alf Lindroos, and Jan Heinemeier. However, the results were affected by significant uncertainties, highlighting the challenges of dating this type of mortar due to several critical aspects (Lindroos et al. Reference Lindroos, Heinemeier, Ringbom, Brock, Sonck-Koota, Pehkonen and Suksi2011). Similar difficulties have been observed in other studies on pozzolana mortars dating, resulting in contradictory findings and limitations in the reliability of the method (Lindroos et al. Reference Lindroos, Heinemeier, Ringbom, Brock, Sonck-Koota, Pehkonen and Suksi2011; Michalska and Mrozek-Wysocka Reference Michalska and Mrozek-Wysocka2020; Nonni et al. Reference Nonni, Marzaioli, Mignardi, Passariello, Capano and Terrasi2018).
Pozzolana mortars contain limited amounts of datable carbonate, as they may experience reduced, limited, or hindered carbonation. Their complex composition makes them chemically active over time, continuously forming new carbonates and hydraulic phases (Rispoli et al. Reference Rispoli, De Bonis, Guarino, Graziano, Di Benedetto and Esposito2019; Sabbioni et al. Reference Sabbioni, Zappia, Riontino, Blanco-Varela, Aguilera and Puertas2001; Seymour et al. Reference Seymour, Maragh, Sabatini, Di Tommaso, Weaver and Masic2023; Veiga et al. Reference Veiga, Velosa and Magalhaes2009). On the other hand, pozzolana mortars set and harden by formation of hydrate calcium silicates and calcium aluminates and by carbonation of calcium hydroxide. So, this process is partially due to the incorporation of CO2, leading to the formation of so-called anthropogenic CaCO3. This calcite represents a datable fraction that, in theory, corresponds to the time of construction of the masonry. Therefore, it is essential to identify and isolate this component from other carbon sources, such as geogenic calcite containing dead carbon.
The present paper evaluates the feasibility of 14C dating for pozzolana mortars by applying our previously published strategy for selecting suitable mortar samples containing anthropogenic calcite in binders or lumps (Calandra et al. Reference Calandra, Cantisani, Conti, Salvadori, Barone, Liccioli, Fedi, Salvatici, Arrighetti, Fratini and Garzonio2024).
Such procedure follows a four-step workflow: (I) archaeological and historical survey with focused sampling; (II) mineralogical, petrographic, and chemical characterization to identify the main features of the mortar (for instance, the state of carbonation, the degree of possible hydraulicity and so forth); (III) non-destructive analyses to identify the origin of calcite on those samples that passed the step II; (IV) micro-sample preparation and 14C-AMS measurement.
The key innovation is step III, which employs non-destructive techniques (OM-CL, ATR-FTIR, micro-Raman, XRPD) to distinguish anthropogenic calcite from geogenic carbonates. The same material characterized during step III is then used directly for radiocarbon dating, minimizing the possible mismatch that may occur between characterised materials and the radiocarbon processed samples in matrices which are so heterogeneous.
Small samples are then treated for the 14C-AMS measurement using our micro-graphitization system (the so-called Lilliput reactors) in order to target either a possible individual lime lump or a selected binder-rich fraction.
In this paper, we applied our methodology to investigate the feasibility of dating mortars from different construction phases of the Pompeii Forum by radiocarbon. Particular attention was given to the phases before and after the well-documented and dated severe earthquake of 62/63 CE (Dobbins Reference Dobbins1994), which preceded the destruction of the city by the eruption of 79 CE.
The study demonstrates that only a structured, multi-step analytical approach can produce a robust framework for mortar radiocarbon dating, especially when studying with complex mortars such as hydraulic or pozzolanic types.
2. Materials and methods
2.1 Analysis of masonry and sampling (step I)
Following the workflow proposed in Calandra et al. (Reference Calandra, Cantisani, Conti, Salvadori, Barone, Liccioli, Fedi, Salvatici, Arrighetti, Fratini and Garzonio2024), prior to sampling, an in-depth study and a catalogue of masonry stratigraphic units (SU) were carried out in order to assign each SU to a specific construction phase of the public monuments of the Forum. This step was based on the analysis of masonry to identify the construction phases of each monument combined with in-depth study of previous research to distinguish ancient restorations from modern repairs (archaeological-architectural investigation of the Forum of Pompeii is reported in Figure S1 and Text S1).
The samples were taken from several public buildings in Pompeii, belonging to three main construction phases: the Samnite period (2nd century BCE), the early imperial period (before 62/63 CE, in particular first decades of the 1st century CE) and the reconstruction phase after the earthquake of 62/63 CE (post 62/63 CE) (Casa Reference Casa2025). Samples were taken with chisel and hammer, ensuring the removal of the first few centimetres of the mortar from the surface, which is often friable and powdery, to prevent contamination.
One or more fragments of bedding mortars were sampled, depending on the construction phases documented for each building. The public buildings examined are listed below with the respective number of samples and identification codes: Basilica (1, BA), Temple of Apollo (5, TA), Temple of Jupiter (2, TJ), Macellum (10), Eumachia building (11, EU), Temple of the Genius Augusti (2, GA), Temple of Fortuna Augusta (4, FA), Triangular Forum (1, TF), Theatre (2, TH), Odeion (1, OD), Temple of Isis (1, TI), Sanctuary of the Public Lares (6, LP), Municipal Building (5, Tabularium TA, Curia CU, Duoviri DB), Arch of Germanicus (2, AG) (see Franceschini et al. Reference Franceschini, Casa, Calandra, Ismaelli, Grifa, Mercurio, Amoretti, Zuchtriegel and Cantisani2024 for full details of individual samples).
2.2 Characterization procedure for mortar radiocarbon dating (step II)
Following the step II proposed in Calandra et al. (Reference Calandra, Cantisani, Conti, Salvadori, Barone, Liccioli, Fedi, Salvatici, Arrighetti, Fratini and Garzonio2024), a complete minero-petrographic and geochemical characterization of all sampled mortars (53 samples) was carried out to identify samples that were likely not to be contaminated. A multi-analytical characterization procedure for the mortar fragments provides the following: i) an initial examination involving macroscopic observation and the phenolphthalein test to assess the state of conservation and the degree of carbonation of the mortar. ii) further analyses including optical and electron microscopy (OM and SEM–EDS), X-ray diffraction on powders (XRPD) and thermogravimetric analysis (TGA).
Thin sections were observed and analyzed using a polarised optical microscope (OM) in combination with digital image analysis (DIA) to determine the composition and micromorphology of binders and aggregates. The combination with SEM-EDS enables the identification of both the origin of the aggregates and the origin of the limestone used to produce the binder (Cantisani et al. Reference Cantisani, Fratini and Pecchioni2022). By combining microchemical SEM-EDS analyses on thin sections with TGA analyses on powders from binder-rich fractions and reaction rims or lumps—which differ from the surrounding binder matrix and are discrete components within the mortar—an evaluation of the hydraulicity index was obtained (Calandra et al. Reference Calandra, Salvatici, Centauro, Cantisani and Garzonio2022; Rispoli et al. Reference Rispoli, De Bonis, Guarino, Graziano, Di Benedetto and Esposito2019). The hydraulicity index (HI) was determined using the Boynton formula (Boynton Reference Boynton1980).
2.3 Non-destructive analytical approach for the characterization of binder fractions (step III)
Once the binder-rich fractions were selected from the samples suitable for radiocarbon dating, mechanical separation of binder-rich bulk and lumps was performed, starting with selection under a stereomicroscope. For bulk samples, a portion enriched with binder was obtained by lightly crushing and sieving to 63 µm; for lumps, the material was separated and then sieved. The two separated fractions, when present, were submitted to the following characterization to check their feasibility for radiocarbon measurement. They were further characterized by combining XRPD, SEM-EDS, OM-CL, ATR-FTIR and micro-Raman spectroscopy. All the applied analytical techniques are non-destructive and after characterization the same powder from each of the studied samples is recollected and treated for the radiocarbon measurements. XRPD and SEM-EDS allow the identification of mineralogical phases and chemical analyses of powders. In addition, we used OM-CL as a preliminary screening to determine the origin of the calcite based on the color of the powders (Ricci et al. Reference Ricci, Secco, Addis, Pistilli, Preto, Brogiolo, Arnau, Marzaioli, Passariello, Terrasi and Artioli2022; Toffolo et al. Reference Toffolo, Ricci, Chapoulie, Caneve and Kaplan-Ashiri2020). We then applied ATR-FTIR and micro-Raman spectroscopy to the same powders using reference trends for geogenic and anthropogenic calcite, as published in Calandra et al. (Reference Calandra, Salvatici, Centauro, Cantisani and Garzonio2022). The latter technique was investigated to assess the crystallinity (Toffolo et al. Reference Toffolo, Pinkas, Gallo and Boaretto2023) and the origin of calcite (Calandra et al. Reference Calandra, Conti, Centauro and Cantisani2023) in pure calcium carbonate samples.
The operating conditions of the techniques used for steps II and III in our multi-analytical procedure for mortar radiocarbon dating, developed in Calandra et al. (Reference Calandra, Cantisani, Conti, Salvadori, Barone, Liccioli, Fedi, Salvatici, Arrighetti, Fratini and Garzonio2024), are briefly summarized in the supplementary materials (Table S1).
2.4 Micro-sample preparation for mortar radiocarbon measurements (step IV)
Carbon to be converted to solid graphite for the radiocarbon measurement is extracted from the powders selected thanks to the aforementioned step III. The set-up consisted of an acidification reactor, integrated with the so-called Lilliput graphitization line installed at INFN-LABEC in Florence (Cantisani et al. Reference Cantisani, Calandra, Barone, Caciagli, Fedi, Garzonio, Liccioli, Salvadori, Salvatici and Vettori2021; Fedi et al. Reference Fedi, Barone, Barile, Liccioli, Manetti and Schiavulli2020). The Lilliput line is optimized to graphitize samples of about 50 micrograms of carbon, corresponding to about 100 mbar of CO2 collected after either combustion (in case of an organic material) or acid digestion (in case of carbonate samples). Acidification is achieved in vacuum by injecting into the reactor H3PO4 through a PTFE/silicone membrane. When treating binder-rich bulks, two evolving CO2 fractions are usually collected per sample: the first collected for the first 10/30 seconds and the second following (10/30–60 seconds). For lumps, CO2 is collected from the first seconds of the reaction (0–10 seconds). In both cases, collection times are chosen in order to accumulate up to about 100 mbar of carbon dioxide. For graphitization, the well-known Bosch reaction, performed on previously pressed iron catalyst, is exploited. AMS measurements were performed using the INFN-LABEC 3 MV tandem electrostatic accelerator (Fedi et al. Reference Fedi, Cartocci, Manetti, Taccetti and Mando2007). Calibration of the measured radiocarbon ages was performed using the OxCal v.4.4.4 software (Bronk Ramsey and Lee Reference Bronk Ramsey and Lee2013; Bronk Ramsey Reference Bronk Ramsey2009), with IntCal20 calibration curve as reference (Reimer et al. Reference Reimer, Austin, Bard, Bayliss, Blackwell, Bronk Ramsey, Butzin, Cheng, Edwards, Friedrich, Grootes, Guilderson, Hajdas, Heaton, Hogg, Hughen, Kromer, Manning, Muscheler, Palmer, Pearson, van der Plicht, Reimer, Richards, Scott, Southon, Turney, Wacker, Adolphi, Büntgen, Capano, Fahrni, Fogtmann-Schulz, Friedrich, Köhler, Kudsk, Miyake, Olsen, Reinig, Sakamoto, Sookdeo and Talamo2020).
3. Results and discussion
3.1 Selected mortar samples after steps I–II
The results of the mineralogical-petrographic and geochemical characterization of all samples were published in the paper Franceschini et al. (Reference Franceschini, Casa, Calandra, Ismaelli, Grifa, Mercurio, Amoretti, Zuchtriegel and Cantisani2024). The main results are summarized below, and the selection/exclusion criteria for the subsequent steps are discussed.
All analyzed Pompeian bedding mortars were made by mixing air lime with pozzolan material and other volcanic rock fragments (pyroclastic products and crystals of magmatic origin) as aggregates.
A feebly hydraulic lime mortar is so developed due to the reaction between lime and pozzolan material. The texture of the binder, as well as the composition, granulometry and shape of the aggregates, shows a high degree of variability. Based on these compositional and textural features, the samples were grouped according to their mortar characteristics. These groups were then compared to the archaeological phases, revealing a clear correspondence between mortar composition and historical phases (Franceschini et al. Reference Franceschini, Casa, Calandra, Ismaelli, Grifa, Mercurio, Amoretti, Zuchtriegel and Cantisani2024).
48 of the 53 analyzed samples were excluded for 14C dating based on results of the complete minero-petrographic and geochemical characterization. In particular, we excluded:
-
• samples with moderate hydraulicity, HI> 0.50 (Arizzi and Cultrone Reference Arizzi and Cultrone2021);
-
• samples with microsparitic binder texture due to the presence of secondary calcite;
-
• samples with high amount of carbonate aggregates;
-
• samples with a high amount of lumps due to relics of stone used in lime production;
-
• samples with insufficient mass or outlier features.
Some features observed in minero-petrographic analysis are shown in Supplementary Figure S2.
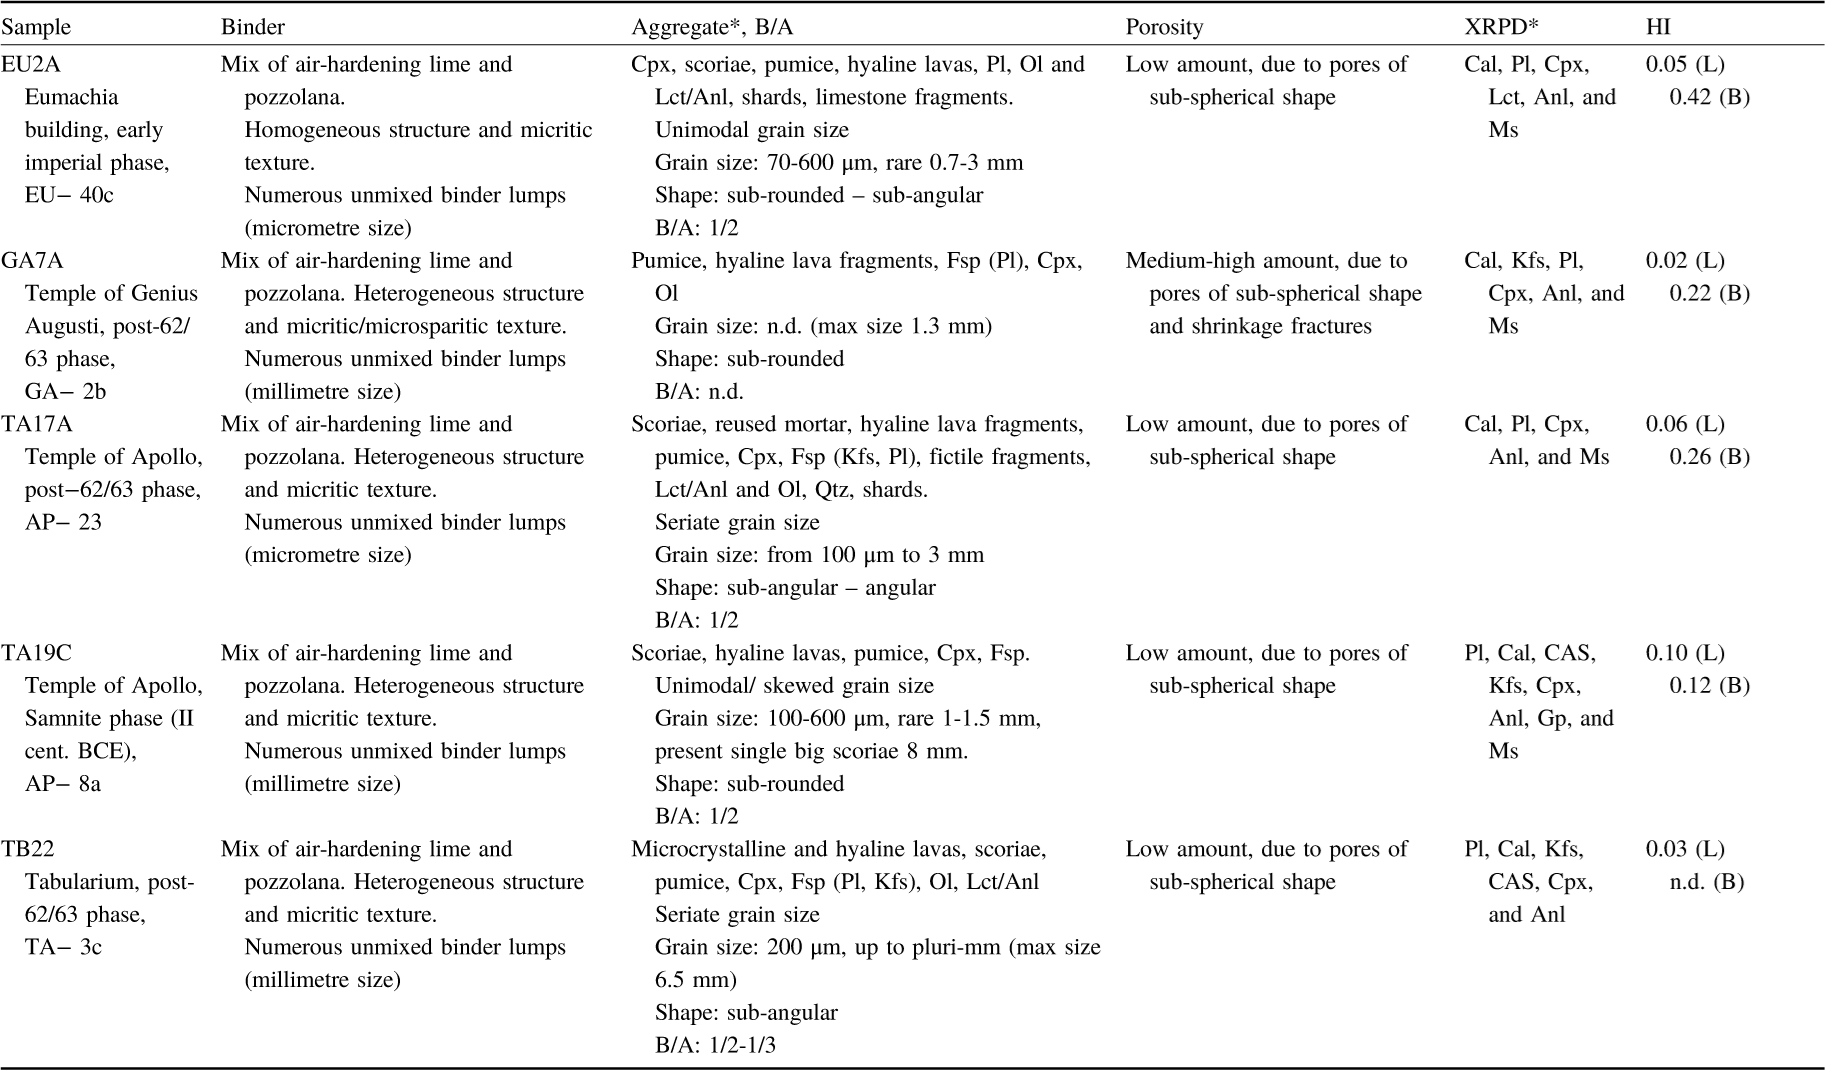
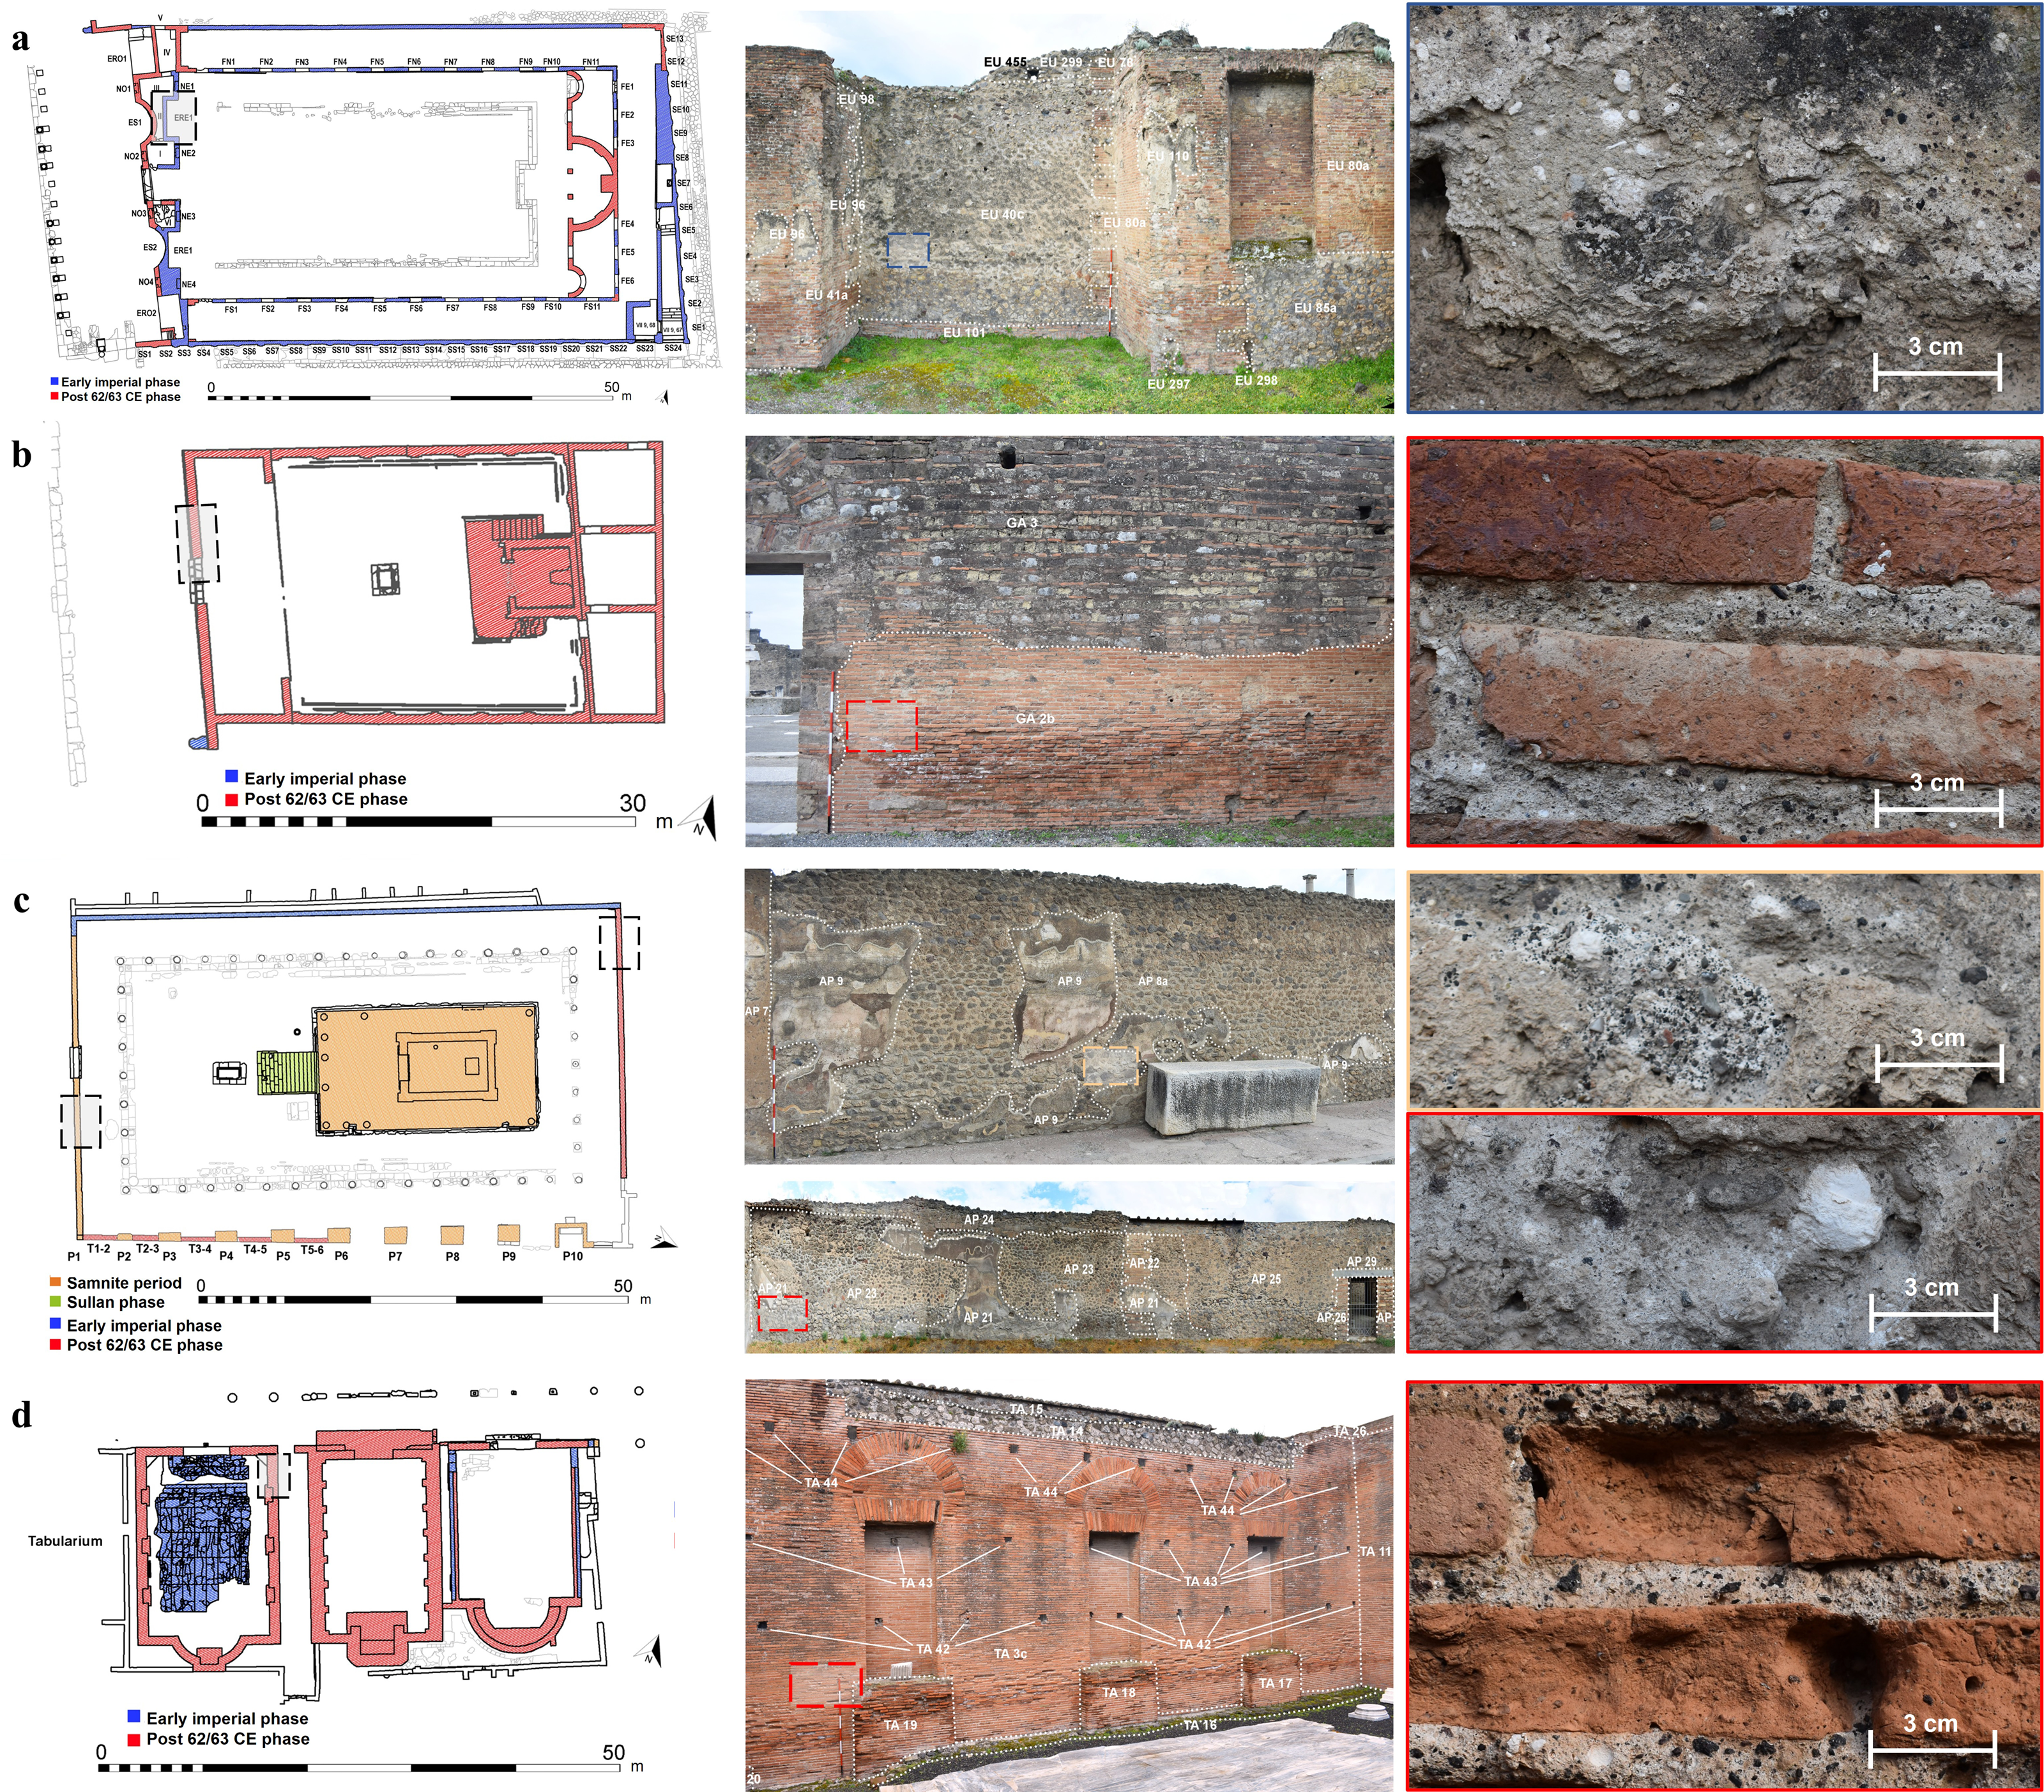
The main mineralogical, petrographic and geochemical characteristics of the samples selected for the application of radiocarbon dating are instead reported in Table 1. They were collected from the Eumachia building (EU), the Temple of Genius Augusti (GA), the Tabularium (TB) and the Temple of Apollo (TA) (Figure 1).
Characterization summary of the selected mortars from Pompeii (ID sample: ID sample, public building, construction phases, SU; binder and lumps, composition of the aggregates in order of abundance, size and shape of the clasts, B/A = binder/aggregate ratio, microporosity, XRPD results and HI= hydraulicity index).

Table 1. Long description
The table presents a detailed characterization summary of selected mortar samples from Pompeii, identified by sample ID, public building, construction phases, and stratigraphic unit. It includes information on the binder types, such as mixes of air-hardening lime and pozzolana, and the composition of aggregates in order of abundance. The table also specifies the size and shape of clasts, the binder-to-aggregate ratio, microporosity, X-ray powder diffraction results, and the hydraulicity index. Samples are from the Eumachia building, the Temple of Genius Augusti, the Tabularium, and the Temple of Apollo. Each row provides specific details for different samples, highlighting variations in composition and properties.
*Composition in order of abundance. Anl = analcime; Bt = biotite; Cpx = clinopyroxene; Fsp = feldspars; Grt = garnet; Lct = leucite; Kfs = K-feldspars; Ol = Olivine; Cal: calcite; Pl = plagioclase; Qtz = quartz; Ms: mica; CAS: calcium aluminate silicate crystalline phase; Gp: gypsum. (L): lump and (B): binder.
Archaeological and architectural investigations and location of dated mortar samples: a) the Building of Eumachia (EU), b) the Temple of the Genius Augusti (GA), c) the Temple of Apollo (AP), and d) the Tabularium (TB). For each building is reported: the plan with construction; elevations of selected walls with the locations of sampled areas, and the masonry stratigraphy (SU); and detailed view of the sampling point.

Figure 1. Long description
The collage consists of four distinct sections, each focusing on a different ancient Roman building. The first section (a) features the Building of Eumachia, displaying a plan with construction phases, an elevation of selected walls with sampled areas, and a detailed view of the sampling point. The second section (b) showcases the Temple of the Genius Augusti, including a plan, wall elevations with sample locations, and masonry stratigraphy. The third section (c) presents the Temple of Apollo, with similar details such as the plan, wall elevations, and sampling points. The fourth section (d) illustrates the Tabularium, again with a plan, wall elevations, and detailed views of the sampling points. Each section highlights the architectural investigations and the specific locations where mortar samples were taken for analysis.
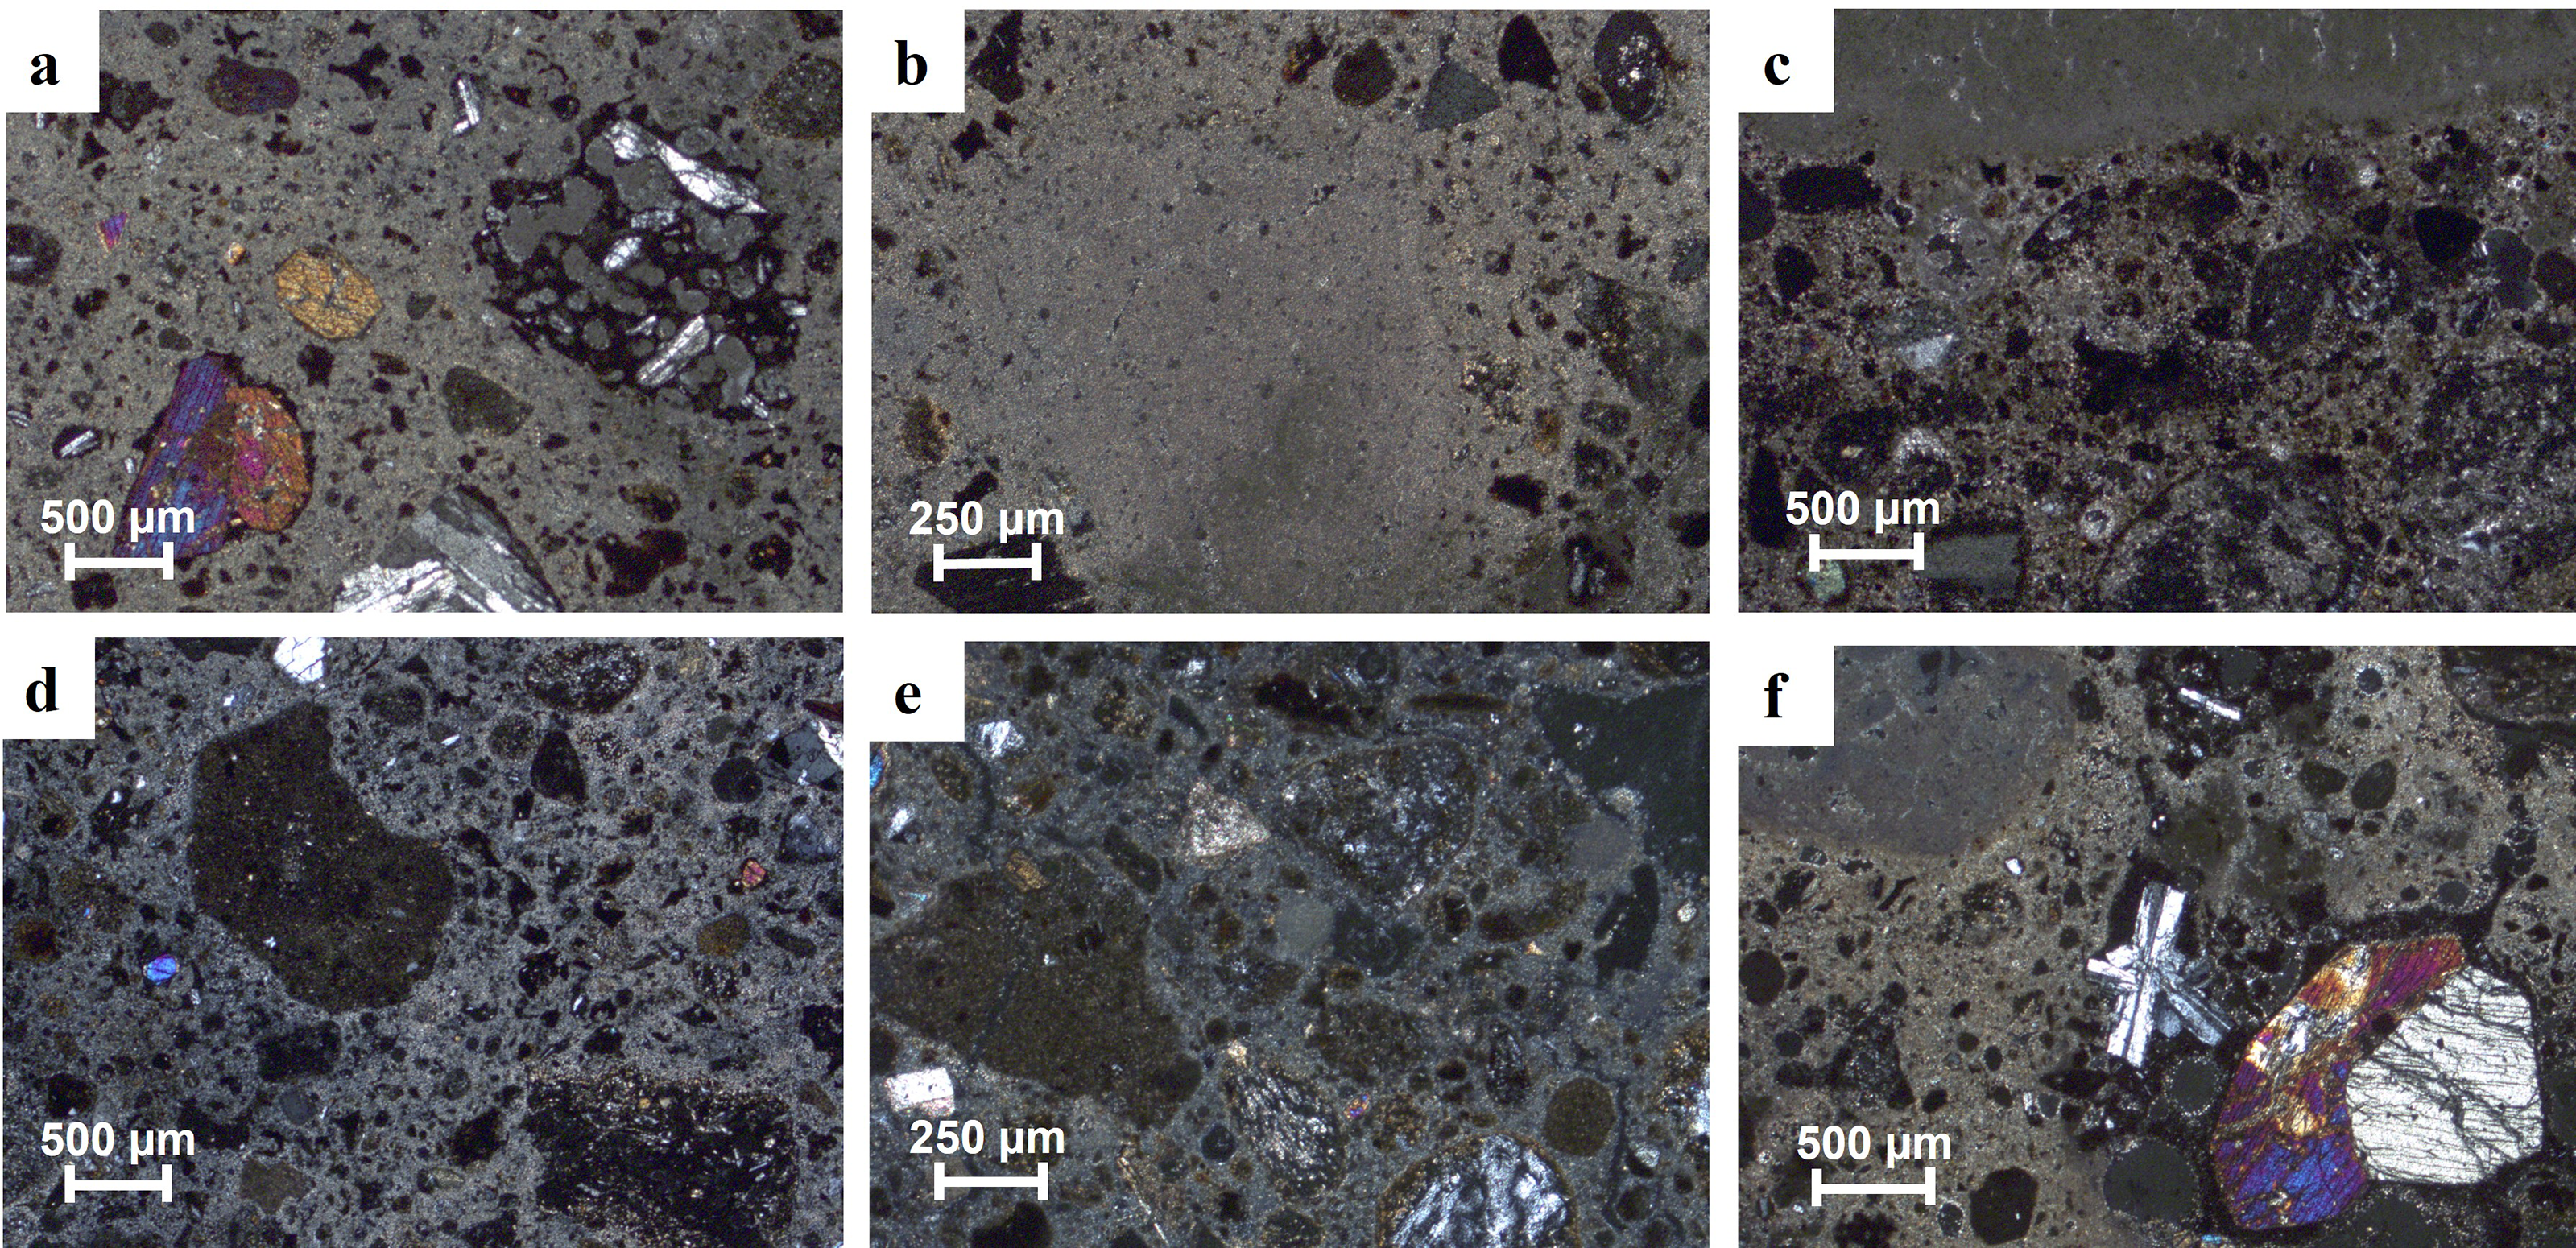
EU02A, GA07A, TA17A, TA19C, TB22 samples were selected for further investigation, due to homogeneous structure, micritic binder texture and numerous lumps identified as lime lumps (unmixed binder) and a low amount of carbonate rock fragments in the aggregate (Figure 2). The phenolphthalein test of these samples indicates complete carbonation.
Microphotographs of mortar samples: EU02A: a,b), GA07A: c), TA17A: d), TA19C: e), TB22: f) (image under OM, xpl, at different magnification).

Figure 2. Long description
The image displays microscopic views of ancient Roman mortar samples under polarized light at varying magnifications. Sample EU02A is shown in images a and b, GA07A in image c, TA17A in image d, TA19C in image e, and TB22 in image f. Each sample exhibits distinct textures and compositions, with visible crystalline structures and varying grain sizes. The images highlight the intricate details of the mortarʼs microstructure, revealing the presence of different minerals and the effects of long-term structural resilience and durability.
As evidenced from XRPD analysis of bulk samples, calcite is the main phase in the binder fraction and/or is present as carbonate rock fragments (micritic limestone and single calcite crystals). K-feldspar, plagioclase, quartz, clinopyroxene, leucite, analcime and micas were associated with the aggregate composition. Furthermore, where present, the lumps were analyzed. The main mineralogical phase is calcite, with traces of other minerals such as quartz.
The analysis of the binder by SEM-EDS (Table 1) and TGA (Supplementary Figure S3) confirms the weakly hydraulic nature of the mortars, highlighting the pozzolanic reaction between an air lime binder and volcanic material. Very low HI values (0.02–0.10) were measured in the lime lumps. Higher HI values (0.12–0.42) were obtained for the binder matrix and for the reaction rims at the binder–aggregate interface, reflecting the development of hydraulic reactions in the mortar binder portions. SEM-EDS analysis of lumps referred to underburned stone suggests that a heterogeneous limestone with low Mg content was used as raw material for lime production. Morphological and chemical analyses of some lumps revealed a heterogeneous structure, consisting of areas with pure calcite and Mg-rich portions.
This heterogeneity can be related to the different thermal behaviour of Mg- and Ca-carbonates during calcination, as MgCO₃ decomposes at lower temperatures than CaCO₃, leading to an early segregation of Mg- and Ca-rich phases that can persist through slaking and carbonation. This effect may be enhanced by the use of compositionally heterogeneous limestone and by uneven temperature distribution in the kiln. Variations in Mg content (1–4%, as average) were observed in the binder matrix, with the most Mg-rich fractions containing even over 10% Mg.
After step II, we rejected most of the samples, demonstrating that this step is crucial for selecting those most suitable for the subsequent steps. However, in the specific case of mortars from Pompeii, special attention must be given to the selection of powders and their characterization in step III, as these samples still exhibit weak hydraulicity, contain numerous lumps and have a heterogeneous binder composition due to traces of Mg.
3.2 Results of non-destructive characterization in step III
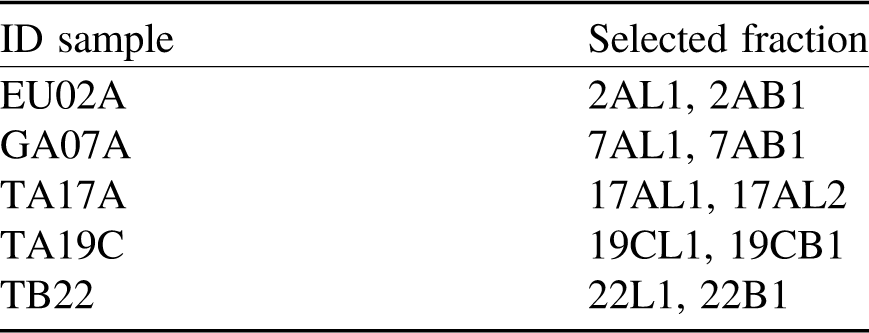
From each of the selected samples (EU02A, GA07A, TA17A, TA19C, TB22) (Table 2), lump and binder-rich bulk fractions, labelled L and B, respectively, were obtained.
Selected powder samples from Pompeii.

Table 2. Long description
The table presents selected powder samples from Pompeii, identified by unique codes such as EU02A, GA07A, TA17A, TA19C, and TB22. Each sample is associated with specific fractions, such as 2AL1 and 2AB1 for EU02A, 7AL1 and 7AB1 for GA07A, 17AL1 and 17AL2 for TA17A, 19CL1 and 19CB1 for TA19C, and 22L1 and 22B1 for TB22. The table consists of two columns: one for the ID sample and another for the selected fraction. This structured format helps in identifying and categorizing the different fractions obtained from each sample.
All powder fractions were fully characterized by XRPD, OM-CL and ATR-FTIR, and the obtained results are shown in Figure 3 and Supplementary Table S2. From the XRPD results (Table S2), all samples contain predominantly calcite, along with calcium silicate (CS), due to not fully hydrated phases in the hydraulic limes. 2AB1, 22B1, 7AB1 and 19CB1 also contain traces of feldspar, due to contamination from aggregates. In 22B1, the presence of hydrated phases of calcium aluminate silicate (CASH, especially gismondine) is revealed. For this reason, this sample was excluded from the further investigations of step III.
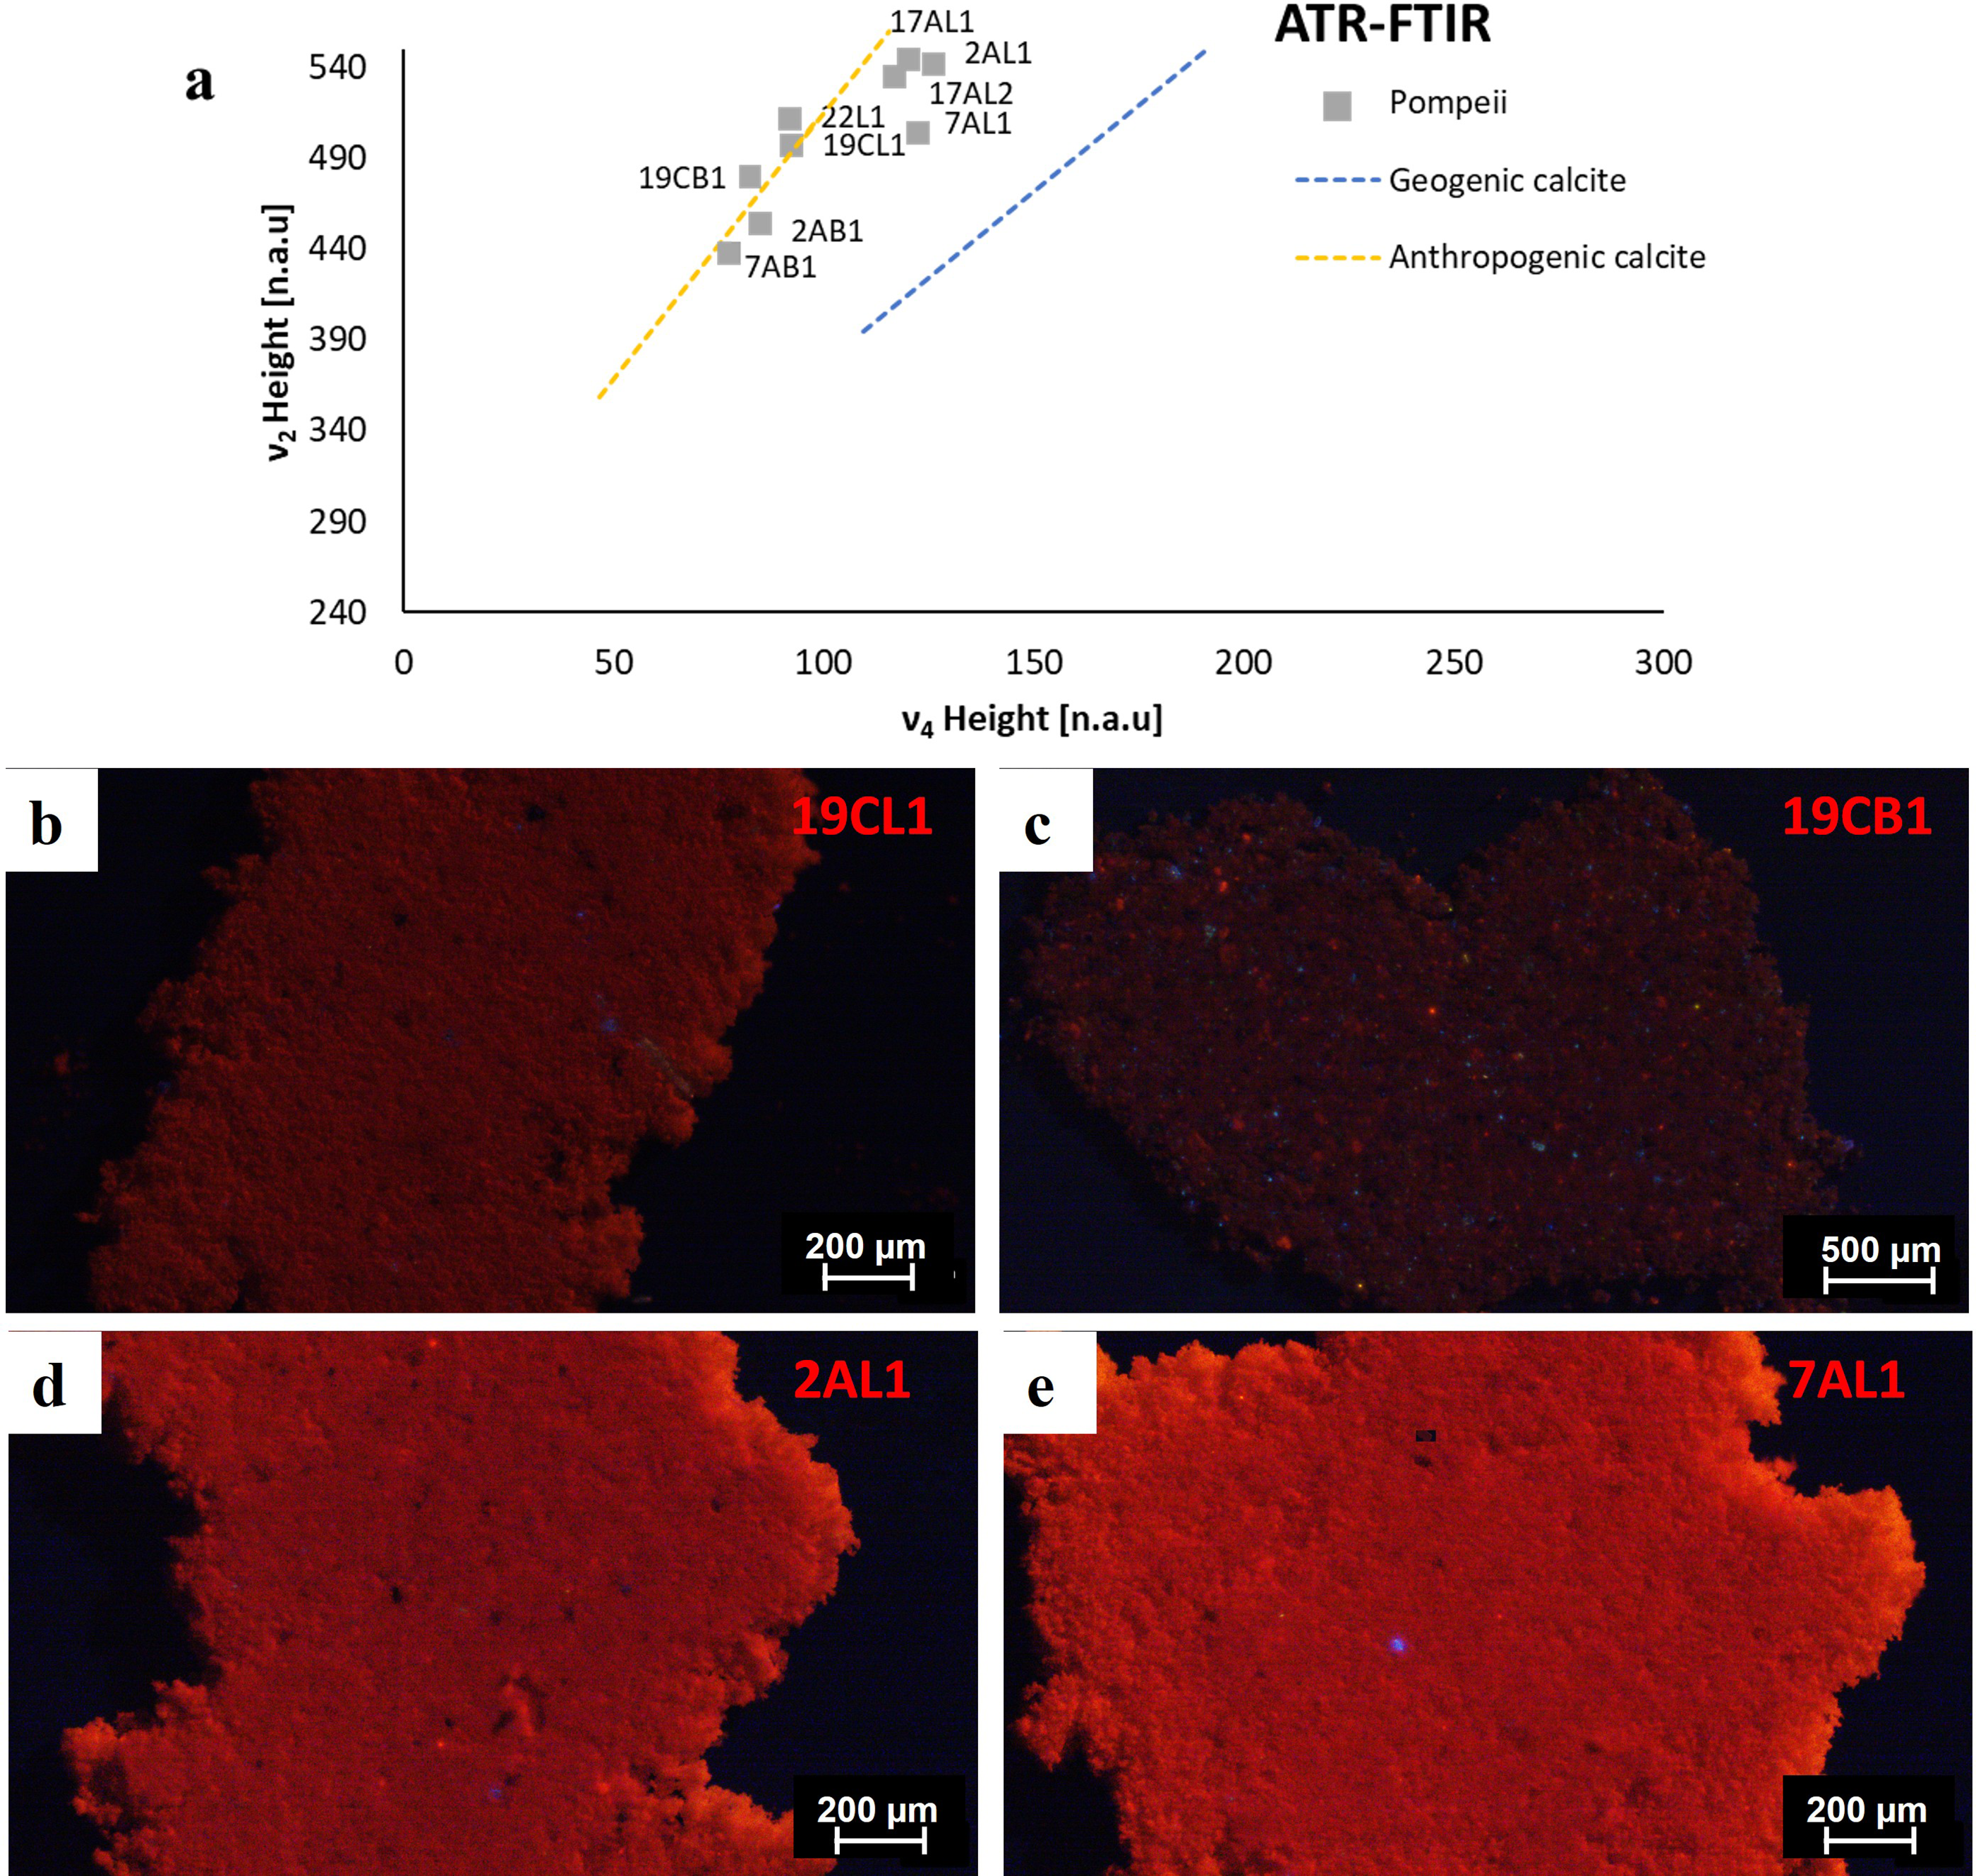
Results of non-destructive techniques on powders. a) Plot of ν 2 and ν 4 with typical trend lines of geogenic and anthropogenic calcites obtained by ATR-FTIR; b-e) OM-CL photomicrographs of lump and bulk powders: hues compatible with anthropogenic (b,c) and geogenic samples (d,e).

Figure 3. Long description
The image contains a combination of a scatter plot and photomicrographs. The scatter plot (a) displays the relationship between ν2 and ν4 heights, with trend lines indicating geogenic and anthropogenic calcites obtained by ATR-FTIR. The plot includes data points labeled with various sample identifiers such as 17AL1, 2AL1, 22L1, and 19CL1. The photomicrographs (b-e) show optical microscopy with cathodoluminescence (OM-CL) images of lump and bulk powders. Images (b) and (c) depict hues compatible with anthropogenic samples, while images (d) and (e) show hues compatible with geogenic samples. Each photomicrograph is labeled with specific sample identifiers and includes scale bars for reference.
The colours of 2AB1, 7AB1, 19CB1 and 22L1 powders in OM-CL are predominantly red-tile brown (Figure 3b,c), with brighter small grains (orange) and aggregate remnants (blue), while 2AL1, 7AL1, 17AL1 and 17AL2 powders are bright orange hues (Figure 3d,e). OM-CL analysis allows evaluation of the origin of carbonates and associated minerals: red-tile brown hues indicate the anthropogenic calcite, brighter orange hues correspond to geogenic calcite, and blue hues indicate feldspar grains.
ATR-FTIR results confirm that samples 2AB1, 7AB1, 19CL1, 19CB1 and 22L1 are within the trend of anthropogenic calcite. Samples 2AL1, 7AL1, 17AL1 and 17AL2 lie between the two trends, thus the identification of their origin just on only ATR-FTIR is not so straightforward. On the other hand, as mentioned above, OM-CL analysis indicates the geogenic origin of these lumps. Considering these results, it is essential to conduct further analysis on powder fractions.
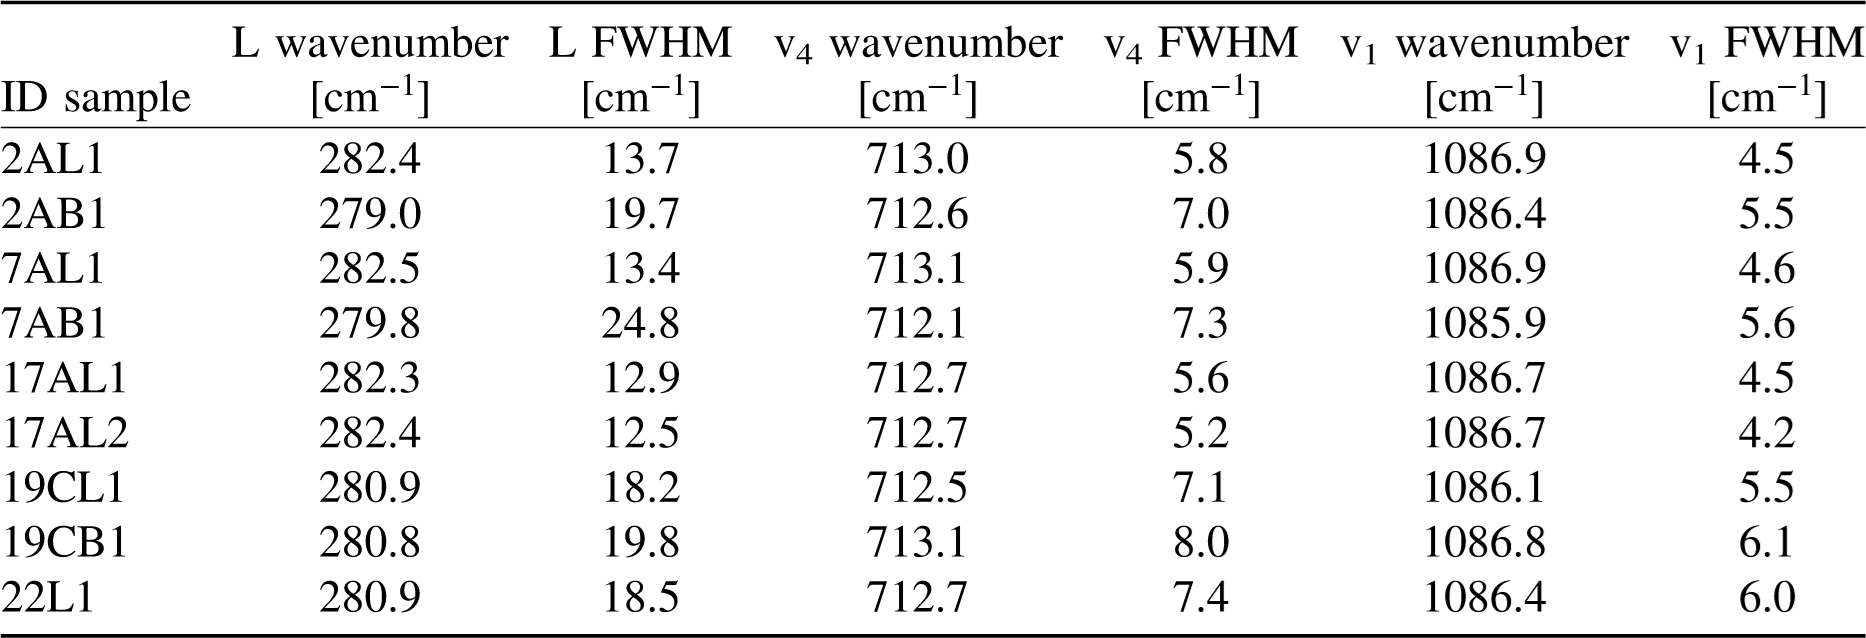
The samples were thus also analyzed applying micro-Raman and SEM-EDS. Table 3 shows the L, v4, and v1 wavenumbers and their respective FWHM values.
Raman results of calcite lumps and bulk of Pompeii: the average of the wavenumbers, FWHMs of L, v1, v4 from 10 Raman measurements performed for each sample.

Table 3. Long description
The table presents Raman results of calcite lumps and bulk of Pompeii, detailing the average wavenumbers and full width at half maximum (FWHM) values for L, v1, and v4 from 10 Raman measurements per sample. The table includes data for eight different samples, identified by their ID. Each row lists the L wavenumber in inverse centimeters, the L FWHM in inverse centimeters, the v4 wavenumber in inverse centimeters, the v4 FWHM in inverse centimeters, the v1 wavenumber in inverse centimeters, and the v1 FWHM in inverse centimeters. Notable trends include variations in wavenumbers and FWHMs across different samples, reflecting differences in the calcite structure and composition.
The SEM-EDS reveals the presence of Mg in lumps. When Mg is detected, a shift in the Raman band is usually observed. Specifically, the L band shifts from 281 cm−1 in carbonates without Mg to 286 cm−1 with 15% Mg, due to the reduction of interatomic distances resulting from the substitution of Ca2+ by the smaller Mg2+ ion. The Raman bands positions are therefore directly related to the amount of magnesium present in the calcite structure (Bischoff et al. Reference Bischoff, Sharma and MacKenzie1985; Borromeo et al. Reference Borromeo, Zimmermann, Andò, Coletti, Bersani, Basso, Paolo Gentile, Schulz and Garzanti2017). Lump samples consistently show L wavenumbers above 281 cm−1, indicating the possible presence of magnesian calcite, supported by v4 and v1 wavenumbers tending to be higher, often associated with FWHM values typical of geological carbonates. Bulk fractions exhibit L wavenumbers below 281 cm−1 and varying v4 and v1 values, with FWHM typical of anthropogenic calcites.
The micro-Raman technique proves to be an effective method for identifying anthropogenic calcite, since the FWHM parameter, correlated with the degree of crystalline order, allows the distinction of calcite of anthropogenic origin (Calandra et al. Reference Calandra, Conti, Centauro and Cantisani2023; Toffolo et al. Reference Toffolo, Pinkas, Gallo and Boaretto2023) and enables the detection of Mg within the calcite lattice.
Furthermore, Mg incorporation into the calcite lattice also strongly affects the FTIR spectral profile by increasing structural disorder, leading to band broadening and asymmetry, as well as systematic shifts of diagnostic calcite bands (e.g., the ν₄ band) towards higher wavenumbers with increasing Mg content (Loste et al. Reference Loste, Wilson, Seshadri and Meldrum2003).
This behaviour supports the interpretation of samples falling between the two trends as reflecting changes in the ν₂ and ν₄ bands influenced by Mg incorporation.
Samples 2AL1, 7AL1, 17AL1 and 17AL2 are likely contaminated by geologic C as shown by OM-CL analysis (orange colour), ATR-FTIR (intermediate between the two trends), SEM-EDS (presence of Mg) and micro-Raman (higher wavenumber shift and lower FWHM values of L, v4 and v1 bands). Therefore, we can expect non accurate dates from them when applying radiocarbon. Otherwise, all the techniques suggest that 2AB1, 7AB1, 19CL1, 19CB1 and 22L1 are likely to be mainly composed of anthropogenic calcite.
As shown, the application of the described multi-analytical and non-destructive approach allows us to obtain representative data to infer which is the origin of calcite in heterogeneous samples. In fact, we use characterization measurements to select materials that we believe best reflect the requirements for radiocarbon application.
However, in the case of these samples from Pompeii, given the methodological purpose of the project, we chose to submit all the processed samples to 14C measurements.
3.3 Results of AMS measurements (step IV)
3.3.1 Extraction of carbon dioxide from the selected mortar powders
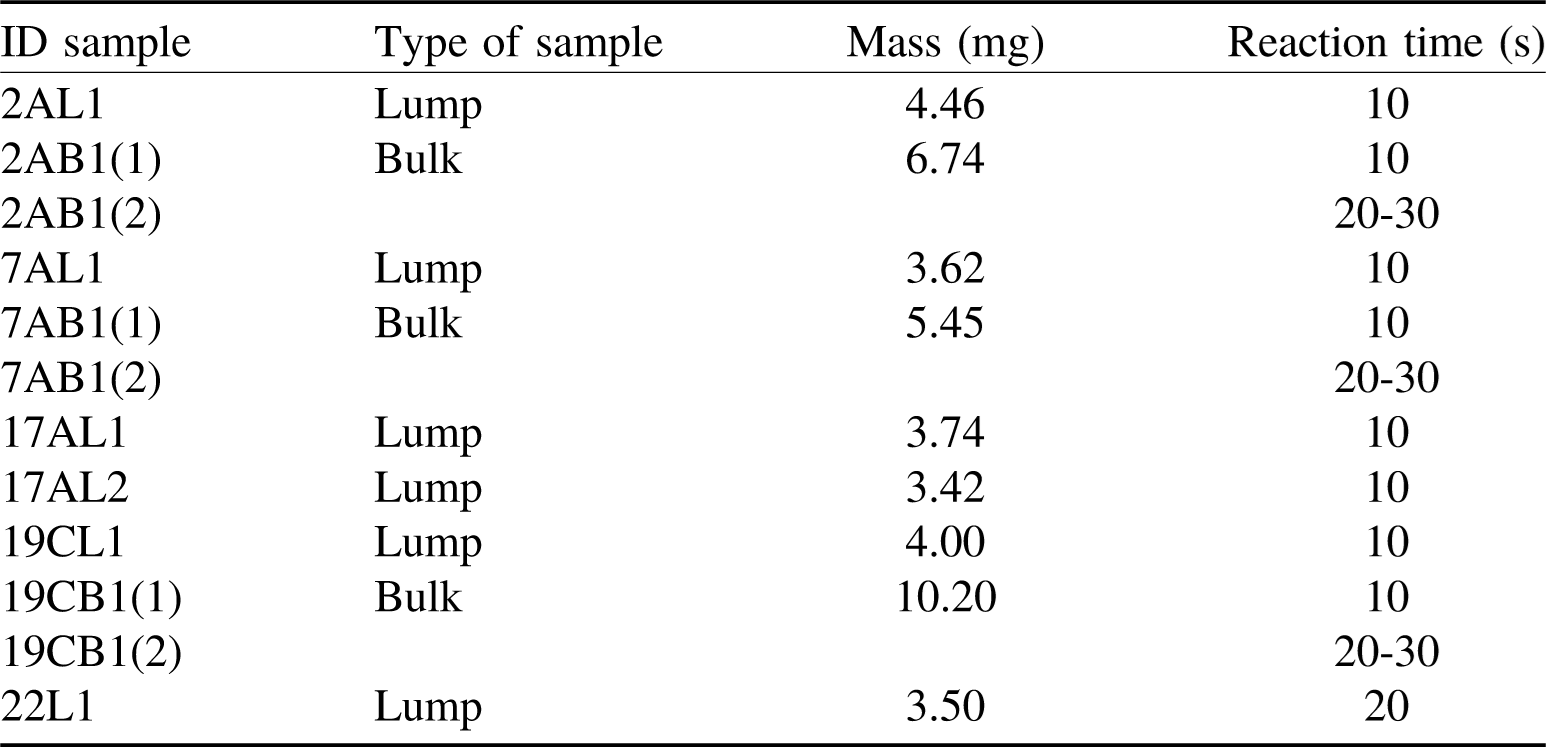
Processed masses and reaction times for the dissolution and the following collection of CO2 of binder-rich bulk and lump fractions are listed in Table 4. For bulk samples, two CO2 fractions were collected: the first produced within the first 10 seconds (indicated in the table with the label (1)), the second evolved between 20 and 30 seconds (indicated with the label (2)). These time intervals are selected on the basis of empirical evidence: in our configuration, they are typically sufficient to collect at least 100 mbar of CO₂ (see section 2.4), resulting from the dissolution of a pure CaCO₃ sample.
Mass, typology and reaction time chosen for the acid dissolution of Pompeii mortars.

Table 4. Long description
A table listing 12 samples with 4 columns: ID sample, Type of sample, Mass (mg), and Reaction time (s). Samples 2AL1, 7AL1, 17AL1, 17AL2, 19CL1, and 22L1 are labeled ‘Lump’ type, with masses ranging from 3.42 to 4.46 mg and reaction times of 10 s (20 s for 22L1). Samples 2AB1, 7AB1, and 19CB1 are ‘Bulk’ type, each split into two sub-entries labeled (1) and (2): entry (1) has a recorded mass (6.74, 5.45, and 10.20 mg respectively) with a 10 s reaction time, while entry (2) has no listed mass and a reaction time of 20-30 s.
In the case of lump samples, only the CO2 fraction produced in the first 10 seconds is generally collected, considering that their masses are typically smaller than those of bulk samples and that the ones collected after step III are expected to be pretty pure
Among all the digested samples, 7AB1 and 22L1 gave an amount of collected CO2 lower than expected. In particular, in the case of 22L1, we waited for a longer time (20 seconds) to achieve the requested pressure of CO2. Such an occurrence may suggest a composition not fully consisting of calcite. In fact, as shown by XRPD, hydraulic phases and aggregate inclusions may be present in the lumps and bulk fractions, contributing to the mass. If the selected sample has different components rather than pure calcite, we cannot exclude that some of those components may introduce some contamination. In this sense, we can consider the ratio of the collected CO2 over the digested mass as a hint of possible inaccuracies in the following radiocarbon measurement.
3.3.2 AMS data
In addition to all the main features as inferred from the characterization, Table 5 shows the results of the AMS measurements.
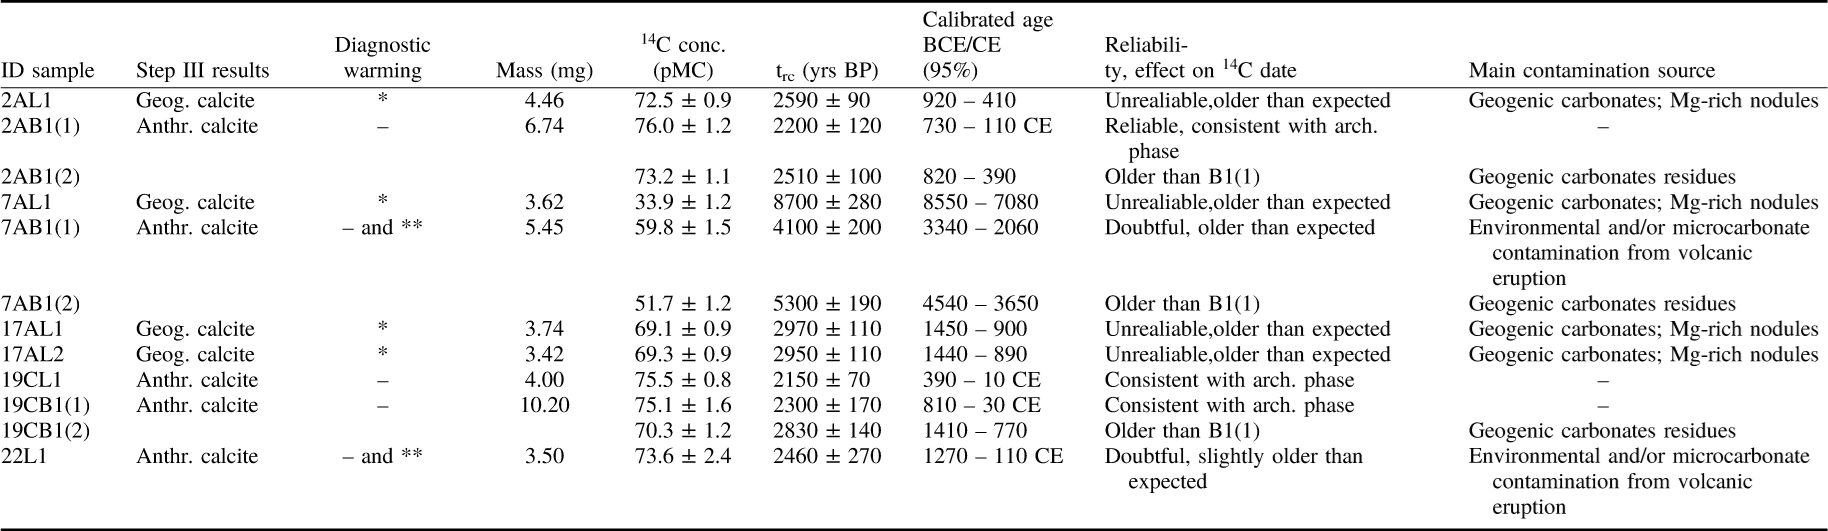
Summary of the analytical results obtained from steps II–IV of the multi-analytical procedure applied to Pompeii mortars. The results of step III, the measured radiocarbon concentrations and the corresponding conventional radiocarbon ages of the Pompeii samples, are reported. Calibrated age intervals at the 95% probability level are given, indicating lower and upper bounds. The main source of contamination is evaluated and hypothesized based on the combined characterisation and dating of the same samples.

Table 5. Long description
The table presents the analytical results from steps II to IV of a multi-analytical procedure applied to Pompeii mortars. It includes step III results, measured radiocarbon concentrations, and conventional radiocarbon ages of the samples. Calibrated age intervals at the 95% probability level are provided, showing lower and upper bounds. The main source of contamination is evaluated and hypothesized based on the combined characterization and dating of the same samples. The table has 10 rows and 8 columns, with headers such as ID sample, Step III results, Diagnostic warming, Mass, 14C conc., trc, Calibrated age, and Reliability, effect on 14C date. Each row lists specific data for different samples, including mass in milligrams, radiocarbon concentration in parts per million carbon, radiocarbon age in years before present, calibrated age in BCE/CE, and the main contamination source.
– Red-tile brown OM-CL; anthr. calcite ATR-FTIR trend; Raman band: L < 281 cm−1 and FWHM >18 cm−1 values.
* Bright orange OM-CL; intermediate ATR-FTIR trend; high Mg by SEM-EDS; Raman band: L > 281 cm−1 and FWHM around 13 cm−1 values.
** Low CO₂ extracted during dissolution process; composition not fully consisting of calcite/hydraulic behaviour.
As expected on the basis of the info from step III, which pointed to a possible contamination due to geogenic carbon, samples 2AL1, 7AL1, 17AL1 and 17AL2 are indeed older than expected.
The other samples deserve a more detailed discussion.
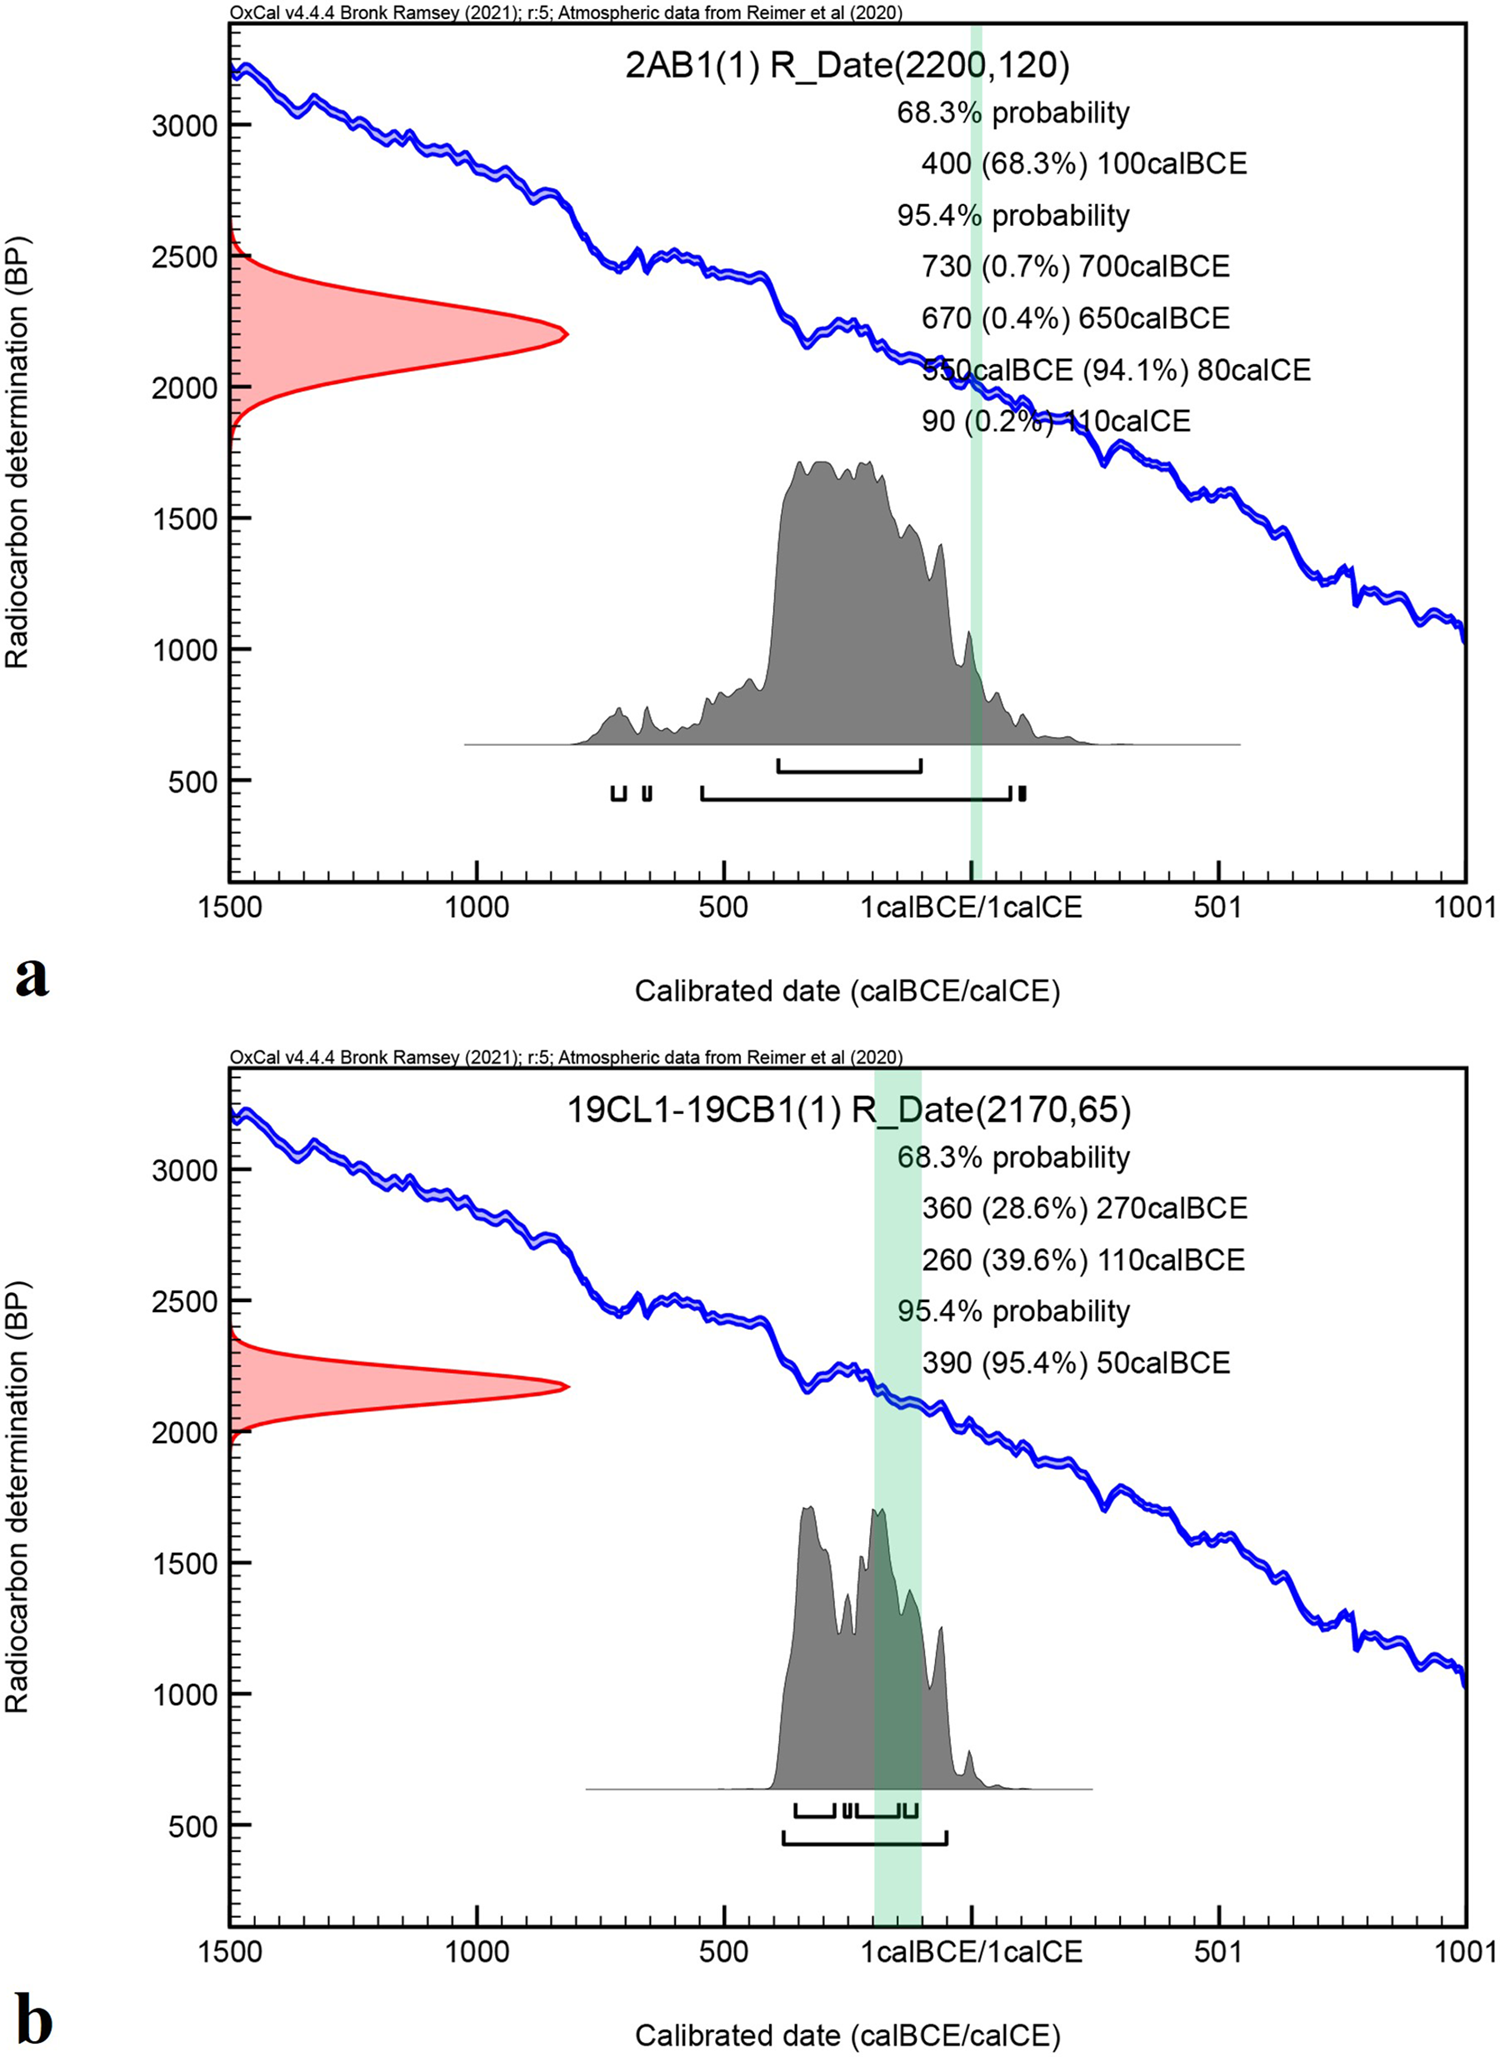
Sample 2AB1: as expected in the mortar dating procedure, the most reliable bulk part is the first collected, in this case 2AB1(1). In fact, this fraction, 2200 ± 120 yrs BP, is compatible with archaeological attribution (early imperial phase), considering the experimental uncertainty (see calibration in Figure 4a). On the contrary, the second collected fraction 2AB1(2) appears to be older than expected: this may be reasonable since the second evolving portion during dissolution may be subjected to contamination from geogenic carbon.
Calibrated age for the Pompeii non-contaminated samples: a) 2AB1(1); b) 19CL1 + 19CB1(1). Archaeological attribution phases in green labels.

Figure 4. Long description
The image contains two graphs labeled as a) 2AB1(1) and b) 19CL1-19CB1(1), each showing radiocarbon determination in BP (Before Present) on the y-axis and calibrated dates in calBCE/calCE on the x-axis. The graphs display probability distributions for different calibrated dates with specific percentages. Graph a) shows a 68.3 percent probability at 100 calBCE and a 95.4 percent probability at 700 calBCE, with notable peaks and troughs in the distribution. Graph b) shows a 68.3 percent probability at 270 calBCE and a 95.4 percent probability at 50 calBCE, with similar peaks and troughs. Both graphs include green labels indicating archaeological attribution phases. The blue lines represent the radiocarbon determination, while the shaded areas and red lines indicate probability ranges and specific calibrated dates. The graphs illustrate the complex process of dating pozzolana mortars by identifying and isolating anthropogenic calcite from other carbon sources.
Sample 19C: the first bulk fraction (19CB1(1)) and the lump (19CL1) are consistent according to statistics, as expected in good mortar samples for dating. We can thus evaluate the best estimation of the date of this sample by calculating their weighted average: 2170 ± 65 yrs BP. Figure 4b shows the calibration graph of the measured radiocarbon age: the obtained age is compatible with the construction phase.
Samples 7AB1 and 22L1: they appear older than expected. Other forms of contamination of the material, including those related to environmental conditions, which our analytical procedure was unable to detect, cannot be excluded.
4. Final remarks
A four-step multi-analytical procedure to evaluate the feasibility of mortar radiocarbon dating—integrating i) historical-archaeological surveys and sampling, ii) multi-analytical characterization, iii) non-destructive analysis of calcite origin, and iv) micro-sample preparation with 14C-AMS dating—was systematically applied to numerous mortar samples from the public buildings of Pompeii.
These mortar samples consist of hydraulic mortars produced by adding pozzolana to air lime. The addition of pozzolana determines the setting and carbonation conditions of the mortar by carbonation of Ca(OH)2 with formation of anthropogenic CaCO3 and hydration of C2S and formation of CS/CASH with hydraulic properties. The samples contain pozzolana and predominantly volcanic rock fragments (pyroclastic products and crystals of magmatic origin) as aggregates. Minero-petrographic and micromorphological criteria (texture of the binder, shape of the aggregate, grain size distribution and B/A ratio) allowed the identification of groups associated with construction phases and the exclusion of most of the samples for the application of dating. The extensive characterization performed in step II led to the selection of only a small part of the samples initially collected for radiocarbon dating.
Two of the samples, from the Eumachia building and the Temple of Apollo, 2AB1(1) and the two fractions 19CL1 and 19CB1(1), respectively, have been found to be compatible with the expected age as inferred from the archaeological evidence and complete documentation of the written sources and the archaeological analysis of the walls (step I). Steps III-IV indeed highlighted that they could have been promising candidates for dating, considering that OM-CL, ATR-FTIR and micro-Raman highlighted that they are mainly composed of anthropogenic calcite.
The remaining samples yielded ages significantly older than the established archaeological dates. From step III characterization some criticalities with regard to the composition of lumps were observed. In fact, samples 2AL1, 7AL1, 17AL1, and 17AL2 are composed of geogenic carbonates and Mg was found in the lumps. OM-CL, SEM-EDS and micro-Raman analyses confirmed the presence of limestone residues with magnesium. However, based on ATR-FTIR processing, it was expected that the samples would fall within the geogenic calcite trend. Instead, they fall between the two trends. This deviation could be attributed to changes in the shape of the FTIR absorption bands caused by the presence of magnesium, which affected the processing outcomes. In the presence of Mg, ATR-FTIR processing results should therefore be interpreted with caution, as compositional effects may influence band shapes and, consequently, the classification. Therefore, the selected samples likely represent unburned lumps, due to relics of the firing process.
Samples 7AB1 and 22L1 were identified as predominantly consisting of anthropogenic calcite according to the step III characterization; however, lower CO2 was recorded during the extraction process. This may be attributed to a mineralogical composition not entirely dominated by calcite, a hypothesis further supported by the XRPD results.
This apparent aging of the samples could be attributed to contamination arising from the complex archaeological context and the characteristics of the materials. The masonry was completely buried under a layer of volcanic ash and became part of geological cycles and diagenetic processes (Kilian et al. Reference Kilian, Borgatta and Wendler2023; Sparice et al. Reference Sparice, Di Vito, Amato, Amoretti, Russo, Talamo and Zuchtriegel2025). These processes include various chemical, physical and biological transformations that sediments undergo after their initial deposition. The most significant process that can affect radiocarbon dating is the formation of a carbonate matrix in the cavities of the depositional products.
In addition, CO2 emissions from the active Somma-Vesuvio volcano and the Campi Flegrei volcanic system in the Bay of Naples led to an atmosphere contaminated with excess CO2 (Frondini et al. Reference Frondini, Chiodini, Caliro, Cardellini, Granieri and Ventura2004). It is impossible to estimate to what extent the 14C age is influenced by the concentration of radiocarbon originating from the volcanoes.
However, the data from some samples suggests that microscale carbonate inclusions may occasionally persist, potentially eluding detection even within a multi-analytical framework. This may be attributed to the specific geological nature of the Pompeian aggregate, which consists of volcanic rocks derived from the volcanic conduit with a Mesozoic limestone basement (Mele et al. Reference Mele, Knuever, Dellino, Costa, Fornelli, Massaro and Sulpizio2024). Rising magmas interact with the limestone basement before reaching the surface, and volcanic eruptions release gasses which can alter volcanic deposits and even produce carbonate minerals in volcanic rocks. When dating Roman mortars, the risk of carbonate contamination by pozzolanic fillers is high, due to their reduced dimensions and intimate association with the volcanic aggregate, these geogenic carbonates may remain undetected.
A summary of the analytical results obtained in steps III and IV, including sample characteristics, contamination sources and their impact on radiocarbon reliability, is reported in Table 5.
All things considered, we can conclude that, even before any 14C measurements, according to the analytical measurements, most of the samples were likely to be contaminated. Nevertheless, this study is the first to systematically correlate the characterization results to the specific material subsequently dated. Only through such an approach, is it possible to elucidate the possible factors that make Pompeian mortar samples so particularly challenging for radiocarbon dating.
On the other hand, the experience with these samples suggests that in a context so complex such as the Pompeii’s, even when applying several complementary analytical techniques, we cannot exclude the possible presence of some effects we cannot detect. The comprehensive characterization performed represents anyway a valuable tool to perform a screening on the samples to be dated, allowing us to select only those samples that are likely not to be contaminated.
Supplementary material
To view supplementary material for this article, please visit https://doi.org/10.1017/RDC.2026.10229
Acknowledgments
The authors wish to thank Antonino Russo and Giuseppe Scarpati of the Archaeological Park of Pompeii.


 Open access

