Introduction
Among the major cereal crops, rice (Oryza sativa L.) is an imperative staple food crop for more than half of the Indian population as well as the rest of the world. The crop stands next only to wheat in consumption among major food crops. Rice contributes to the food security, economy and livelihood security of marginal and resource-poor farmers in the nation. More than 60% of the farmers growing rice as their major crop are from Asian countries (Yadav et al., Reference Yadav, Aravindan, Ngangkham, Shubudi, Bag, Adak, Munda, Samantray and Jena2017). Rice production and productivity have increased many-fold since the 1970s; however, they still need to be increased with the same land and limited resources by 2030 to meet the world's growing population (Khush, Reference Khush2005). The crop faces a number of biotic and abiotic challenges during its growth and development. Among the biotic challenges, diseases are of major concern and are caused by pathogenic fungi, bacteria, viruses, nematodes, etc. (Laha et al., Reference Laha, Singh, Ladhalakshmi, Sunder, Srinivas Prasad, Dagar, Ravindra Babu, Chauhan, Jabran and Mahajan2017). The dynamics of rice diseases have changed over the years, mainly due to changes in climatic conditions and cultivation practices (Laha et al., Reference Laha, Singh, Ladhalakshmi, Sunder, Srinivas Prasad, Dagar, Ravindra Babu, Chauhan, Jabran and Mahajan2017). Many of the major diseases such as blast, sheath blight, bacterial blight, brown spot and tungro are continuing to cause more severe damage than earlier, and many of the minor diseases have emerged as major problems (Yadav et al., Reference Yadav, Aravindan, Raghu, Prabhukarthikeyan, Keerthana, Ngangkham, Pramesh, Banerjee, Adak, Kar, Parameswaran, Deshmukh, Tiwari, Mohanty and Rath2019). Bakanae, false smut, sheath rot, narrow brown spot, stack burn and early seedling blight have emerged as serious problems in recent years, causing both qualitative and quantitative losses (Raghu et al., Reference Raghu, Yadav, Prabhukarthikeyan, Baite, Lenka and Jena2018).
Bakanae disease, also called foot rot or foolish seedling, has emerged as a major problem for rice production in several regions of the world. In India, this disease is a major problem in basmati-growing areas of north-western India (Bashyal et al., Reference Bashyal, Aggarwal, Sharma, Gupta, Rawat, Singh, Singh and Gopalakrishnan2014). The disease is caused by Fusarium fujikuroi (Nirengerg) [Telomorph: Gibberella fujikuoi (Sawada)] a seed-borne fungal pathogen belonging to the Phylum Ascomycota. Among the Indian states, Punjab, Haryana, Western Uttar Pradesh, Uttarakhand and Delhi are facing a serious problem of the disease, especially in basmati-growing regions, especially where the PB-1121 variety is grown (Sunder et al., Reference Sunder, Singh and Dodan2014). In recent days, the disease has emerged as a major problem in north-eastern and eastern Indian states, where non-basmati rice is a major cultivar option, leading to the susceptibility of popular varieties grown in this region (Raghu et al., Reference Raghu, Yadav, Prabhukarthikeyan, Baite, Lenka and Jena2018). The pathogen is highly seed-borne and spreads to healthy fields through airborne conidia and ascospores and can induce grain sterility, which ultimately leads to low yield and quality loss (Ou, Reference Ou1985; Zainudin et al., Reference Zainudin, Razak and Salleh2008). Previous research has shown that the pathogen can cause losses ranging from a sporadic incidence to as much as a 70% yield loss in the field (Sun and Snyder, Reference Sun, Snyder, Nelson, Toussoun and Cook1981; Webster and Gunnell, Reference Webster and Gunnell1992; Fiyaz et al., Reference Fiyaz, Gopala Krishnan, Rajashekara, Yadav, Bashyal, Bhowmick, Singh, Prabhu and Singh2014). The fungus F. fujikuroi produces two types of toxins, namely gibberellic acid and fusaric acid. Gibberellic acid produces abnormal elongation of seedlings and plants, while fusaric acid causes seedling death. The appearance of disease symptoms mainly depends on the type and quantity of toxin produced and the host–pathogen interactions (Ou, Reference Ou1985; Singh and Sunder, Reference Singh and Sunder2012). Seed-borne inoculum plays a major role in secondary transmission of the disease under favourable environmental conditions by producing numerous conidia and infecting fresh plants (Rosales and Mew, Reference Rosales and Mew1997). The pathogen infects rice grains during field cultivation and is carried to storage. The contaminated seeds after sowing in the field will result in disease incidence through colonization in seedlings (Chung et al., Reference Chung, Huang, Chen, Lai, Chen and Kuo2016). On infected plants, symptoms such as abnormal seedling elongation, lanky and pale green plants, larger inter-nodal length, roots produced from each node, growth of fungal mass on each node and production of chaffy or sterile panicles develop based on the amount of inoculum and environmental conditions (Amatulli et al., Reference Amatulli, Spadaro, Gullino and Garibaldi2010; Wulff et al., Reference Wulff, Sørensen, Lübeck, Nielsen, Thrane and Torp2010; Jeon et al., Reference Jeon, Yu, Lee, Park, Lee, Sung, Kim and Lee2013). Managing bakanae disease is very challenging as the pathogen is seed-borne, and once it is established in the field, it is difficult to manage even with fungicidal sprays. The fungicides cannot function well in destroying the spores of the pathogen, and some of the strains showed resistance to fungicides (Park et al., Reference Park, Choi, Han, Shin, Shim, Jung, Lee, Lim and Lee2009; Kim et al., Reference Kim, Park, Kim, Lee, Choi, Lee and Kim2010; Lee et al., Reference Lee, Lee, Choi, Kim, Park, Myung and Park and2011). Therefore, the genetic improvement of rice varieties using QTLs/genes imparting resistance to bakanae disease would be a more effective and ecofriendly way to control the disease (Volante et al., Reference Volante, Tondelli, Aragona, Valente, Biselli, Desiderio, Bagnaresi, Matic, Gullino, Infantino, Spadaro and Vale2017; Lee et al., Reference Lee, Kim, Hur, Cho, Kim, Lee, Cho, Lee, Song, Seo, Ko and Park2019). Few researchers have taken up the resistance screening work against bakanae disease and reported few genes/QTLs responsible for resistance (Li et al., Reference Li, Luo and Chen1993; Fiyaz et al., Reference Fiyaz, Gopala Krishnan, Rajashekara, Yadav, Bashyal, Bhowmick, Singh, Prabhu and Singh2014, Reference Fiyaz, Yadav, Krishnan, Ellur, Bashyal, Grover, Bhowmick, Nagarajan, Vinod, Singh, Prabhu and Singh2016; Kim et al., Reference Kim, Hur, Lee, Kwon, Hwang, Park, Youn, Lee, Cho, Shin, Kim, Han, Yeo, Song, Nam and Park2014); QTLs such as qB1, qB10 on chromosome 1 (Yang et al., Reference Yang, Guo, Li, Ji, Ma and Qian2006), qBK1 (Hur et al., Reference Hur, Lee, Kim, Kwon, Lee, Shin, Park, Hwang, Cho, Yoon, Yeo, Song, Kwak, Nam and Park2015), qBK1.1, qBK1.2 and qBK1.3 on chromosome 1 and qBK3.1 on chromosome 3 (Fiyaz et al., Reference Fiyaz, Yadav, Krishnan, Ellur, Bashyal, Grover, Bhowmick, Nagarajan, Vinod, Singh, Prabhu and Singh2016), qBK1WD (Lee et al., Reference Lee, Hur, Cho, Lee, Kim, Cho, Song, Seo, Lee, Kim, Park, Oh and Park2018), qBK1z (Lee et al., Reference Lee, Kim, Jo, Hur, Lee, Cho, Lee, Kang, Song, Bombay, Kim, Lee, Seo, Ko and Park2021), qFfR1 (Ji et al., Reference Ji, Kim, Lee, Kang, Lee, Suh, Kim, Choi, Baek and Kim2018), qBK1_628091 and qBK4_31750955 (Volante et al., Reference Volante, Tondelli, Aragona, Valente, Biselli, Desiderio, Bagnaresi, Matic, Gullino, Infantino, Spadaro and Vale2017) and qFfR9 (Kang et al., Reference Kang, Cheon, Oh, Oh, Kim, Kim, Lee, Choi, Baek, Kim, Chung and Ji2019). Identification of resistant cultivars, followed by genetic diversity analysis and population structure studies of genotypes, is important and an early step in resistance breeding programme.
During the process of varietal development, resistance loci for bakanae disease may be incorporated unknowingly into the released varieties, and such varieties may serve as excellent donors for the further improvement of new varieties with bakanae disease resistance. In this milieu, we hypothesize that genotypes considered in the present study may have resistance loci that are useful in future breeding programmes. The current study was designed to test the hypothesis by (a) identifying bakanae-resistant varieties grown across the country's different ecologies, (b) studying allelic diversity and population structure among rice varieties for reported regions of resistance and (c) re-examining the microsatellite marker associations with bakanae disease resistance. With the increasing need to identify novel genetic resources, the investigation may provide valuable information and resources for researchers to breed resistant varieties against this emerging but serious disease of rice.
Material and methods
Plant materials
Plant material comprised a set of 121 diverse varieties of rice released for large-scale cultivation in farmer fields in different growing ecologies of India by the ICAR-National Rice Research Institute, Cuttack, and other rice research institutes. These varieties belong to nine different ecologies (irrigated-48, shallow low land-23, upland-18, medium deep water-8, semi-deep water-4, coastal saline-8, aerobic-5, deep water-6 and boro-3), each having a different grain type, duration and varied degree of resistance to biotic and abiotic stresses. The seed material was obtained from the institute's gene bank and screened in the institute's glass house (85° 55′ 48″ east to 85° 56′ 48″ west and 20° 26′ 35″ north to 20° 27′ 20″ north latitude).
Pathogen characterization and inoculum preparation
Fusarium fujikuroi isolates were collected from infected plants in different rice-growing regions of Odisha and Assam. Isolated pure cultures were maintained after their morpho-physiological and molecular characterization using TEF-1α gene sequence analysis. The most virulent isolate, Ff-10 (NCBI Accession Number: MK442097), was isolated from infected plants of variety Pooja grown in farmers' fields in the Cuttack district and used in the current study. The potato dextrose agar plates were inoculated with a pure culture of the pathogen and incubated for 7–10 days at 25 ± 1°C for full growth. After 10 days, sterilized distilled water was flooded onto plates with mycelium and mixed by scraping with a sterilized spatula. The resulting spore suspension was filtered through double-layered sterile muslin cloth, and the inoculum concentration was adjusted to 1 × 10⁶ conidia/ml using a haemocytometer. This suspension was used for pathogenicity tests and genotype screening.
Phenotyping for disease reaction in net house condition
For phenotyping the rice varieties, the standard seed inoculation technique was used with minor modifications from Fiyaz et al. (Reference Fiyaz, Gopala Krishnan, Rajashekara, Yadav, Bashyal, Bhowmick, Singh, Prabhu and Singh2014). The experiment was carried out in three replications for two seasons during the wet seasons of 2017 and 2018 for confirmation of the results. To begin with, healthy seeds of each test variety were surface sterilized with 1% sodium hypochlorite for 2 min, followed by three successive washings in sterilized distilled water to remove the traces of the chemical. For the next 24 h, the seeds were soaked in distilled water. On the next day, seeds were challenge inoculated with spore suspension (1.0 × 10⁶ conidia/ml) for 24 h. Then, seeds were dried in the shade for 30 min before being planted in portrays containing sterilized soil and sand mixtures in a 3:1 ratio. Highly susceptible varieties, Pooja and PB-1121, were used as susceptible checks. For each variety, a pathogen-free distilled water control was used to compare results. The disease incidence was recorded starting 12 days after sowing, when 100% germination was observed in control treatments. The data on germination percentage, number of dead seedlings, elongation percentage and normal plants were taken. The disease incidence (including elongated and dead seedlings) was recorded and scored using the 0–9 scale proposed by Fiyaz et al. (Reference Fiyaz, Gopala Krishnan, Rajashekara, Yadav, Bashyal, Bhowmick, Singh, Prabhu and Singh2014).

Genomic DNA extraction from leaf sample
Fresh leaves from each variety were collected separately and stored in an ice-cold box used for the extraction of total genomic DNA using CTAB (cetyl-trimethyl ammonium bromide) method (Murray and Thompson, Reference Murray and Thompson1980) with suitable/minor modifications. One gram of leaf powder was crushed in liquid nitrogen before being mixed with extraction buffer. The sample was transferred into 2 ml tubes and incubated at 65°C for 1 h in a water bath. The tubes were centrifuged at 10,000 rpm for 15 min after adding an equal volume of chloroform–isoamyl alcohol (24:1). The supernatant was extracted into new 1.5 ml tubes and mixed with 400 μl of chilled isopropanol and 100 μl of ice-cold sodium acetate (3 M) and kept overnight at −20°C. On next day, the tubes were centrifuged at 10,000 rpm for 5 min. The resultant DNA pellet was washed by adding wash buffer followed by centrifuge at 10,000 rpm for 5 min. Finally, 70% alcohol was used to clean the DNA pellet before drying it in a laminar air flow chamber. The pellet was dissolved in T10E1 buffer (10 mM Tris base, 1 mM EDTA, pH 8.0). The quality and quantity of isolated DNA were assessed using spectrophotometer at 260 and 280 nm in a Nanodrop spectrophotometer (ND-1000, Thermofisher Scientific, USA). The confirmation was made by agarose gel electrophoresis (0.8%). The present study used 12 microsatellite (simple sequence repeat (SSR)) markers reported to be associated with bakanae resistance (online Supplementary Table S1) for genotyping. The microsatellite markers were supplied by M/s Integrated DNA Technology (IDT), New Delhi, and supplied as desalted products. Required dilutions were made to prepare working standard as per manufacturer's protocol.
Microsatellite marker assay
PCR amplification was performed in a reaction volume of 10 μl comprised of 0.5 μl template DNA, Taq buffer (1×) about 0.5 μl, 0.5 μl of forward and reverse primers (0.2 μM) each, 1.5 mM of MgCl2, 0.2 μM of each dNTP, 0.1 μl of 1 U of Taq DNA polymerase (Thermo Scientific, USA) and MilliQ water 6.4 μl. The PCR reaction was performed at following conditions of 94°C for 5 min for initial denaturation, followed by 35 cycles of 94°C for 45 s of denaturation, 55°C for 30 s of annealing, 72°C for 1 min of extension and final extension at 72°C for 5 min. The PCR reactions were carried out in Thermal Cycler, T-100 (Bio-Rad, USA). Following amplification, the samples were run on an agarose gel (3.0%), supplied by MP Biomedical, USA, with ethidium bromide (0.5 μg ml-1) in 0.5 × TBE buffer for 240 min at 80 volts. A 50 bp DNA ladder (BR Biochemicals, USA) was used to compare the size of the amplified products. The gels were observed and documented under a UV gel imaging system (XR Plus, BioRad, USA). A binary scoring system (0 and 1) was used for scoring the amplified products as absent and present, respectively. The results were further confirmed by repeating the experiment twice for each primer.
Allelic diversity and population structure analysis
The binary data matrix scored for all the microsatellite markers was used for the estimation of similarity coefficients and genetic distances. The genetic relationship was evaluated between the test varieties. For the construction of an unweighted neighbour joining an un-rooted tree, DARwin 6 software was used with bootstrap values of 1000 (Nei, Reference Nei1973; Perrie and Jacquemound-Collect, Reference Perrie and Jacquemoud-Collet2006). The estimation of population structure was done using STRUCTURE Ver 2.3.4 software (Pritchard et al., Reference Pritchard, Stephens and Donnelly2000). The run length of 100,000 burn-in period lengths and 100,000 replications of Markov Chain Monte Carlo (MCMC) were fixed. The number of sub-populations (K) in the main population was estimated at different values from K = 1 to K = 10 with five independent interactions. The STRUCTURE HARVESTER, an online tool (Earl, Reference Earl2012), was used to estimate ΔK value as per Evanno et al. (Reference Evanno, Regnaut and Goudet2005). A principal coordinate analysis (PCoA) was carried out to visualize the results of genetic distances between bakanae-resistant and -susceptible varieties and to understand genetic clustering in a multidimensional space. Analysis of molecular variance (AMOVA), PCoA and significant pairwise fixation index statistics (F ST) were carried out using GenAlEx 6.502 software.
The mean disease scores from the screening experiments were used to examine the association of reported markers with disease resistance using marker–trait association in present experimental material. The generalized linear model (GLM) function in TASSEL 5 software was used to examine the association of microsatellite (SSR) markers with bakanae resistance (Bradbury et al., Reference Bradbury, Zhang, Kroon, Casstevens, Ramdoss and Bucker2007).
Statistical analysis
The data collected from the screening experiment was pooled and subjected to statistical analysis using the statistical analysis software program SAS. The software was provided by the Indian Agricultural Statistical Research Institute (IASRI), New Delhi (https://iasri.icar.gov.in/online-analysis-of-data/). A one-way analysis of variance was performed, and the treatment means were compared using Tukey's honestly significantly different test at the 0.05 level of probability. All the data were angularly transformed before analysis.
Results
Phenotyping of rice varieties against bakanae disease
The screening results of the reaction of rice varieties to F. fujikuroi showed that, out of 121 test varieties, only eight (6.5%), namely Luna Sankhi, Improved Tapaswini, Sarasa, Sadabahar, CR-311, Kshira, Wifa-10 and Binadhan-8, were found to be highly resistant (HR), seven (5.69%) varieties were resistant (R), 31 (25.20%) varieties were moderately resistant (MR), 10 (8.13%) varieties were observed as moderately susceptible (MS), 12 (9.76%) varieties were susceptible (S) and 55 (44.72%) varieties were recorded as highly susceptible (HS). The ratio of resistant varieties was observed to be 46/121 (38.01%), indicating that the resistant sources for the disease are very rare. The resistant genotypes were spread across all the rice-growing ecosystems. As far as the ecologies are concerned, the maximum number of varieties belongs to irrigated ecology, with 48 varieties (consisting of five highly resistant and 15 were moderately resistant, two susceptible, three moderately susceptible and 21 highly susceptible varieties). Similarly, in shallow low land ecology, four were resistant, six were moderately resistant, three were moderately susceptible and the rest were highly susceptible. Other ecologies (upland: one HR, one R, three MR, one S, one MS and 11 HS; medium deep water: one R, one MR, two S, one MS and three HS; semi-deep: two MR, one S, one HS; coastal saline: two HR, one R, one MR, one MS and three HS; aerobic: one MR, three S and two HS; deep water: one MR, two S, one MS and two HS; Boro: one MR and two MS) have few highly resistant, moderately resistant and resistant varieties (Table 1).
Evaluation of rice varieties (ecology wise grouping) for bakanae disease resistance

Allelic diversity among rice varieties based on microsatellite marker assay
The results of allelic diversity among 121 rice varieties using 12 SSR markers showed that, out of 12 microsatellite markers, only one marker (RM-10153) produced monomorphic amplification while the rest produced polymorphic amplicons (from two to eight bands). Polymorphic analysis revealed a total of 37 alleles, with a mean allele number of 3.08 per marker. The number of polymorphic alleles in each marker varied from two to eight (RM-3698). The amplicon size of 104 bp, which was the lowest size among the markers, was produced by RM 486, and the maximum amplicon size was observed in marker RM 3698 (900 bp). The information regarding major allelic frequency, gene diversity and polymorphism information content (PIC) of 12 reported bakanae resistance-related markers was assessed. The informativeness of molecular markers has been measured using PIC, and the results showed that the PIC values ranged from 0.031 (RM-10153) to 0.374 (RM-3698) with an average value of 0.264. The gene diversity estimated based on marker alleles ranged from 0.032 (RM-10153) to 0.449 (RM-3698). All the 12 tested SSR markers were found to be relatively low in their informativeness (PIC < 0.5) (online Supplementary Table S2). The AMOVA was performed to estimate total variation among the varieties (individuals), within the population, and among populations. The results show that more variance (95%) was observed among the individuals and less (5%) variance was observed among the population (Fig. 1). Based on Nei's genetic distance, pairwise comparisons were made, and it was found that more distance between the populations was observed (Nei's genetic distance = 0.999).
Analysis of molecular variance among 121 rice varieties.

Genetic variability among the rice varieties based on cluster analysis
The microsatellite marker data obtained from 121 rice varieties was assessed for genetic variability (genetic distance) and dissimilarity among varieties. The phylogenetic tree was constructed based on genetic distance between genotypes using the NJ method. The un-weighted neighbour joining tree constructed using DARwin 6 software grouped all 121 test varieties into three major clusters (Fig. 2). Cluster I was the smallest cluster, with 19 varieties, and it is further divided into two sub-clusters: sub-cluster IA, with five varieties, and sub-cluster IB, with 14 varieties. Cluster II was divided into two sub-clusters: IIA (with five varieties) and IIB (36 varieties). Cluster III, on the other hand, was the largest cluster having 61 varieties, divided into two sub-clusters, IIIA (nine varieties) and IIIB (52 varieties). The varieties possessing different reactions to the bakanae disease were spread in all three clusters. Major cluster II included 41 genotypes, including four (9.75%) highly resistant genotypes. Similarly, major cluster III was found to be the largest cluster, which possessed only four (6.55%) highly resistant genotypes among 61 varieties. The highly resistant genotypes were mostly grouped in major clusters II and III. Similarly, major cluster I mostly consisted of moderately resistant genotypes, whereas susceptible and highly susceptible genotypes were distributed in all the three clusters (Table 2).
Un-rooted neighbour-joining tree of 121 rice varieties constructed based on bakanae resistance gene-specific markers data.

Clustering of rice varieties for bakanae disease resistance based on microsatellite marker amplification

Principal coordinate and population structure analysis
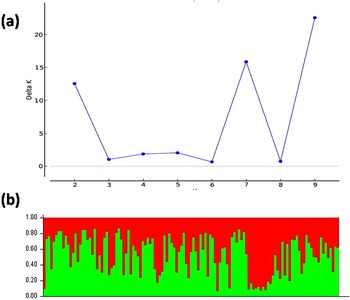
Reported QTL/gene-linked microsatellite marker-derived data were used to estimate the genetic relatedness among rice varieties using PCoA. A scatter plot was created by performing PCoA, which showed that the first two axes explained 17.78 and 14.61% variation, respectively, and the cumulative variation of 45.82% was explained by the first three axes (online Supplementary Table S3). All the varieties with different reactions were labelled with different colours using PCoA. The population structure of 121 released varieties for bakanae disease resistance using 12 markers was performed to understand the genetic relationship among varieties for resistance alleles using an ad hoc model-based structure program. The results indicated the presence of two sub-populations within the population of rice varieties considered in the study (Fig. 3). The disease scores of the individuals from different sub-populations were compared. Even though it was not perfectly differentiating resistant and susceptible genotypes, there was a trend of differential alleles for resistance and susceptibility in the sub-populations. The results of cluster analysis and structure analysis were compared to examine any possible similarity between the clusters and sub-populations obtained. The cluster analysis resulted in three clusters, and the structure analysis showed two significant sub-populations in the experimental material. The most of highly resistant genotypes were grouped into clusters II and III, whereas moderately resistant genotypes were grouped into cluster I. Similarly, genotypes with moderate-to-high resistance were grouped into one subpopulation and reaming classes of disease response were grouped into other sub-population in structure analysis.
Population structure analysis of 121 rice varieties. (a) The maximum ad hoc measure ΔK determined by STRUCTURE HARVESTER was found to be at K = 2.3. (b) Estimated population structure graphs that differentiated the entire population into two subgroups. Different colours in an individual indicate the proportion of shared ancestry with the other subgroup.

Examining marker–trait associations for bakanae disease resistance
For association analysis, genotyping information from reported markers assayed on the experimental population was used. The analysis was performed using the GLM to study the genetic association markers with bakanae disease resistance. Among the 12 markers used in the current study, only marker RM3698 was significantly associated with bakanae disease resistance at 5% probability (online Supplementary Table S4). The phenotypic variance explained by the associated marker was 8.4% (0.08481). However, other markers reported in different studies used in the present experiment could not be associated with bakanae resistance in the current population.
Discussion
Rice bakanae disease, earlier reported as minor disease, has created a serious problem in recent years, especially in the basmati-growing areas of north India (Bashyal and Aggarwal, Reference Bashyal and Aggarwal2013). In the recent past, the disease had also emerged as a major problem in eastern and north-eastern states like Odisha, Assam and West Bengal, with considerable yield and quality losses (Raghu et al., Reference Raghu, Yadav, Prabhukarthikeyan, Baite, Lenka and Jena2018). Management of the disease through chemical fungicides always has side effects on human and animal health, along with environmental pollution. The continuous use of fungicides may lead to the development of new pathogen races that are resistant to existing pesticides. Hence, identification of stable resistant sources and QTLs/genes involved in confirming resistance is rendered the most effective, economic and environmentally safe management practice for this disease (Singh et al., Reference Singh, Sunder, Dodan and Ram2011). Till date, limited progress has been made in the identification of suitable resistant sources against bakanae disease; the identification of resistance is hindered due to its seed-borne nature. Several researchers have made attempts on this and come out with some screening protocols such as the in vitro seedling screening assay (Lee et al., Reference Lee, Lee, Choi, Kim, Park, Myung and Park and2011), the sprouted seedling assay (Haque et al., Reference Haque, Rahman and Miah1979), dipping dry seeds in gibberellic acid (Ma et al., Reference Ma, Ji, Bao, Zhu, Li, Zhuang, Yang and Xia2008; Hossain et al., Reference Hossain, Mia and Bashar2013), the infested soil pot or field method (Rajagopalan and Bhuvaneswari, Reference Rajagopalan and Bhuvaneswari1964) and the seed inoculation method (Fiyaz et al., Reference Fiyaz, Gopala Krishnan, Rajashekara, Yadav, Bashyal, Bhowmick, Singh, Prabhu and Singh2014). All these methods resulted in disease development within 15–35 days' post inoculation. With little modification to the method given by Fiyaz et al. (Reference Fiyaz, Gopala Krishnan, Rajashekara, Yadav, Bashyal, Bhowmick, Singh, Prabhu and Singh2014), we screened the experimental material and the screening process was complete within 15–20 days of sowing. The method was tested on Pooja and Pusa Basmati-1121 which were found as highly susceptible and Pusa 1342 as highly resistant genotypes before conducting large-scale screening of released varieties.
In the present study, a total of 121 released varieties grown in different ecologies of India and other countries were phenotyped and genotyped against the rice bakanae disease. We found that only eight varieties, namely Luna Sankhi, Improved Tapaswini, Sarasa, Sadabahar, CR Dhan-311, Kshira, Wifa-10 and Binadha-8, were highly resistant. Seven varieties were resistant, 31 were moderately resistant, 10 were moderately susceptible, 11 were susceptible and 54 were highly susceptible. In a similar experiment, Fiyaz et al. (Reference Fiyaz, Gopala Krishnan, Rajashekara, Yadav, Bashyal, Bhowmick, Singh, Prabhu and Singh2014) screened a total of 92 rice varieties and found eight were highly resistant, four were resistant, 33 were moderately resistant, 14 were moderately susceptible, 13 were susceptible and 20 varieties were highly susceptible. Ito and Kimura (Reference Ito and Kimura1931) identified some of the Japanese resistant genotypes against bakanae disease. Thirteen genotypes with moderate-to-high resistance, five genotypes with medium resistance and one genotype with moderate resistance were identified (Li et al., Reference Li, Luo and Chen1993; Zheng et al., Reference Zheng, Lv, Wu and Nie1993; Halim et al., Reference Halim, Razak, Ali and Zainudin2015). Three resistant accessions contain dwarf or semi-dwarf genes which were identified by Ma et al. (Reference Ma, Ji, Bao, Zhu, Li, Zhuang, Yang and Xia2008). Twelve genotypes were evaluated under controlled conditions against bakanae disease. The genotypes showed all the symptoms of bakanae disease; Selenio showed high resistance, and Dorella showed high susceptibility (Matic et al., Reference Matic, Spadaro, Garibaldi and Gullino2014).
SSR markers have proven to be potential tools for assessing genetic variation in rice. The genetic similarity and diversity that are obtained by these microsatellite markers are highly accepted (Powell et al., Reference Powell, Morgante, Andre, Hanafey, Vogel, Tingey and Rafalski1996; Xiao et al., Reference Xiao, Li, Yuan, McCouch and Tanksley1996). In the current study, 12 microsatellite markers generated 37 alleles with numbers varying from one to eight, with a mean allele of 2.75 per locus, indicating greater variability among the test varieties. The 121 varieties were classified into three major clusters using these 12 markers. The clustering was done by marker alleles and the genetic distance between genotypes based on marker alleles. Most of the highly resistant genotypes were distributed in clusters II and III, and most of the genotypes with moderate resistance were grouped in cluster I. More or less, all clusters accommodated genotypes with all classes of disease reactions. This result suggests that the differences in phenotypic expression may not completely be attributed to genetic differences among genotypes. The geographical origin of genotypes may explain differences in phenotypic expression. The allelic diversity analysis performed for bakanae disease is very rare; however, for the first time, population structure and genetic diversity of 96 rice blast isolates from eastern India were investigated by Yadav et al. (Reference Yadav, Aravindan, Raghu, Prabhukarthikeyan, Keerthana, Ngangkham, Pramesh, Banerjee, Adak, Kar, Parameswaran, Deshmukh, Tiwari, Mohanty and Rath2019) using microsatellite markers, and they detected 110 alleles produced from 25 SSR markers. The variation in the allele number observed in our investigation could be due to the large size of the test population (varieties) and genetic variation in the varieties, which was also observed by Babu et al. (Reference Babu, Sharma, Upadhyaya, Reddy, Deshpande, Senthilvel, Sarma and Thakur2013). Genetic diversity analysis among a large number of breeding materials provides an immense contribution to the selection and monitoring of germplasm and the prediction of important genetic gains (Chakravarthy and Rambabu, Reference Chakravarthy and Rambabu2006). Similarly, Ravi et al. (Reference Ravi, Geethanjali, Sameeyafarheen and Maheswaran2003) opined that the phonological diversity within genetically similar groups might be because of the impact of environmental factors.
The two sub-populations in structure analysis and the three clusters in allele diversity analysis were obtained. This difference in grouping pattern may be attributed to the methodology used, where structure analysis uses similarity between genotypes while clustering uses genetic distance estimated from marker alleles for grouping. However, there was a trend in both types of grouping towards grouping resistant types. One marker, RM3698, was found to be associated with resistance after an examination of marker–trait associations. A similar marker was found associated with bakanae disease resistance, reported by Fiyaz et al. (Reference Fiyaz, Yadav, Krishnan, Ellur, Bashyal, Grover, Bhowmick, Nagarajan, Vinod, Singh, Prabhu and Singh2016). This marker may be utilized for marker-aided screening for bakanae resistance in diverse sets of genotypes. Utilization of the genome-wide association approach was employed very recently to identify the resistant loci for bakanae disease in rice (Volante et al., Reference Volante, Tondelli, Aragona, Valente, Biselli, Desiderio, Bagnaresi, Matic, Gullino, Infantino, Spadaro and Vale2017) and map two QTLs, namely qBK1 and qBK7_31750955, associated with bakanae resistance. The resistance sources identified may serve as resistant donors, and the markers validated in the present study may be useful for marker-assisted bakanae resistance varietal development.
Conclusion
The resistance sources identified among the released varieties help in the transfer of resistance loci without any deleterious linkage drag. In order to identify resistance sources among released varieties, we screened 121 varieties for bakanae resistance. Also, using reported molecular markers, allele diversity for the bakanae resistance allele was performed. The present study provided an overview of the phenotyping and genotyping of popular rice varieties released in different ecologies of the country for bakanae disease resistance. The resistant sources identified may be useful in efficient breeding programmes for bakanae resistance. The determination of bakanae disease resistance in a large number of varieties through phenotyping, population structure and phylogenetic classification will provide an important resource for accelerating the genetic improvement programme. Among the markers assayed, only one marker was associated with bakanae resistance. Using more SSR markers will enhance the precision of genetic diversity and population structure. The results of this investigation have significant implications for marker-assisted varietal development for bakanae resistance in rice.
Supplementary material
The supplementary material for this article can be found at https://doi.org/10.1017/S1479262123000199
Acknowledgements
The authors acknowledge The Director, ICAR-National Rice Research Institute, Cuttack, Odisha, India for his support and facilitation for carrying out the research.
Author contributions
Conceptualization: S. R., M. K. Y.; data curation: S. R.; formal analysis: S. L., M. S. B.; investigation: S. R., S. R. P., U. K.; methodology: S. R., B. J., M. S. B.; project administration: P. C. R.; resources: C. A. K., H. N. S.; software: B. J., S. R., M. K. Y.; supervision: P. C. R.; validation: S. R., S. R. P.; visualization: S. R., M. S. B.; writing ± original draft: S. R., B. J., M. K. Y., M. S. B.; writing ± review and editing: S. R., U. K., B. J., C. A. K., S. R. P. All the authors have read and approved the last version of the paper.
Financial support
None.
Conflict of interest
None.