



1. Introduction
The properties of the flow of granular matter in the discharge of a silo have been studied for years (Nedderman et al. Reference Nedderman, Tüzün, Savage and Houlsby1982) due to their applications in diverse fields such as agriculture or industry. Even so, due to the complexity that granular matter entails, there is still a lack of a theory which is able to predict granular flow in many circumstances. One of the major issues in this field is that a general model describing granular flows (like the one existing for the case of liquids), has not been fully developed. In this regard, emerging works have recently made progress by implementing the postulates of the  $\mu (I)$ rheology (MiDi Reference MiDi2004; Jop, Forterre & Pouliquen Reference Jop, Forterre and Pouliquen2006) to characterize the granular flow in silos with a continuous description (Staron, Lagrée & Popinet Reference Staron, Lagrée and Popinet2012; Dunatunga & Kamrin Reference Dunatunga and Kamrin2015; Zhou et al. Reference Zhou, Lagrée, Popinet, Ruyer and Aussillous2017). In parallel to this, many investigations consisting of experiments and simulations using discrete methods continue to produce fruitful results, keeping the problem of silo flow under very active research (González-Montellano et al. Reference González-Montellano, Ramirez, Gallego and Ayuga2011; Benyamine et al. Reference Benyamine, Djermane, Dalloz-Dubrujeaud and Aussillous2014; Zhou, Ruyer & Aussillous Reference Zhou, Ruyer and Aussillous2015; Ashour et al. Reference Ashour, Wegner, Trittel, Börzsönyi and Stannarius2017; Gella, Maza & Zuriguel Reference Gella, Maza and Zuriguel2017; Madrid, Asencio & Maza Reference Madrid, Asencio and Maza2017; Stannarius et al. Reference Stannarius, Martinez, Finger, Somfai and Börzsönyi2019; Golshan et al. Reference Golshan, Esgandari, Zarghami, Blais and Saleh2020; Reddy, Kumar & Reddy Reference Reddy, Kumar and Reddy2021).
In gravity-discharged silos, the most used expression that relates the flow rate with the size of the orifice is the Hagen–Beverloo regression (Beverloo, Leniger & van de Velde Reference Beverloo, Leniger and van de Velde1961).
 \begin{equation} W=C\rho_{B}(D-kd_{p})^{N-1/2}, \end{equation}
where  $C$ and
 $k$ are fitting constants,
 $\rho _{B}$ is the granular density in the bulk,
 $D=2R$ is the outlet diameter,
 $d_{p}$ is the particle diameter and
 $N$ is the dimensionality of the problem.
The expression includes a dependence on a reduced aperture  $D-kd_{p}$ raised to
 $N-1/2$, which leads to an exponent of
 $5/2$ for three-dimensional silos. The inclusion of a reduced aperture in the expression using a term proportional to the particle size
 $d_{p}$ alludes to the idea of vena contracta, according to which grains do not cross the orifice in the region close to the edges. Although this phenomenon does not actually take place (Van Zuilichem, Van Egmond & De Swart Reference Van Zuilichem, Van Egmond and De Swart1974), (1.1) results an effective approximation to predict the flow rate in silos. Concerning the
 $D^{5/2}$ scaling (which would be
 $D^{3/2}$ in a two-dimensional silo), it was inferred from a dimensional analysis (Hagen Reference Hagen1852; Tighe & Sperl Reference Tighe and Sperl2007) and justified by the velocity of the grains at the silo orifice with
 $v \propto \sqrt {gD}$, where g is the acceleration due to gravity, a hypothesis that was confirmed years later (Dorbolo et al. Reference Dorbolo2013; Arévalo et al. Reference Arévalo, Zuriguel, Maza and Garcimartín2014). The historical explanation for this scaling resided in the concept of the free fall arch (Hagen Reference Hagen1852; Brown & Richards Reference Brown and Richards1960; Tighe & Sperl Reference Tighe and Sperl2007). This theory supposes that grains descend along the silo with negligible acceleration while subjected to contact stress until reaching a curved region proportional to the outlet size. If this hypothetical vault has a paraboloidal shape, grains would start to free fall, leading to velocity values proportional to the square root of the aperture. The actual physics behind this approximation was unveiled in the experimental and numerical study of Rubio-Largo et al. (Reference Rubio-Largo, Janda, Maza, Zuriguel and Hidalgo2015). Therein, the authors computed the dynamical magnitudes of the system in the region of the outlet, finding no discontinuity in the vertical profiles of acceleration and stress. However, a nice scaling of some dynamical magnitudes with the orifice was found, a feature that was used to connect exactly with the velocity of particles at the outlet. In particular, they found that the vertical profiles of acceleration
 $a_{c}$ collapsed when the vertical coordinate was normalized over half the outlet size. In other words, the curves
 $\mathcal {F}(Z)=a_{c}(Z)/g$, where
 $Z=z/R$ and
 $g$ is the gravity acceleration, were self-similar for different outlet sizes. To connect these curves with the velocity at the exit, they computed the parameter
 $\gamma$ by means of the expression:
 \begin{equation} \gamma=\int_{\infty}^{0}\mathcal{F}(Z)\,\textrm{d}Z, \end{equation}
that is, the area under the aforementioned  $\mathcal {F}(Z)$ curves between the top of the silo (ideally
 $z=\infty$) and the exit line
 $z=0$. By construction, the velocity of the grains at the centre of the outlet
 $v_{c}$ is related to this
 $\gamma$ parameter by means of the expression
 \begin{equation} v_{c}={-}\sqrt{ 2\gamma gR}. \end{equation}
In this expression, a value of  $\gamma =1$ leads to the results predicted by the free fall arch theory. Indeed, experimental values of
 $\gamma$ are (a little greater, but) similar to those reported in various works (Janda, Zuriguel & Maza Reference Janda, Zuriguel and Maza2012; Gella et al. Reference Gella, Maza and Zuriguel2017), confirming the goodness of this approach. Therefore, it can be said that, in a freely discharged silo, the orifice size determines the scale of the dynamics, which in turn controls the magnitude of the velocity at the orifice through
 $\gamma$.
Recently, there has been a growing interest in studying some variations from the canonical system in this field: a static silo with an orifice in the centre of a flat bottom. Some examples are the use of forced silos (Madrid, Darias & Pugnaloni Reference Madrid, Darias and Pugnaloni2018), submerged silos (Koivisto et al. Reference Koivisto, Korhonen, Alava, Ortiz, Durian and Puisto2017), lateral apertures (Zhou et al. Reference Zhou, Lagrée, Popinet, Ruyer and Aussillous2017), corrugated walls (Wójcik et al. Reference Wójcik, Sondej, Rejowski and Tejchman2017), hoppers (Darias et al. Reference Darias, Gella, Fernández, Zuriguel and Maza2020), eccentric rotating orifices (To et al. Reference To, Yen, Mo and Huang2019) or silos discharged with a conveyor belt that extracts the grains through an orifice at its bottom (figure 1). The latter has been proven a good strategy to control the grain velocity in the discharge of granular silos. Indeed, this system allows us to decouple the outlet size and the grain velocity, making possible the prevention of clogging for low flow rates using a big outlet size and a small belt velocity instead of a small orifice size in a discharge driven by gravity.
Photograph of the bottom part of the silo where the definition of the outlet size  $D$ is appreciated, as well as the position of the wedge-shaped stainless steel pieces (labelled 1) and the conveyor belt (labelled 2). The experiment is running with an outlet size of
 $D=3.18\ \textrm{cm}$ and a belt velocity of
 $v_{b}=15.6\ \textrm{cm}\ \textrm{s}^{-1}$. The red rectangle represents the area recorded in videos from which the analysis of the particles motion was performed.

The relationship between flow and clogging in a two-dimensional silo in which the discharge was controlled by a conveyor belt was studied in Gella, Zuriguel & Maza (Reference Gella, Zuriguel and Maza2018). In addition, the intermittent properties that the flow adopts in this system were addressed in Gella, Zuriguel & Ortín (Reference Gella, Zuriguel and Ortín2019). Finally, the work reported in Gella, Maza & Zuriguel (Reference Gella, Maza and Zuriguel2020) connected the experimental flow rate to the profiles of solid fraction  $\phi$ and the vertical velocity of particles
 $v_{z}$ at the outlet line, following the method described in other works for free discharge silos (Janda et al. Reference Janda, Zuriguel and Maza2012; Zhou et al. Reference Zhou, Ruyer and Aussillous2015; Gella et al. Reference Gella, Maza and Zuriguel2017; Madrid et al. Reference Madrid, Asencio and Maza2017; Darias et al. Reference Darias, Gella, Fernández, Zuriguel and Maza2020). The main results reported in Gella et al. (Reference Gella, Maza and Zuriguel2020) are summarized in figure 2, in which
 $W$ (panel a), the solid fraction at the outlet centre
 $\phi _{c}$ (panel b) and
 $-v_{c}$ (panel c) are represented as functions of
 $D$ for several values of the belt velocity
 $v_{b}$. In all panels, results for the free discharge case obtained in a previous study for the same set-up without the belt (Gella et al. Reference Gella, Maza and Zuriguel2017) are also included. The experiments with the conveyor belt exhibit different kinematics than the free discharge case: first, in figure 2(a) we observe that the flow rate displays a linear behaviour with
 $D$ for all values of
 $v_{b}$, contrasting with the
 $D^{3/2}$ dependence followed by
 $W$ in the free discharge. In addition, the values of
 $\phi _{c}$ in the presence of the belt are remarkably distinct when compared with the free discharge (figure 2b); which, as reported in Gella et al. (Reference Gella, Maza and Zuriguel2017), can be well fitted by an expression that saturates at
 $\phi _{\infty }=0.83$. Despite the values of solid fraction for
 $D=1.61\ \textrm{cm}$ and high
 $v_{b}$ being practically identical to the free discharge case, as either
 $D$ increases or
 $v_{b}$ decreases, the solid fraction grows, tending to an asymptotic value which is considerably higher than the one observed for free discharged silos. Note that the value of
 $\phi _{c}$ in the limit of large
 $D$ and small
 $v_{b}$ seems to be that of the close packing of circles in two dimensions (
 $\phi _{CP}={\rm \pi} \sqrt {3}/6$, dotted line). Figure 2(c) shows probably the most striking discrepancy between the behaviour with and without the belt. In this case, all experiments with the belt exhibit a decrease of the particle velocity with
 $D$, whereas for the free discharge case, it increases with the square root as it was mentioned above. This behaviour was explained using mass conservation arguments, which worked very well in the limit of low belt velocities. Specifically, the flow of material entering the orifice was set equal to the that dragged by the belt, arranged in a pile whose dimensions were estimated.
(a) Mass flow rate as a function of the outlet size, for the free discharge case and the discharge with the belt with the velocities displayed in the legend. (b) Surface solid fraction at the outlet centre ( $x=0$) as a function of the orifice size for the same cases. The dotted line corresponds to the two-dimensional close packing of circles,
 $\phi _{c}=\phi _{CP}={\rm \pi} \sqrt {3}/6$. (c) Vertical velocity at the outlet centre as a function of the orifice size for the same cases. Downward velocities have been taken as positive for convenience. The experimental data in all panels have been extracted from the works reported in (Gella et al. Reference Gella, Maza and Zuriguel2017) (free discharge case) and Gella et al. (Reference Gella, Maza and Zuriguel2020) (cases with the conveyor belt).

It should be noted that the outcomes for the conveyor belt case almost reproduce the free discharge behaviour at small outlet sizes and fast belt velocities. As either  $D$ increases or
 $v_{b}$ decreases, the influence of the belt seems to become important and the free discharge progressively disappears. In this work, we will disentangle the origin of this behaviour by analysing the particle dynamics, not only at the exit line, but in a more extensive area above it. Through the building of continuous maps, we will characterize the effect of the conveyor belt in the overall motion of the grains and connect the internal dynamics to the flow rate dependence on
 $v_{b}$ and
 $D$. Also, our results will be compared with the preceding work of Gella et al. (Reference Gella, Maza and Zuriguel2017), which reported this kind of analysis in a similar experimental silo but in the free discharge configuration (without the belt).
2. Experimental set-up
The experimental system is the same as that used in Gella et al. (Reference Gella, Maza and Zuriguel2020). Namely, the set-up consists of a two-dimensional silo made up of two parallel and transparent safety glasses with a space between them slightly higher than  $0.4\ \textrm{cm}$. This configuration is achieved by sandwiching two
 $0.4\ \textrm{cm}$ thick aluminium plates supplemented with thin cardboard sheets at both sides of the glasses, playing the role of silo walls. In this way, only a single layer of the granular material, AISI 420 stainless steel spheres with a diameter of
 $d_{p}=2r_{p}=0.4\ \textrm{cm}$, fits inside the container. Then, the available space inside the silo is approximately
 $160 \times 61.2 \times 0.4 \ \textrm{cm}^{3}$. At the bottom of the silo there are two wedge-shaped stainless steel pieces whose separation is variable and defines the orifice size through which the grains are discharged. This region is shown in the photograph of figure 1. Moreover, a hopper situated at the top of the silo is used to facilitate its filling.
The rate at which the material is discharged is determined by an electronically controllable conveyor belt placed below the orifice, which can run at a velocity  $v_{b}$ between
 $0.1$ and
 $16\ \textrm{cm}\ \textrm{s}^{-1}$. Specifically, there is a distance
 $h=0.67\pm 0.03\ \textrm{cm}$ between the upper protrusions of its honeycomb pattern and the bottom of the silo. The grain motion is measured by means of a Photron FASTCAM-1024 PCI high-speed camera. The frames cover a width of approximately 15 particle diameters (
 $6\ \textrm{cm}$) and are 12 particle diameters high (
 $5\ \textrm{cm}$), with the orifice located slightly above the bottom part of the image (see figure 1). In particular, experiments have been performed covering the whole range of
 $v_{b}$ and
 $D$ available. Specifically,
 $v_{b}$ goes from
 $0.1$ to
 $16\ \textrm{cm} \ \textrm{s}^{-1}$, and
 $D$ spans from the value at which clogging appears (
 $D\approx 4d_{p} = 1.6\ \textrm{cm}$) to the maximum experimentally possible (
 $D=4.82\ \textrm{cm}$) taking into account that the grains are dragged with a
 $6.5\ \textrm{cm}$ wide belt. For each experimental condition, five films have been recorded with a typical duration between 1.5 and 6 s each and a frame rate between 250 and 1000 frames per second. After the video acquisition, a subsequent particle tracking software was implemented, allowing the computation of all positions and velocities of the particles in each frame.
2.1. Coarse-graining protocol to compute mean field magnitudes from discrete data
With the aim of studying the internal dynamics of the system, the magnitudes have been evaluated in the whole space rather than just in the position of the particles. To do that, continuous fields have been constructed from the discrete data of particle velocities and positions following a coarse-graining protocol, which was developed in Goldhirsch (Reference Goldhirsch2010) and applied to the problem of silos in Rubio-Largo et al. (Reference Rubio-Largo, Janda, Maza, Zuriguel and Hidalgo2015) and Weinhart et al. (Reference Weinhart, Labra, Luding and Ooi2016). From the position of the particle centres  $r_{i}(t)$, the coarse-grained map of surface solid fraction is defined in each frame as
 \begin{equation} \phi(\boldsymbol{r},t) = A_{p} \varTheta(\boldsymbol{r}-\boldsymbol{r}_{i}(t)), \end{equation}
where  $A_{p}={\rm \pi} r_{p}^{2}$ is the cross-sectional area of a particle, and
 $\varTheta (\boldsymbol {r}-\boldsymbol {r}_{i}(t))$ is a coarse-graining function, which must be normalizable, semi-defined positive, and have a characteristic width
 $\omega$ accounting for the extension of the magnitude spread around
 $\boldsymbol {r}_{i}$. In this work, we have used a two-dimensional Gaussian function,
 \begin{equation} \varTheta(\boldsymbol{r}-\boldsymbol{r}_{i}(t)) = \frac{1}{2{\rm \pi} \omega^{2}} \exp(-|\boldsymbol{r}-\boldsymbol{r}_{i}(t)| /2\omega^{2} ), \end{equation}
with  $\omega =r_{p}$. Due to computational reasons, the Gaussian function has been cut off for distances longer than
 $3\omega$ from the particles centre. In the same way, the expression for the coarse-grained velocity
 $\boldsymbol {V}(\boldsymbol {r},t)$ is expressed as
 \begin{equation} \boldsymbol{V}(\boldsymbol{r},t)= \frac{\sum_{i} \boldsymbol{v}_{i}(t) \varTheta(\boldsymbol{r}-\boldsymbol{r}_{i}(t)) }{\sum_{i} \varTheta(\boldsymbol{r}-\boldsymbol{r}_{i}(t)) }, \end{equation}
where  $\boldsymbol {v}_{i}(t)$ are the velocities of the particles at the position
 $\boldsymbol {r}_{i}(t)$. It should be noted that both (2.1) and (2.3) entail a set of two-dimensional field maps, one per frame in the film. In order to report a single map per magnitude, both the surface solid fraction and the velocity have been averaged over all the frames in the films as
 $\phi (\boldsymbol {r}) = \langle \phi (\boldsymbol {r},t) \rangle$ and
 $V(\boldsymbol {r}) = \langle \boldsymbol {V}(\boldsymbol {r},t) \rangle$.
Goldhirsch (Reference Goldhirsch2010) also calculated the coarse-grained form of the stress tensor  $\sigma _{\alpha \beta }$, resulting in a sum
 $\sigma _{\alpha \beta } = \sigma ^{c}_{\alpha \beta } + \sigma ^{k}_{\alpha \beta }$ of two components: the contact stress
 $\sigma ^{c}_{\alpha \beta }$ and the kinetic stress
 $\sigma ^{k}_{\alpha \beta }$. The values of
 $\sigma ^{c}_{\alpha \beta }$ must be computed from the inter-particle forces, information that cannot be obtained in this experiment. The values of the kinetic stress, however, can be calculated by means of the expression
 \begin{equation} \sigma^{k}_{\alpha\beta} (\boldsymbol{r},t) ={-} \sum_{i} m_{i} v'_{i\alpha}(t) v'_{i\beta}(t) \varTheta(\boldsymbol{r}-\boldsymbol{r}_{i}(t)), \end{equation}
where  $\boldsymbol {v}'_{i}(t)= \boldsymbol {v}_{i}(t) - \boldsymbol {V}(\boldsymbol {r}_{i})$ makes reference to the fluctuations of the punctual velocities
 $v_{i}(t)$ over the mean field
 $\boldsymbol {V}(\boldsymbol {r})$. In this work, the interest of the kinetic stress computation resides in the comparison among spatial configurations in different cases rather than in the absolute value of the magnitude. Considering this, and for the sake of simplicity, we have computed the magnitude
 $\sigma ^{k}(\boldsymbol {r},t)$, which accounts for the two-dimensional positive projection of the kinetic stress trace regardless the contribution of the particle mass
 \begin{equation} \sigma^{k}(\boldsymbol{r},t)= \sum_{i}[v'^{2}_{ix} + v'^{2}_{iy} ] \varTheta(\boldsymbol{r}-\boldsymbol{r}_{i}(t)). \end{equation}
Finally,  $\sigma ^{k}(\boldsymbol {r},t)$ has been also averaged over the total number of frames in each film as
 $\sigma ^{k}(\boldsymbol {r}) = \langle \sigma ^{k}(\boldsymbol {r},t) \rangle$.
3. Experimental results
3.1. Field maps
The coarse-grained field maps of  $\phi$,
 $V_{z}$ (the downwards component of
 $\boldsymbol {V}(\boldsymbol {r})$) and
 $\sigma ^{k}$ have been computed and are represented in figures 3, 4 and 5 respectively, for three representative orifice sizes and three different belt velocities.
Field maps of the coarse-grained surface solid fraction for the outlet sizes indicated at the top and the values of  $v_{b}$ displayed on the right. The colour scale is the same in all panels as the colour bars shown on the left of each row are identical.

Coarse-grained velocity fields for the three outlet sizes indicated at the top, and the values of  $v_{b}$ displayed on the left. Downward velocities have been taken as positive for convenience. The colour bars in panels (a,d,g) apply to all panels in each row (which have the same
 $v_{b}$).

Field maps of the coarse-grained values of the kinetic stress trace for the three outlet sizes indicated at the top, and the values of  $v_{b}$ displayed on the left. The colour bars in panels (a,d,g) apply to all panels in each row (which have the same
 $v_{b}$).

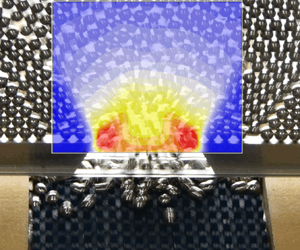
Let us start by analysing the solid fraction maps in the limit of small orifices and fast belt velocities. In these conditions, the conveyor belt is barely felt by grains (Gella et al. Reference Gella, Maza and Zuriguel2020) and the dynamics is conducted mainly by gravity. Hence, the maps are expected to be similar to the ones reported in Gella et al. (Reference Gella, Maza and Zuriguel2017) for the free discharge experiment. This hypothesis is clearly fulfilled for  $D=1.61\ \textrm{cm}$ and
 $v_{b}=15.6\ \textrm{cm}\ \textrm{s}^{-1}$, as shown in figure 3(g). Therein, two triangular zones of high solid fraction are observed at both sides of the outlet, as well as a bluish central region in which
 $\phi$ is reduced when the material approaches the orifice, in a similar way to the free discharge. Interestingly, if either
 $D$ is enlarged or
 $v_{b}$ reduced, the influence of the belt starts to become important in preventing the material dilation at the orifice. In consequence, the blue zone of low solid fraction observed in figure 3(g) is not observed in the other panels. In fact, the effect of the belt yields a compaction of the material at the outlet region, which is especially evident in the panels corresponding to
 $D=4.82\ \textrm{cm}$ (right column of figure 3). Specifically, panels (c,f), for which the belt velocity is slow, show a maximum of
 $\phi$ at a position around
 $(x,z)=(0,1)\ \textrm{cm}$. Surrounding it, a yellow triangle of lower solid fraction appears which may be attributed to shear bands produced due to the high order exhibited by the material for such low belt velocities.
The maps of the coarse-grained vertical velocity  $V_{z}$ are shown in figure 4. There, notable variations in the values of the velocities are observed, especially for distinct belt velocities (note the different scale of the colour bars). Indeed, the
 $V_{z}$ values for the maximum
 $v_{b}$ (g,h,i) are close to
 $40\ \textrm{cm}\ \textrm{s}^{-1}$ while the velocities for the slowest belt velocity (a,b,c) are smaller than
 $1\ \textrm{cm} \ \textrm{s}^{-1}$ in all cases. Additionally, the presence of stagnant zones (with velocities near zero) is clear. Like before, let us start by analysing figure 4(g), which corresponds to the case of the smallest orifice (
 $D=1.61\ \textrm{cm}\ \textrm{s}^{-1}$) and the largest belt velocity (
 $v_{b}=15.6\ \textrm{cm}\ \textrm{s}^{-1}$). As expected, this panel presents similar features to the maps for the free discharge reported in Gella et al. (Reference Gella, Maza and Zuriguel2017). In particular, it shows that the velocity of grains monotonically increases as they descend along the silo, reaching the largest values of
 $V_{z}$ in the lowest part of the panel (below the orifice). Again, when the system distances from the gravitational regime, (either decreasing
 $v_{b}$ or increasing
 $D$), there is a small but important change in the patterns. Particularly, a spot of maximum velocity emerges around the orifice centre and above it; that is, below the orifice, particles are slowed down due to the action of the conveyor belt. This velocity maximum seems to appear in a position that ascends as the outlet size is enlarged indicating that, the larger the orifice, the longer the distance at which the belt is felt by the grains. Or, in other words, the smaller the orifice, the more screened the effect of the belt is.
The maps of  $\sigma ^{k}$ are shown in figure 5. Paying attention to the colour bars, each of which apply to its corresponding row, it is evident that the values of
 $\sigma ^{k}$ vary considerably with the belt velocity. In the same way as the values of velocity,
 $\sigma ^{k}$ also decrease when the belt velocity is reduced. Starting again, and focusing on panel (g), we observe an arch with the characteristic lobes above the orifice as reported for the free discharge case in Gella et al. (Reference Gella, Maza and Zuriguel2017). This suggests the existence of a highly fluctuating region created by collisions and mainly determined by the outlet size. As
 $v_{b}$ is reduced, the two lobes disappear and are replaced by a big one in the region of the exit. Furthermore, when the outlet size is enlarged, a triangle with the same dimensions of the one with low solid fraction observed in figure 3 emerges. The triangle is composed in this case of two collisional zones: the base, produced by the slowing down of the particles induced by the belt; and the upper sides, which constitute a deformation of the gravitational arch.
On the whole, the three families of field maps reveal an evolution from a gravitational regime (for low  $D$ and high
 $v_{b}$) to another scenario in which the effect of the conveyor belt becomes dominant. In the gravitational regime, the system is characterized by the existence of an arch-shaped region where the collisions take place, which is determined by the size of the orifice. Differently, in the belt-dominated regime, a new region of collisions emerges below the orifice, reducing the velocity of the grains and compacting the material above it. These features suggest a competition between the arch effect above the outlet caused by gravity and the outlet, and the slowing down effect induced by the conveyor belt. Depending on both
 $D$ and
 $v_{b}$, one or the other effect is more apparent.
3.2. Vertical profiles
Now, in order to take a further step in the study of the system dynamics, we have analysed at  $x=0$ the vertical profiles of the magnitudes shown above plus the particle acceleration. Figure 6 displays the profiles of
 $\phi$ (panels a–c),
 $V_{z}$ (panels d–f), the vertical acceleration
 $a_{c}$ (panels g–i) and
 $\sigma ^{k}$ (panels j–l) as function of
 $z/R$ for the same cases presented in the previous section. In addition, we have added the profiles for another value of
 $v_{b}$ and the curves obtained in the free discharge experiment (Gella et al. Reference Gella, Maza and Zuriguel2017) for reference. The profiles of
 $\phi$,
 $V_{z}$ and
 $\sigma ^{k}$ have been extracted from the central position (
 $x=0$) of the matrices conforming the maps represented in figures 3, 4 and 5 and the vertical profiles of vertical acceleration vs
 $z/R$ have been computed from the velocity ones by making use of the following expression:
 \begin{equation} a_{c}(z)=\frac{\textrm{d}V_{c}(z)}{\textrm{d}z}\frac{\textrm{d}z}{\textrm{d}t} = V_{c}(z)\frac{\textrm{d}V_{c}(z)}{\textrm{d}z}. \end{equation}
Vertical profiles at  $x=0$ of (a–c) surface solid fraction, (d–f) vertical velocity, (g–i) vertical acceleration and (j–l) kinetic stress. Results are presented for the three orifice sizes indicated at the top and the values of
 $v_{b}$ shown in the legend (solid lines). Downward velocities have been taken as positive for convenience. The data of the free discharge case (dashed lines) are included for reference.

The first row of graphs in figure 6(a–c) shows the vertical  $\phi$ profiles against
 $z/R$. For the smallest outlet size studied (
 $D=1.61\ \textrm{cm}$), the curves for
 $v_{b}=7.3$ and
 $15.6\ \textrm{cm}\ \textrm{s}^{-1}$ fall on top of the free discharge profile. However, for lower values of
 $v_{b}$ and/or higher values of
 $D$, the reduction of
 $\phi$ observed near the exit (
 $z/R \approx 0$) for the free discharge case is clearly attenuated. This evidences the role of the belt, which consists of slowing down the grains and preventing the dilation of the material. When the outlet is enlarged, a local minimum of
 $\phi$ is observed at a position around
 $z/R\approx 1.5$, a signature of the triangular bands shown in figure 5. Finally, let us stress that the purple curves (corresponding to the lowest belt velocity) systematically exhibit the highest values of
 $\phi$ for all
 $D$, approaching in some cases the closest packing of circles in two dimensions,
 $\phi _{CP}={\rm \pi} \sqrt {3}/6 \approx 0.906$.
The profiles of vertical velocity  $V_z$ against
 $z/R$ are illustrated in figure 6(d,e,f), whereas their temporal derivatives (the acceleration profiles
 $a_{c}$ vs
 $z/R$) are represented in panels (g,h,i). For all orifice sizes, both the velocity and acceleration profiles for the minimum value of
 $v_{b}=0.1\ \textrm{cm}\ \textrm{s}^{-1}$ present negligible values, suggesting that this scenario is a good approximation for a quasi-static discharge as proposed in Gella et al. (Reference Gella, Zuriguel and Maza2018). When the extraction velocity is increased, the velocity profiles grow in magnitude, reaching the curve corresponding to the free discharge in the case of
 $D=1.61\ \textrm{cm}$. Interestingly, in contrast to the free discharge scenario, the curves for the same
 $v_{b}$ and different
 $D$ are similar. Also, the apparition of velocity maxima can be discerned; a feature that is attributed to the effect of the belt, which slows the grains as they approach the orifice (
 $z/R$ decreases). Interestingly, the position at which the curves stop their growth is higher for large orifice sizes and small belt velocities, which are the conditions for which the belt has a strong effect on the grain dynamics. Obviously, the velocity maxima should coincide with the point at which
 $a_{c}/g$ cross the
 $x$-axis in the panels underneath. Indeed, the behaviour of the system is better appreciated in the acceleration profiles. In these graphs, the curves seem to follow the free discharge scenario for high values of
 $z/R$, and deviate from it at certain point as
 $z/R$ decreases. The presence of the conveyor belt slows the grains, preventing the characteristic acceleration observed in the free discharge case. As above, the inflection point at which the acceleration curves leave following the free discharge behaviour is related to the impact of the conveyor belt on the grains dynamics. The more important the effect of the belt is (for low
 $v_{b}$ and large
 $D$), the higher the relative position at which the grains start feeling its presence and depart from the free discharge behaviour in the acceleration curves.
Figure 6(j,k,l) represents the vertical profiles of  $\sigma ^{k}$ vs
 $z/R$ at
 $x=0$. In panel (l), for
 $D=4.82\ \textrm{cm}$, two local maxima of kinetic stress around
 $z/R=0$ and
 $1$ are observed for the highest value of
 $v_{b}$. Essentially, these maxima reflect the two collisional regions already appreciated in the maps: the higher one is the characteristic arch-shaped region observed in the free discharges and the lower one is caused by the belt. When the outlet size is reduced to
 $D=3.18\ \textrm{cm}$ (panel k), the two maxima seem to join, and if
 $D$ is reduced even more (
 $D=1.61\ \textrm{cm}$, panel j), a single minimum (which coincides with the one displayed on the gravity curve) is observed. Apparently, the contribution of the belt (that yielded the maximum at
 $z/R=0$ in panel l) disappears for the smallest
 $D$ and only the maximum related to the gravitational acceleration (corresponding to the typical arch of this regime) is present. For the case of very small values of
 $v_{b}$ the kinetic stress is negligible for the orifices studied. Then, under these experimental conditions, the material is discharged with a high compaction and negligible acceleration, velocity and kinetic stress. The features of this quasi-static motion lead us to identify it with the one that takes place on a solid submitted to plastic deformations.
In general, the magnitudes approach the behaviour of the free discharge case when the orifice size is small and the belt velocity is large. As either the orifice size is enlarged or the conveyor belt velocity reduced, the curves split from that trend, starting for low values of  $z/R$, until the curves are completely separated. The influence of the variation of these parameters, however, is not equal in all magnitudes. For example, the differences in the velocity are more notable than those other parameters, such as the solid fraction.
3.3. Connecting internal dynamics with the velocities at the exit
The vertical acceleration profiles can be connected with the particles’ velocity at the outlet by computing the  $\gamma$ parameter, which accounts for the integral of the dimensionless vertical acceleration of the grains along the
 $z$-axis (see (1.2)). Let us recall that we already performed an analysis based on these computations for the free discharge experiment in Gella et al. (Reference Gella, Maza and Zuriguel2017). There, we found values of
 $\gamma$ somewhat higher than one for all orifice sizes considered. These results are represented in figure 7 as function of
 $D$ for the range of outlet sizes studied in this work. The
 $\gamma$ value for
 $D=1.61\ \textrm{cm}$, the smallest outlet size, was significantly smaller than the rest, but this difference was attributed to the existence of flow fluctuations in this region of small
 $D$ at which clogging phenomena might appear. Otherwise, the values of
 $\gamma$ were considered as compatible with
 $\gamma =1.45$, the value obtained by fitting the experimental particle velocities at the outlet size to (1.3). This feature was taken as a piece of evidence on the connection between the acceleration profiles within the silo and the velocities at the orifice.
Values of  $\gamma$ as function of the outlet size for the belt velocities displayed in the legend and for the free discharge case. The dashed line accounts for
 $\gamma =1.45$, the value used to fit the data of
 $v_{c}$ vs
 $D$ using (1.3) in the free discharge experiment. Data for the free discharge case were already reported in Gella et al. (Reference Gella, Maza and Zuriguel2017).

Now, we analyse the  $\gamma$ values for the experiments with the belt, which are also represented in figure 7. Remarkably, for small outlet sizes and high belt velocities, the values of
 $\gamma$ are close to one, approaching the free discharge case. In addition, the trends observed for all curves are noticeably similar to the data of
 $v_{c}$ vs
 $D$ in figure 2(c). As in that graph, as either the outlet size is enlarged or the belt velocity is decreased, the values of
 $\gamma$ clearly diminish. Moreover, the values of
 $\gamma$ for the smallest belt velocity (quasi-static regime) are negligible. These features confirm that
 $\gamma$, defined as in (1.2), is a parameter that links the internal dynamics to the velocities of the particles at the exit line. For the present case, this parameter can be viewed as a measure of how close the regime is to free discharge, which is characterized by
 $\gamma$ values equal or higher than one.
4. Conclusions
In this work, we investigated the micromechanics of the flow in a silo discharged with a conveyor belt, focusing in an extensive area covering the orifice and the region above it. The computation and analysis of the mean field maps of solid fraction, vertical velocity and kinetic stress suggest that the dynamics of the system is characterized by a competition between two agents. On the one hand, the outlet size that sets the characteristic length from which grains start accelerating and decompacting; on the other, the presence of the belt, which induces an upward transference of momentum that slows down the grains and compacts them below the orifice. When the conveyor belt barely affects the dynamics (for low  $D$ and high
 $v_{b}$) the fields are quite similar to the free discharge case. For other experimental conditions, the combination of both effects determines the patterns of the different magnitudes. These conclusions are supported by the computation of the
 $\gamma$ parameter from the acceleration vertical profiles. This parameter, which determines the particles velocity at the exit, can be also understood as a measure of the degree of influence of the belt in the discharge (
 $\gamma =0$ for a strong effect and
 $\gamma \simeq 1$ for a negligible effect).
Complementarily, the impact of the conveyor belt in the particle dynamics was also evidenced by the differences in the kinetic stress profiles shown in figure 6(j–l). In this sense, aiming at a better visualization of these differences among the belt extraction and free discharge protocols, in figure 8 we have represented  $\sigma ^{k}$ normalized by
 $\sigma ^{k}_{GRAV}$ (the kinetic stress values for the free discharge case) for the smallest and the biggest orifices studied. For the first case (
 $D=1.61\ \textrm{cm}$, panel a), the values for the two highest belt velocities approach considerably the free discharge value of
 $1$, with, perhaps, the only exception of
 $z/R<0$ (i.e. below the orifice) where the normalized kinetic stress augments due to the presence of the belt. Thus, the effect of belt is practically negligible in this regime of small outlets and high velocities, as was deduced in the previous analysis. Nevertheless, for the two smallest belt velocities, the normalized kinetic stress is considerably reduced, yet no relevant differences appear in the shapes of the curves. On the contrary, for
 $D=4.82\ \textrm{cm}$ (figure 8b), the impact of the belt is important for all belt velocities as is inferred from the fact that all curves fall significantly below
 $\sigma ^{k}/\sigma ^{k}_{GRAV}=1$. The largest orifice studied promoted the coexistence of two differentiated peaks which become more apparent for larger values of
 $v_{b}$. These regions of high fluctuations are collisional areas; the higher one is related to the characteristic arch of the free discharge regime, whose extension is determined by the outlet size, and the lower one is created by the presence of the belt.
Results of  $\sigma ^{k}$ normalized by
 $\sigma ^{k}_{GRAV}$ (the kinetic stress values for the free discharge case), as a function of
 $z/R$ for the belt velocities displayed in the legend. Panel (a) shows data for
 $D=1.61\ \textrm{cm}$ while panel (b) shows data for
 $D=4.82\ \textrm{cm}$. In both graphs, the dashed line accounts for the
 $\sigma ^{k}/\sigma ^{k}_{GRAV}=1$ value associated with free discharge.

The accomplishment of this analysis and the use of  $\gamma$ to determine the influence of gravity on the outflow properties have been applied here to the specific problem of a silo discharged with a conveyor belt. However, the application of these methods is perfectly feasible in flows of other many-particle systems where the computation of acceleration profiles along the streamlines (and eventually the
 $\gamma$ parameter) could provide a helpful picture of the system flow dynamics. Also, the wide ranges of particle velocities and volume fractions observed in the silo discharged by a conveyor belt make this system ideal for testing the applicability of non-local models such as the ones proposed in Staron et al. (Reference Staron, Lagrée and Popinet2012), Dunatunga & Kamrin (Reference Dunatunga and Kamrin2015) and Zhou et al. (Reference Zhou, Lagrée, Popinet, Ruyer and Aussillous2017).
Funding
This work was funded by Ministerio de Economía y Competitividad (Spanish Government) through Project Nos FIS2014-57325 and FIS2017-84631-P, MINECO/AEI/FEDER, UE. D.G. also acknowledges Ministerio de Economía y Competitividad (Spanish Government) for Grant No. BES-2015-074436.
Declaration of interests
The authors report no conflict of interest.



