INTRODUCTION
Holocene glacial fluctuations in southernmost Patagonia are poorly documented, due in part to the remote location of the region's glaciers and logistical challenges to accessing them. Additional glacial chronologies from this region would help to clarify the relation between climate change and glacial response and to assess whether Holocene glacial advances were synchronous between the Northern and Southern Hemispheres. We describe the terrestrial evidence for repeated late Holocene expansion of Stoppani Glacier, a large valley glacier sourced from the Cordillera Darwin, southernmost Patagonia.
We document the stratigraphy of the large lateral moraines flanking the lower part of Stoppani Glacier using techniques developed in Europe (Röthlisberger, Reference Röthlisberger1987) and further refined in northwestern North America (Ryder and Thomson, Reference Ryder and Thomson1986; Osborn and Karlstrom, Reference Osborn and Karlstrom1989). We describe stratigraphic units and report radiocarbon ages on stumps and stems in growth position and layers of woody debris in the lateral moraines. To assess whether this evidence was driven by regional climate variability, we then compare this record with other records of glacial expansion from Patagonia.
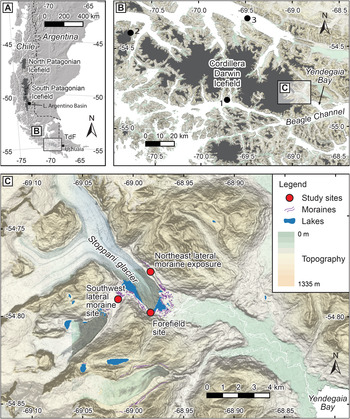
Tierra del Fuego is a large island in southernmost South America that is shared by Chile and Argentina (Fig. 1A). The southernmost portion of the Andes extends in a southeast direction across Tierra del Fuego and includes the Cordillera Darwin Range, which consists of schist and intrusive granitic rocks of Mesozoic age (Hervé et al., Reference Hervé, Fanning, Pankhurst, Mpodozis, Klepeis, Calderón and Thomson2010). The regional climate is strongly controlled by the location and strength of the westerlies (Garreaud et al., Reference Garreaud, Lopez, Minvielle and Rojas2013; Moreno et al., Reference Moreno, Vilanova, Villa-Martínez, Dunbar, Mucciarone, Kaplan and Garreaud2018). The climate of the region is cool and humid, with a mean annual temperature of 5°C and average annual rainfall of about 1500 mm in the southwest, decreasing to 300 mm in the northeast (Fick and Hijmans, Reference Fick and Hijmans2017). Precipitation is strongly influenced by zonal wind strength, which controls orographic uplift of moisture-laden air masses (Garreaud et al., Reference Garreaud, Lopez, Minvielle and Rojas2013). Nearly half the area of the Cordillera Darwin is covered by glacial ice, principally the Cordillera Darwin ice field (Fig. 1B) with an area of 2300 km2 (Bown et al., Reference Bown, Rivera, Zenteno, Bravo, Cawkwell, Kargel, Leonard, Bishop, Kääb and Raup2014). Forests of evergreen southern beech (Northofagus) occur below 700–800 m above sea level (m asl), and peat bogs are common in poorly drained areas (Musotto et al., Reference Musotto, Borromei, Bianchinotti, Coronato, Menounos, Osborn and Marr2017).
(color online) Location maps (A) Southern Chile and Argentina, showing location of Tierra del Fuego. (B) Southwestern Tierra del Fuego, showing the relation of the Cordillera Darwin ice field to the Beagle Channel. Stoppani Glacier is an outlet on the east edge of the ice field. Dots indicate the locations of (1) Bahia Pia (Kuylenstierna et al., Reference Kuylenstierna, Rosqvist and Holmlund1996), (2) Ema Glacier (Strelin et al., Reference Strelin, Casassa, Rosqvist and Holmlund2008), and (3) Almirantazgo Fjord coring site (Bertrand et al., Reference Bertrand, Lange, Pantoja, Hughen, Van Tornhout and Wellner2017). (C) Stoppani Glacier and associated lateral moraines, showing locations of study sites.

Stoppani Glacier is located 40 km west of the city of Ushuaia, Argentina, on the east side of the Cordillera Darwin (Fig. 1A and B). It is 11 km long, has an area of about 75 km2, and flows southeast from the flanks of Pico Frances (2150 m asl) and Pico Italia (2360 m asl) to its terminus at 100 m asl. Meltwater from Stoppani Glacier flows directly into Yendegaia Bay, an embayment in the Beagle Channel (Fig. 1B and C).
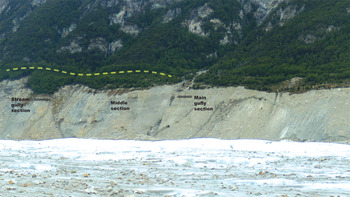
The glacier is flanked by large lateral moraines designated as “northeast” and “southwest,” respectively (Fig. 1C). Part of the proximal flank of the northeast moraine is well exposed above the modern glacier (Fig. 2). A 2-km-long, treed ridge extends parallel to, about 60 m above, and 100 m outside the northeast lateral moraine (Fig. 2). This landform appears to be an older lateral moraine, but we were unable to access it and so could not confirm its origin. Recession of the glacier has left a forefield characterized by many small, irregular lateral and end moraines impounding small lakes.
(color online) Photograph of part of the proximal flank of the northeastern lateral moraine of Stoppani Glacier, showing positions of the three sections studied. The stream gully and main gully sections are separated by about 250 m. Dashed line indicates the treed ridge outside the lateral moraine; it conceivably is an additional lateral moraine crest.

METHODS
We visited the terminus of Stoppani Glacier in December 2009 to document the past activity of the glacier. We searched for subfossil wood within the glacier's forefield and lateral moraines. A prominent 80-m-high, 250-m-long section of the northeast lateral moraine, 2.5 km from the glacier's terminus, provided sufficient exposure for detailed stratigraphic work (Figs. 1C and 2). Stratigraphic observations were made at three sites along the section, which are described in detail below. Northofagus forest extends from the crest of the moraine to treeline at about 550 m asl.
The southwest lateral moraine does not present useful exposures, but we collected one wood sample where the moraine partly crosses a tributary valley that supported a lake impounded by the glacier (Fig. 1C, “Southwest lateral moraine site”). The wood sample appears to be driftwood stranded on the crest when the lake drained. We also searched the glacier's forefield and collected wood samples from a site about 350 m downvalley from the snout of the glacier (Fig. 1C, “Forefield site”).
The stratigraphic section in the northeast moraine was photographed, described in the field, and divided into lithostratigraphic zones using the procedure and nomenclature of Eyles et al. (Reference Eyles, Eyles and Miall1983). We searched the section for tephras and plant macrofossils and excavated around the bases of stumps to ensure that they were in growth position. If we were unable to find a rooting horizon, we assumed the stump to be detrital. Sample locations were determined using a handheld GPS, and wood samples were bagged, labeled, and transported to the University of Northern British Columbia.
We submitted wood samples to the Keck Carbon Cycle Accelerator Mass Spectrometry (AMS) Facility at the University of California, Irvine. Radiocarbon ages were converted to calendar age ranges (2σ) before AD 1950 using CALIB 7.1 (Stuiver et al., Reference Stuiver, Reimer and Reimer2019) and the Southern Hemisphere Atmospheric Calibration Curve, SHCal13 (Hogg et al., Reference Hogg, Hua, Blackwell, Niu, Buck, Guilderson, Heaton, Palmer, Reimer, Reimer, Turney and Zimmerman2013). We report calibrated age ranges to the nearest 10 yr.
RESULTS
Stoppani Glacier forefield
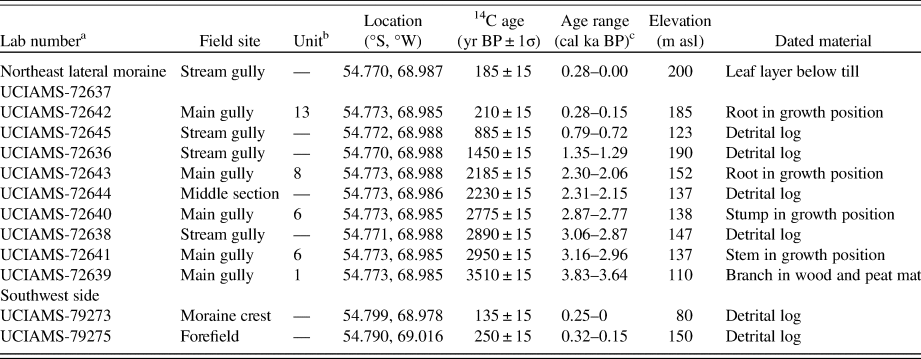
A sample of the outer rings of one of two short tree stems, 50–60 cm in diameter, at the forefield site (Fig. 1C) returned a radiocarbon age with a calibrated age range of 0.30–0.15 cal ka BP (Table 1). The stems extend upward through cobble gravel deposited during recent retreat of Stoppani Glacier. We were unable to fully excavate the stems to confirm that they are in growth position; but in any case, we consider 300 cal yr BP (the lower limit of the calibrated age range) to be a maximum age for an advance of Stoppani Glacier to within 350 m of its present terminus.
Radiocarbon ages.

a Radiocarbon laboratory: UCIAMS, Keck Carbon Cycle Accelerator Mass Spectrometry (AMS) Facility at the University of California, Irvine.
b Stratigraphic unit from main gully (see Fig. 3).
c Calibrated (ka) age ranges before present (AD 1950) converted from radiocarbon ages using CALIB 7.1 and the calibration curve SHCal13 (Stuiver et al., Reference Stuiver, Reimer and Reimer2019) with 2σ uncertainties. Samples converted with the South American terrestrial calibration data set (Hogg et al., Reference Hogg, Hua, Blackwell, Niu, Buck, Guilderson, Heaton, Palmer, Reimer, Reimer, Turney and Zimmerman2013).
Southwest lateral moraine crest
Outer rings from a highly weathered wood fragment lacking bark at the southwest lateral moraine site returned a radiocarbon age with a calibrated age range of 0.25–0 cal ka BP (Table 1). The wood was found on the surface of the southwest lateral moraine of Stoppani Glacier near its crest.
Northeast lateral moraine stratigraphy
The section of the northeast lateral moraine reveals multiple diamictons separated by units of stratified sediment and beds of organic material. The lowest exposure was about 20 m above the surface of Stoppani Glacier at the time of our visit. Stratigraphy was logged at the informally named “main gully,” “middle section,” and “stream gully” sites.
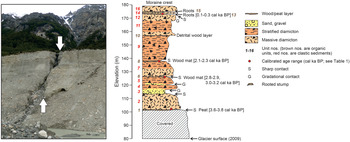
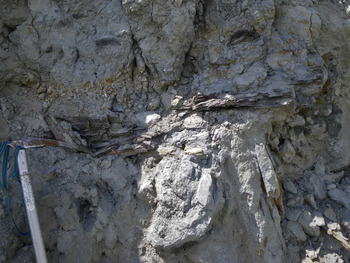
We recognize 16 stratigraphic units at the main gully site, numbered 1 through 16 from bottom to top (Fig. 3). We were able to trace the units upvalley to the middle section and stream gully sites. The dominant units (2, 4, 5, 7, 9, 11, 12, 14, and 16) are massive to weakly stratified, matrix-supported diamictons that differ from one another largely in terms of average or maximum grain size. Clasts range up to boulder size and are subangular to rounded; many of the clasts are striated and faceted. The matrix of these units consists primarily of sand, granules, and small pebbles. With one exception (unit 2), weak stratification dips gently downvalley. Most of the diamicton units are separated by thin, wood-rich layers containing logs, branches, and roots, and, in one case, stumps in growth position (units 1, 6, 8, 13, and 15) (e.g., Fig. 4). Diamicton units 9 and 11, however, are separated by a detrital woody layer lacking evidence of a rooting horizon (unit 10), and diamicton units 2 and 4 are separated by a unit of horizontally stratified sand and sandy gravel (unit 3) that does not contain wood fragments.
(color online) Stratigraphy of the main gully section from the northeastern lateral moraine of Stoppani Glacier. Elevations are relative to sea level. All ages are reported as cal ka BP (Table 1).

Example of part of a wood mat separating diamictons in the lateral moraines. This is unit 8 in the stratigraphic section shown in Fig. 3. Ice axe shown for scale.

We obtained radiocarbon ages on 10 samples of plant macrofossils from the northeast lateral moraine: four samples of wood in growth position (two samples of roots, one stem, and one stump); one sample of leaves; a branch from a compressed wood and peat mat; and four samples of detrital wood (Table 1). The ages range from 3.83–3.64 cal ka BP to 0.28–0 cal ka BP and decrease up-section, with one exception at the stream gully site (Fig. 3; Table 1).
The stratigraphy and radiocarbon ages provide evidence for thickening, and presumably advances, of Stoppani Glacier during the past 4000 years. The vegetated ridge outside the northeast lateral moraine (Fig. 2) probably marks the maximum extent of Stoppani Glacier in Holocene/latest Pleistocene time, but its age is unknown. Outermost cirque moraines in the vicinity of Stoppani date to the latest Pleistocene (Menounos et al., Reference Menounos, Clague, Osborn, Davis, Ponce, Goehring, Maurer, Rabassa, Coronato and Marr2013b), but the position of the vegetated ridge beyond the stratigraphic section we studied does not ensure that it is older than any but the uppermost unit in the section (for a similar situation, see Menounos et al. [Reference Menounos, Clague, Clarke, Marcott, Osborn, Clark, Tennant and Novak2013a]).
Near the base of the main gully section a massive, sandy diamicton with clasts up to 2 m across (unit 2) dips gently toward Stoppani Glacier and overlies peat with roots in growth position (unit 1). We interpret this diamicton to be either glaciogenic debris flow sediments or till deposited when Stoppani Glacier overrode a vegetated surface. A branch within the sub-till peat mat yielded an age of 3.83–3.64 cal ka BP, which is a maximum age for a possible advance during which time Stoppani Glacier reached at least 20 m above its 2009 surface.
Sand and gravel of unit 3 unconformably overlies unit 2 in the main gully section. We interpret unit 3 to be glaciofluvial sediments deposited by a meltwater stream flowing along the margin of Stoppani Glacier. The presence of cobbles within the sand implies ice-proximal deposition at a time when the glacier reached the elevation of the top of unit 3 at the main gully site. Notwithstanding the erosional contact between units 2 and 3, it is unclear whether the latter was deposited during the 3.83–3.64 cal ka BP advance or during a later advance. However, unit 3 is overlain by matrix-supported diamicton with striated clasts (unit 4), indicating that Stoppani Glacier later reached at least 40 m above its 2009 level (i.e., to the top of unit 4).
After Stoppani Glacier deposited unit 4, it thinned enough that 20 cm of laminated silt and sand accumulated on the proximal slope of the moraine. Subsequently, the glacier thickened again and deposited diamicton (unit 5) at the main gully site; correlative sediments are also present in the middle section and stream gully sites. This thickening, and presumably an advance of the glacier, happened before 2.87–2.77 cal ka BP based on a radiocarbon age on outer rings of a stump in growth position recovered from unit 6 (Fig. 3; Table 1). Outer rings of a detrital log in unit 6 yielded a slightly older age (3.16–2.96 cal ka BP), and a similar age was obtained from a detrital wood mat at the top of unit 5 at the stream gully site (3.06–2.89 cal ka BP). These ages support the argument that Stoppani Glacier was thickening and advancing shortly before about 3.0 cal ka BP.
The peat and wood mat of unit 6 was buried by unit 7 diamicton when Stoppani Glacier advanced after 2.9 cal ka BP. The lower half of unit 7 is massive, whereas the upper half is weakly stratified. The unit was deposited when Stoppani Glacier thickened to at least 55 m above its elevation in 2009.
Roots in growth position within the peat and wood mat of unit 8 at the main gully site returned a calibrated age of 2.30–2.06 cal ka BP, which is a maximum age for a fifth documented advance of Stoppani Glacier. Wood from the middle section returned a similar age of 2.31–2.15 cal ka BP. During this fifth advance, Stoppani Glacier thickened and deposited stratified diamicton (unit 9, the thickest exposed diamicton unit) at the main gully site and correlative units at the middle section and stream gully sites.
The presence of a detrital wood layer (unit 10) at the contact between units 9 and 11 at the main gully site may indicate that Stoppani Glacier again thickened and advanced into forest sometime after 2.30–2.06 cal ka BP. The age of a piece of detrital wood collected from till near the top of the stream gully section suggests that this advance happened sometime after 1.35–1.29 cal ka BP. It is also possible that after 2.30 cal ka BP, Stoppani Glacier thickened and advanced in stages, with short periods of stability before the glacier reached its maximum extent less than 280 yr ago. The lack of wood mats, soils, and wood in growth position, however, make the interpretation of this detrital wood equivocal (cf. Ryder and Thomson, Reference Ryder and Thomson1986).
Detrital wood low in the section in the stream gully, which returned a calibrated age of 0.79–0.72 cal ka BP, may have been deposited as an inset into the northeast lateral moraine during a minor advance early in the Little Ice Age. Although vertical stacking of tills is the most common way that composite lateral moraines are created, there are documented cases in northwest North America of younger tills inset into the proximal flank of an older lateral moraine that were overridden by a later advance (e.g., Osborn, Reference Osborn1986).
A calibrated radiocarbon age of 0.28–0.15 cal ka BP was obtained from the root of a stump in growth position within a thin peat layer (unit 13) at the contact between diamicton units 12 and 14 at the main gully section, indicating that the glacier thickened to at least 100 m above the 2009 glacial surface less than 300 yr ago. Another thin peat layer (unit 15), 1 m above the dated horizon, separates units 14 and 16 (the two highest diamicton units). Although this uppermost peat layer is not dated, leaves within rhythmically laminated silt below the surface till at the stream gully site returned an age of 0.28–0 cal ka BP. The inclined tree stem in the forefield at the southwest side of the glacier also returned a similar age (0.30–0.15 cal ka BP), suggesting that the trees from which these youngest dated samples came were killed during the final advance of Stoppani Glacier about 0.30–0.20 cal ka BP.
Details of the time of retreat of Stoppani Glacier from this limit is unknown, but it appears that the glacier retreated in stages. Evidence for this comes from a series of about 20 closely spaced, successively lower recessional moraines nested within the southwest lateral moraine at the mouth of the tributary valley (for location, see Fig. 1C). The stream draining from this tributary valley cuts across and through the recessional moraines. It became established when the glacier-dammed lake in the tributary valley drained during the twentieth century. Examination of aerial photographs shows that the lake was full in AD 1945, whereas imagery from the Landsat MSS sensor reveals that it was only partly filled in AD 1972.
DISCUSSION
Other Neoglacial records from southernmost Patagonia
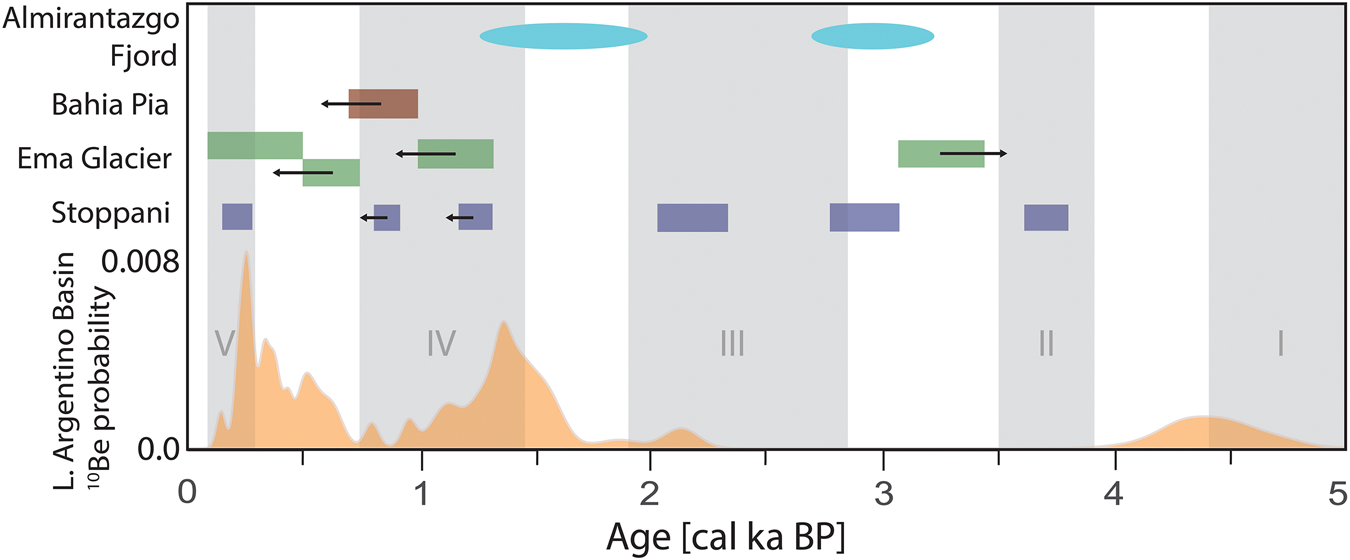
The lateral moraine stratigraphy and associated radiocarbon ages from Stoppani Glacier reveal that the glacier thickened and underwent general, but episodic, expansion over the past 4000 years. Here we compare our chronology with other reports of glacial activity in southernmost Patagonia with firm chronologic control. To constrain our comparison to an area presumed to have similar climate, we limit the discussion mainly to sites in the South Patagonian ice field and Cordillera Darwin, although one study (Aniya, Reference Aniya2013) summarizes glacial fluctuations for the entire Patagonian ice field (Fig. 5).
Lake Holocene evidence for glacial fluctuations, southernmost Patagonia. Gray vertical bars with Roman numerals represent times of Neoglacial activity (Aniya, Reference Aniya2013), and orange curve denotes 10Be probability distribution of boulder ages from end moraines in the Lago Argentino basin (Kaplan et al., Reference Kaplan, Schaefer, Strelin, Denton, Anderson, Vandergoes and Finkel2016). The 10Be probability distribution represents 78 ages between 7.8 and 0.14 cal ka and scaled so that the area under the curve is unity. Blue, green, and brown rectangles represent age ranges (±2 σ) ascribed to advances of Stoppani Glacier (this study), Ema Glacier (Strelin et al., Reference Strelin, Casassa, Rosqvist and Holmlund2008), and ice sourced from the head of Bahia Pia (Kuylenstierna et al., Reference Kuylenstierna, Rosqvist and Holmlund1996), respectively. Left- and right-pointing arrows denote maximum and minimum limiting ages, respectively. Cyan ellipses denote times of glacial wastage inferred from intervals of glacigenic sediments from Almirantazgo fjord (Bertrand et al., Reference Bertrand, Lange, Pantoja, Hughen, Van Tornhout and Wellner2017). (For interpretation of the references to color in this figure legend, the reader is referred to the web version of this article.)

The first systematic study of Patagonian glacial history is that of Mercer (Reference Mercer1976, Reference Mercer1982), although his scheme of Neoglaciation has been superseded by later work (see Aniya, Reference Aniya2013). The first study in the Cordillera Darwin is that of Kuylenstierna et al. (Reference Kuylenstierna, Rosqvist and Holmlund1996). They report radiocarbon ages on peat and wood in the area of Bahia Pia at the south edge of the Cordillera Darwin, about 45 km west of Stoppani Glacier (Fig. 1). Unfortunately, almost all their ages were obtained from bulk peat, which is difficult to date accurately. Shore et al. (Reference Shore, Bartley and Harkness1995) outline problems of dating peat, and Brock et al. (Reference Brock, Lee, Housley and Bronk Ramsey2011) report that different fractions of a single peat bed yielded radiocarbon ages that differ by up to 1500 yr. We regard the peat ages of Kuylenstierna et al. (Reference Kuylenstierna, Rosqvist and Holmlund1996) as minimum limiting ages for overlying sediments; more importantly, because the dated peats are not associated with diamictons that they interpret to be till, we omit them from further consideration. One wood sample below a till unit, however, provides a maximum limiting age of 0.93–0.68 cal ka BP for a glacial advance west of Bahia Pia (Fig. 5). Kuylenstierna et al. (Reference Kuylenstierna, Rosqvist and Holmlund1996) found no evidence of an advance during the seventeenth to nineteenth centuries, but this maximum limiting age suggests that the glacier was advancing during the first half of the last millennium.
Strelin et al. (Reference Strelin, Casassa, Rosqvist and Holmlund2008) examined stratigraphic evidence for glacial fluctuations in the Ema Valley of the Monte Sarmiento Massif, 75 km west of Bahia Pia (Fig. 1). Based on radiocarbon ages on detrital wood within and between tills, they conclude that in the past few millennia, glaciers advanced sometime before 3.46-3.07 cal ka BP, at 1.30-0.98 cal ka BP, and shortly after 0.72-0.53 cal ka BP. A fourth advance is bracketed between 0.52 cal ka BP and a dendrochronological age of 60 yr (Fig. 5). Although Strelin et al. (Reference Strelin, Casassa, Rosqvist and Holmlund2008) regard the ages of their middle two advances as more or less absolute, the dates are on detrital wood and can thus only provide maximum limiting ages for overlying till. Strelin et al. (Reference Strelin, Casassa, Rosqvist and Holmlund2008) state that tills recording the three oldest advances are associated with “external moraines” about 2–2.5 km from present glacial fronts and that tills associated with Little Ice Age advances are related to “internal moraines” located about 1 km from present glacial fronts. The implication is that there was an overall net decrease in glacial size over the past few millennia.
Aniya (Reference Aniya2013) suggests that Patagonian glaciers expanded during five intervals (Fig. 5): 5.13–4.43 cal ka BP, 3.85–3.49 cal ka BP, 2.77–1.91 cal ka BP, 1.45–0.75 cal ka BP, and 0.35–0.05 cal ka BP. They consider the fourth of these advances as being somewhat tenuous.
Kaplan et al. (Reference Kaplan, Schaefer, Strelin, Denton, Anderson, Vandergoes and Finkel2016) applied 10Be dating to Holocene moraines in the Lago Argentino basin on the east edge of the Southern Patagonian ice field (Fig. 5). They conclude that Neoglacial moraine-building events occurred at 4.45 ± 0.22, 1.45 ± 0.11, 0.36 ± 0.03, and 0.24 ± 0.02 ka. They further conclude that: (1) the greatest Holocene extents were in mid-Holocene time, about 6.1–4.5 ka rather than during the past several hundred years, as recognized for most glaciers in the Northern Hemisphere (Davis et al., Reference Davis, Menounos and Osborn2009); and (2) over the past few millennia, small-scale advances/retreats were superimposed on a long-term net decrease in glacier size.
Finally, Bertrand et al. (Reference Bertrand, Lange, Pantoja, Hughen, Van Tornhout and Wellner2017) reconstruct glacial fluctuations in the Cordillera Darwin from glacigenic sediments in Almirantazgo fjord on the north side of the range (Fig. 1). They used sedimentology and geochemistry of the sediments to infer Neoglacial advances and recessions of source glaciers. Based on the physical properties of the sediments, the authors identify two major intervals of glacial retreat, one at 3.25–2.70 cal ka BP and another at 2.0–1.2 cal ka BP. These intervals follow, respectively, Aniya's (Reference Aniya2013) second and third events (Fig. 5).
Comparisons to Stoppani Glacier
The earliest documented glacial expansion at Stoppani Glacier, at 3.83–3.64 cal ka BP, corresponds with Aniya's (Reference Aniya2013) second Neoglacial event. Ema Glacier may also have advanced during this interval. The lack of moraines of this age at Lago Argentino again could be due to being overrun by latest Holocene glaciers.
The advance of Stoppani Glacier at about 3 cal ka BP falls just outside the older limit of Aniya's third Neoglacial advance and within a meltwater event in Almirantazgo fjord. There are no correlative moraines adjacent to Lago Argentino (Kaplan et al., Reference Kaplan, Schaefer, Strelin, Denton, Anderson, Vandergoes and Finkel2016). The Stoppani Glacier evidence is robust, consisting of a sheared in situ stump and a maximum limiting age from a detrital log in unit 6. An advance of this age at Lago Argentino cannot be precluded—if the latest Holocene advances were more extensive than an advance at 3 ka, evidence of the latter would be overrun and possibly eliminated. The till at Ema Glacier that appears to date to the time between Aniya's (Reference Aniya2013) second and third Neoglacial events has a minimum limiting age and thus may or may not actually fall within that interval.
A number of moraines in the Lago Argentino basin (Kaplan et al., Reference Kaplan, Schaefer, Strelin, Denton, Anderson, Vandergoes and Finkel2016) date to between 1.5 and 1.2 cal ka BP, within Aniya's (Reference Aniya2013) fourth advance. Corresponding ages at Stoppani and Ema Glaciers are maximum limiting ages (Fig. 5), but may indicate advances at this time. A meltwater event in Almirantazgo fjord (Bertrand et al., Reference Bertrand, Lange, Pantoja, Hughen, Van Tornhout and Wellner2017Fig. 5) approximately corresponds to the interval between Aniya's third and fourth Neoglacial advances, and moraines in Lago Argentino date to the latter part of that interval. Stoppani Glacier and glaciers in the vicinity of Lago Argentino also expanded between 2.3 and 2.0 cal ka BP; these advances fall within Aniya's (Reference Aniya2013) third phase of Neoglaciation.
There is evidence of one or more advances of Ema Glacier and Lago Argentino between 0.75 and 0.4 cal ka BP, but the evidence for an advance of Stoppani Glacier at this time is equivocal. A detrital log from the stream gully section at Stoppani Glacier yielded an age of 0.79–0.72 cal ka BP (Table 1), and it is possible that the till above the undated wood layer of unit 10 (Fig. 3) dates to that time.
Stoppani and Ema Glaciers and glaciers in the proximity of the Lago Argentino basin expanded during the period 0.5–0.2 cal ka BP, within the interval of Aniya's (Reference Aniya2013) fifth advance (Fig. 5). At Stoppani Glacier the advance that began 0.3–0.2 cal ka BP was the most extensive of the past 4000 years, but this apparently was not the case for Ema Glacier (Strelin et al., Reference Strelin, Casassa, Rosqvist and Holmlund2008) or for glaciers around the Lago Argentino basin (Kaplan et al., Reference Kaplan, Schaefer, Strelin, Denton, Anderson, Vandergoes and Finkel2016). Bertrand et al. (Reference Bertrand, Lange, Pantoja, Hughen, Van Tornhout and Wellner2017) do not report a major interval of glacigenic sedimentation within Almirantazgo fjord at this time, although they do infer a lesser meltwater event dating to the past several hundred years. The lack of a moraine dating to the period 0.5–0.2 cal ka BP at Bahia Pia is enigmatic; a till appears to be younger than the several-hundred-year-old wood it encloses, but there is no associated moraine.
The best correspondence of times of advance among the different records is within the past 1500 years. Poorer correspondence before that is, no doubt, at least partly due to preservation issues; it is unlikely that a complete record is to be found at any one site. Some of the differences may stem from the different dating approaches. End moraine ages tell us when advances culminated, not when they started or how long they lasted. Sheared stump ages indicate when advances were in progress but not when they started or ended. Detrital wood may bracket the age of a till, but alternatively may provide only a maximum age. Researchers might thus assign different ages to the same advance depending on whether evidence comes from end moraines or from lateral moraine stratigraphy. More insight into these issues could be gained by combining lateral moraine stratigraphy with terrestrial cosmogenic nuclide dating of moraines at a given site.
In summary, the Stoppani Glacier chronology is similar to the regional record of ice expansion in southernmost Patagonia, but differs in two important ways. First, we have strong evidence for an advance of Stoppani Glacier at about 3 cal ka BP, whereas Aniya (Reference Aniya2013) recognizes no regional advances, and Bertrand et al. (Reference Bertrand, Lange, Pantoja, Hughen, Van Tornhout and Wellner2017) report an interval of glacigenic sedimentation that they attribute to retreat of the Cordillera Darwin glaciers. Our age range (3.16–2.77 cal ka BP) for this advance overlaps the onset of Aniya's (Reference Aniya2013) third phase of Neoglaciation (Fig. 5), so the Stoppani record may indicate an earlier onset for this third Neoglacial phase. Furthermore, glacigenic sedimentation commonly coincides with times of rapid ice expansion (Leonard, Reference Leonard1997; Osborn et al., Reference Osborn, Menounos, Koch, Clague and Vallis2007), so it is possible that the intervals of glacigenic sedimentation described by Bertrand et al. (Reference Bertrand, Lange, Pantoja, Hughen, Van Tornhout and Wellner2017) could coincide with times of regional glacial advance rather than retreat. The second difference relates to progressive thickening and, by inference, expansion of Stoppani Glacier over the past 4000 years, which culminated during the past few hundred years. This pattern of progressive, long-term glacial expansion is similar to the glacial record from most sites in the Northern Hemisphere (Davis et al., Reference Davis, Menounos and Osborn2009). In contrast, Ema Glacier and glaciers in the Lago Argentino Basin do not do not show this pattern, but rather display a net decrease in glacial extent over the past 4000 years. This significant difference is enigmatic and complicates comparison of Northern and Southern Hemisphere climates. Additional work is needed to better understand the origin of these differences.
CONCLUSIONS
Our study of Stoppani Glacier during the late Holocene broadens, but also renders more complex, our understanding of Holocene glacial activity in southern Patagonia. Stacked layers of tills with intercalated organic-rich horizons in the northeast lateral moraine show that the glacier expanded and contracted multiple times during the past 4000 years; these advances were superimposed on a general trend of glacial expansion. Stoppani Glacier advanced shortly before 3.8–3.6, 3.2–2.8, 2.3–2.1, and 0.3–0.2 cal ka BP, and possibly sometime before 1.4–1.3 and 0.8–0.7 cal ka BP. These advances culminated with the climactic advance at 0.3–0.2 cal ka BP, when the glacier constructed a prominent end moraine, marking its greatest extent of the past 4000 years. This history of glacial activity accords with histories derived from glaciers in the Northern Hemisphere but differs from some sites in southernmost Patagonia. The relatively detailed record obtained at Stoppani Glacier illustrates the utility of lateral moraine stratigraphy. Our record also introduces a complication in the comparative analysis of glacial histories in Patagonia, because chronological studies of lateral moraine stratigraphy and end moraine dating do not necessarily measure the same thing.
ACKNOWLEDGMENTS
We thank the National Sciences and Engineering Research Council (NSERC) and the Canada Research Chairs Program for funding this research. Andres Rivera kindly provided scanned aerial photographs of Stoppani Glacier from 1945, and Christopher Darvill helped draft our study area map. We thank Brian Luckman, Sebastien Bertrand, and journal editors Thomas Lowell and Derek Booth for comments that substantially strengthened our paper.