INTRODUCTION
The glutenin macropolymer (GMP) has been reported to be more sensitive to changes in environmental conditions and cultivation practices than the total protein quantity (Don et al. Reference Don, Lookhart, Naeem, Macritchie and Hamer2005; Spiertz et al. Reference Spiertz, Hamer, Xu, Primo-martin, Don and Van der Putten2006). Previous studies have demonstrated that GMP is a very important protein polymer in wheat grain and flour. It correlates with baking quality of flour (Tronsmo et al. Reference Tronsmo, Faergestad, Longva, Schofield and Magnus2002) and GMP particle size correlates strongly with dough development time (Don et al. Reference Don, Lichtendonk, Plijter and Hamer2003a, Reference Don, Lichtendonk, Plijter and Hamerb). Both quality and quantity of gluten protein are important for processing quality. Variation in protein content alone cannot account for differences in dough properties and end-use quality across genotypes and environments (Zhu & Khan Reference Zhu and Khan2001; Zhang et al. Reference Zhang, He, Zhang, Xia, Liu, Yan and Zhang2007). Polymerization of gluten proteins should be strongly conducive to dough elasticity and improve bread-making quality (Steffolani et al. Reference Steffolani, Perez, Ribotta, Puppo and Leon2008). The glutenin fraction is insoluble in various solvents (sodium dodecyl sulphate (SDS) or acetic acid) (Weegels et al. Reference Weegels, van de Pijpekamp, Graveland, Hamer and Schofield1996, Reference Weegels, Hamer and Schofield1997). Glutenin macropolymer is the SDS insoluble fraction consisting of spherical glutenin particles (Don et al. Reference Don, Lichtendonk, Plijter and Hamer2003a, Reference Don, Lichtendonk, Plijter and Hamerb). Besides GMP content, GMP particle size distribution is another important factor in unravelling wheat bread-making quality (Dupont & Altenbach Reference Dupont and Altenbach2003; Don et al. Reference Don, Lookhart, Naeem, Macritchie and Hamer2005). Evidence from various studies has indicated that SDS non-extractable polymeric protein (UPP) and percent SDS non-extractable polymeric protein in total polymeric protein (%UPP) are crucial in giving gluten its strength and bread-making potential when compared with the total amount of polymeric protein (Gupta et al. Reference Gupta, Khan and Macritchie1993; el Haddad et al. Reference el Haddad, Aussenac, Fabre and Sarrafi1995; Weegels et al. Reference Weegels, van de Pijpekamp, Graveland, Hamer and Schofield1996; Fu & Kovacs Reference Fu and Kovacs1999). Moreover, Zhang et al. (Reference Zhang, He, Zhang, Xia, Chen and Zhang2008) showed that UPP and %UPP are influenced largely by environment and less by genotype. Both Jia et al. (Reference Jia, Fabre and Aussenac1996) and Zhu & Khan (Reference Zhu and Khan2002) reported significant variation in the size distribution of polymeric proteins across different environments and as a result variation in dough properties and bread-making quality. Wang et al. (Reference Wang, Zhu, Khan, O'Brienand and Chen2004) reported that the size distribution of GMP is one of the significant factors in determining the breadmaking quality of different cultivars.
Glutenin macropolymer is mainly composed of high-molecular-weight glutenin subunits (HMW-GS) and low-molecular-weight glutenin subunits (LMW-GS) linked by disulphide bonds (Lindsay & Skerritt Reference Lindsay and Skerritt1999; Goesaert et al. Reference Goesaert, Brijs, Veraverbeke, Courtin, Gebruers and Delcour2005). High-molecular-weight glutenin subunits play an important role in determining the glutenin protein network structure (Don et al. Reference Don, Mann, Bekes and Hamer2006) and LMW-GS may also have a specific effect on glutenin aggregation (Veraverbeke et al. Reference Veraverbeke, Larroque, Bekes and Delcour2000a, Reference Veraverbeke, Larroque, Bekes and Delcourb; DuPont & Altenbach Reference Dupont and Altenbach2003; D'Ovidio & Masci Reference D'ovidio and Masci2004). Previous studies have clearly shown that the composition and quantity of HMW-GS and LMW-GS determine most of the dough properties and end-use quality (Wieser & Kieffer Reference Wieser and Kieffer2001; Liu et al. Reference Liu, He, Yan, Zhang, Xia and Pena2005).
High-molecular-weight glutenin subunits are encoded by the polymorphic genes at the Glu-1 loci on the long arms of the group 1 chromosomes, which encode subunits of 1, 2* or null (Glu-A1 loci), 6, 7, 8, 9, 13, 14, 15, 16, 17, 18, 19, 20, 21, 22 (Glu-B1 loci) and 2, 3, 4, 5, 10, 12 (Glu-D1 loci) (Payne et al. Reference Payne, Law and Muddy1980). Hexaploid wheat usually contains three to five subunits, zero or one encoded by Glu-A1, one or two by Glu-B1 and two by Glu-D1. Many investigators have demonstrated strong effects of cultivation treatments on accumulation of HMW-GS and GMP in wheat (Triboi et al. Reference Triboi, Abad, Michelena, Lloveras, Ollier and Daniel2000; DuPont et al. Reference Dupont, Hurkman, Vensel, Tanaka, Kothari, Chung and Altenbach2006; Yue et al. Reference Yue, Qin, Dai, Jing, Cao and Jing2006, Reference Yue, Jiang, Dai, Qin, Jing and Cao2007; Deng et al. Reference Deng, Tian, Zhao, Zhang and Sun2008; Jiang et al. Reference Jiang, Yue, Wollenweber, Tan, Mu, Mu, Bo, Dai, Jing and Cao2009). Phosphorus (P) is one of the most widely occurring nutrients in the development and growth of wheat and has an important role to play in both protein (Zhao et al. Reference Zhao, He and Liu2004) and starch synthesis (Ni et al. Reference Ni, Wang, Yin, Li, Yan and Cai2012). It has been reported that P deficiency reduces the leaf expansion rate, decreases the number of tillers and increases the thermal time between the emergence of successive leaves, thus influencing the amount of solar radiation intercepted (Zheng Reference Zheng1992). Lazaro et al. (Reference Lazaro, Abbate, Cogliatti and Andrade2010) reported that P deficiency resulted in a reduction in intercepted radiation during spike/ear growth, thus causing a reduction in grain number and crop yield. A high P use efficiency has also been shown to result in increased leaf area index, chlorophyll content, photosynthetic rate and stable acid phosphatase activity to accumulate more dry matter after anthesis, which increased grain yield and grain quality of weak-gluten wheat (Zhu et al. Reference Zhu, Li, Jiang, Huang, Feng, Guo and Peng2012). To the present authors’ knowledge, a few studies are available on the effects of phosphorus on GMP content, HMW-GS content and GMP size distribution.
The objective of the current study was to analyse the effect of P on GMP content, HMW-GS content and GMP size distribution in winter wheat. The insights may give guidance to improve the quality of winter wheat by both breeding and fertilization.
MATERIALS AND METHODS
Experimental design
Field experiments were carried out in the growing seasons from October 2008 to June 2009 and from October 2009 to June 2010 at Tai'an Experimental Station of Shandong Agricultural University, Tai'an, China (36°09′N, 117°09′E; 128 m a.s.l.). The soil was a sandy loam, and the 0–20 cm soil layer contained 123 g/kg organic matter and available N–P–K of 87·2, 18·6 and 57·5 mg/kg, respectively. Maize (Zea mays L.) was the previous crop grown in both seasons. Four P fertilization treatments were applied: 0 kg P2O5/ha (P0), 40 kg P2O5/ha (P1), 100 kg P2O5/ha (P2) and 160 kg P2O5/ha (P3). Two urea (N) fertilizer levels 112·5 kg N/ha (N1) and 225 kg N/ha (N2) were used and basal potassium (K) fertilizer was applied at a rate of 150 kg K2O/ha before planting. The cultivars were allocated to main plots and the fertilizer (P and N) treatments to subplots with three replications for each cultivar. The plot size was 3×3 m with ten rows (0·25 m between rows). Seeds were sown on 10 October in both years at a density of 180 seeds/m2. The plants were harvested on 7 June 2009 and 10 June 2010. Other cultural practices were followed according to the precise high-yielding cultivation system described by Yu (Reference Yu1990).
Two high-yielding winter wheat (Triticum aestivum L.) cultivars, Jimai20 with low P utilization efficiency (PUE) and Shannong12 with high PUE were used in the study (S. L. Wang, personal communication). At maturity, wheat grains were harvested by hand and dried at 70 °C for the analysis of GMP size distribution and determination of HMW-GS content.
Analysis of glutenin macropolymer in the grain
Glutenin macropolymer content was measured by the method of Weegels et al. (Reference Weegels, van de Pijpekamp, Graveland, Hamer and Schofield1996). In general, grain samples (50 mg) were suspended in 1 ml of 1·5 mg/g SDS solution and centrifuged at 15 500 g for 30 min at 20 °C. The N content of the sediment was measured with biuret reagent (Gornall et al. Reference Gornall, Bardawill and David1949) and was taken as the GMP content. This is presented as a proportion of grain dry weight.
Particle size distribution of glutenin macropolymer analysis
The method used to determine GMP particle size distribution was according to Don et al. (Reference Don, Lichtendonk, Plijter and Hamer2003a, Reference Don, Lichtendonk, Plijter and Hamerb) with some adaptations. Defatted flour (1·5 g) was suspended in 1·5 mol SDS/l and centrifuged twice at c. 80 000 g for 30 min at 20 °C in a Beckman L-60 ultracentrifuge equipped with a SW41 rotor. The supernatant was decanted and the gel-layer collected as GMP.
Glutenin macropolymer size distribution was determined using an LS13320 laser diffraction particle size analyser (Beckman Coulter, USA). About 0·1 g of GMP was weighed into the 10-ml Eppendorf tube and resuspended with 5 ml of 1·5 mol SDS/l solution. The gel was mixed with the solvent by briefly stirring with a spatula. Then the tube was sealed and placed on a roller-bank for 3 h at room temperature. The GMP suspension was transferred into the analyser's dispersion tank containing 1·5% SDS and its size was measured.
Quantification of high-molecular-weight glutenin subunit
Quantification of the HMW-GS was performed according to the methods of Liang et al. (Reference Liang, Yin, Cai, Yan, Li, Geng, Wang, Wu, Li and Wang2008) and Chen et al. (Reference Chen, Wang, Yin, Guo, Chen, Li, Wang, Wu, Ni, Cai, Yang and Cao2013). In brief, HMW-GS were first separated by SDS–polyacrylate gel electrophoresis (SDS–PAGE) according to Khan et al. (Reference Khan, Frohberg, Olson and Huckle1989). Here, a 40-mg grain sample was defatted with chloroform and then mixed with 1 ml of extraction buffer containing 62·5 mmol/l Tris–HCl (pH 6·8), 500 mg isopropyl/g, 50 mg SDS/g and 10 mg DTT/g. The mixture was incubated at room temperature for 30 min with continuous shaking, and then at 60 °C for 1 h followed by centrifugation at 10 000 g for 15 min. The supernatant was used for SDS–PAGE.
The dimensions of SDS–PAGE gel were 16×16 cm2 and 1 mm thick. The acrylamide concentration in the resolving gel was 100 and 40 mg/g in the stacking gel. Glutenin extract (20 μl) was loaded in each lane. After electrophoresis, the gel was stained with 0·5 μl/ml Coomassie Brilliant Blue B250 for 24 h and then destained in distilled water for 48 h. Thereafter, each band was cut separately from the gel, placed in an Eppendorf tube, and 1 ml of 500 μl isopropyl alcohol containing 30 mg SDS/g was added to the tube, which was incubated at 37 °C for 24 h until the gel cleared. The extraction was then monitored at 595 nm with a UV-2401 Shimadzu spectrophotometer (Shimadzu Corporation, Kyoto, Japan).
During preliminary electrophoresis, the wheat cultivars Chinese Spring (HMW-GS composition, null, 7+8, 2+12), Marquis (1, 7+9, 5+10) and Xiaoyan6 (1, 14+15, 2+12) were used as standards to identify HMW-GS types in the selected cultivar. During the quantification procedure, a standard protein (β-galactosidase from Escherichia coli, 116 kDa, Sigma, St. Louis, MO, USA) with given concentration was loaded separately in 20, 30 and 40 μl volumes to three lanes on the same gel, since its molecular weight is very close to the HMW-GS. The standard proteins were extracted and measured following the above-mentioned protocol to give a standard curve of known concentration of the standard protein v. absorbance, and content of each HMW-GS was then quantified.
Statistical analysis
All data were subjected to one-way analysis of variance (ANOVA) using the SPSS (version 18.0) statistical analysis procedures for completely randomized block designs. Correlation analysis was conducted between HMW-GS and GMP contents, and a t-test was used to check the significance.
RESULTS
Differences in experimental factors
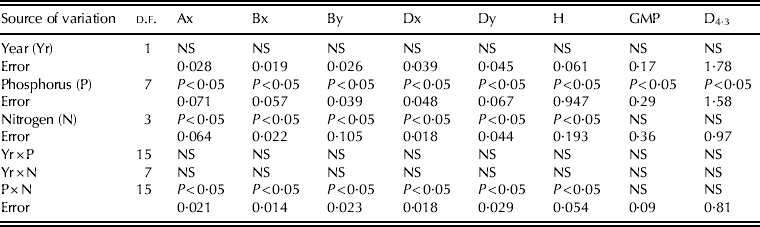
Analysis of variance for subunits (Ax, Bx, By, Dx and Dy), total HMW-GS content, GMP content and the weighted average volume of the GMP particles (D4·3) made it possible to identify the sources of variation (Table 1). The Student–Newman–Keuls tests (P⩽0·05) showed that those traits were affected significantly by P treatment (Table 1). Nitrogen rate and N×P interaction had no effect on GMP content and the weighted average volume of the GMP particles (D4·3) (Table 1). Although the P rate and N×P interaction were not significantly different for the two cultivars, the P rate was important to determine the GMP content and the weighted average volume of the GMP particles (D4·3). Variations due to year (Yr) and both Yr×P and Yr×N interactions were not significant (P⩽0·05) (Table 1). Since year did not show a significant effect on any of the parameters studied, the data presented in the text relates to the 2008/09 growing season.
Analysis of variance for the subunit contents, high-molecular-weight glutenin subunits (H) and glutenin macropolymer (GMP) in grain

H, high-molecular-weight glutenin subunits; D4·3, the weighted average volume of GMP particles;
NS, not significant.
Individual high-molecular-weight glutenin subunit content and total high-molecular-weight glutenin subunit content
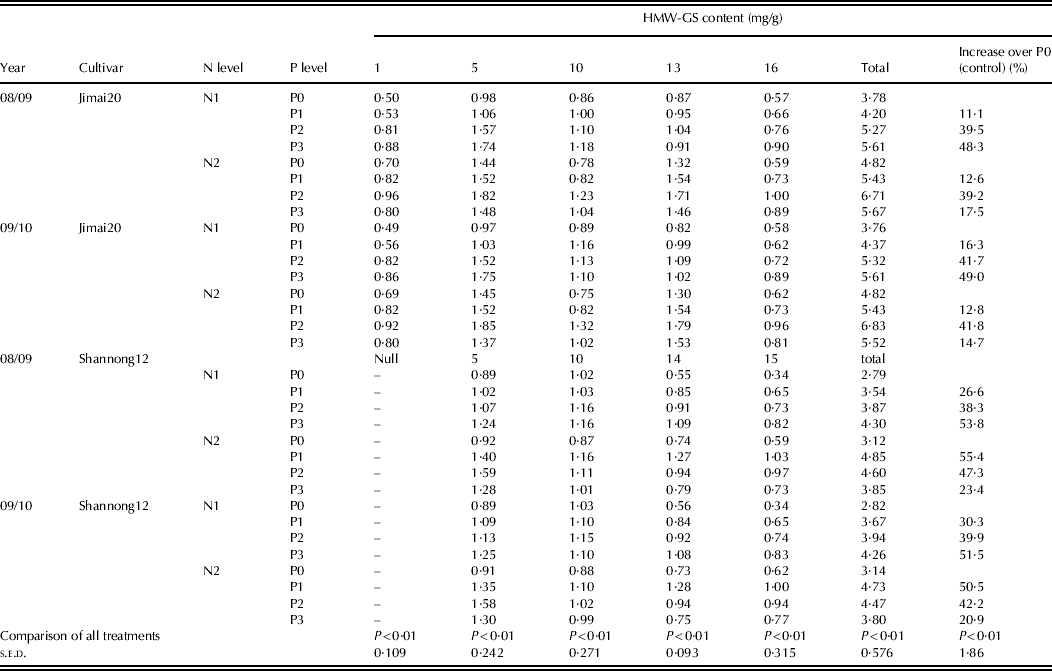
Phosphorous generally increased the total HMW-GS content in the two cultivars, although different patterns in response to P level were observed between the two N conditions (Table 2). Total HMW-GS content increased with increasing P rate from 0 to 160 kg/ha under N1, but under N2 the highest content was seen at a P rate of 100 kg/ha for Jimai20 and 40 kg/ha for Shannong12, respectively. For cultivar Jimai20, individual HMW-GS content (except subunit 13) increased with increasing P rate from 0 to 160 kg/ha under N1, whereas the content of subunit 13 increased in response to P rate from 0 to 100 kg/ha then decreased when P rate was increased to 160 kg/ha. Under N2 conditions, individual HMW-GS content increased in response to P rate from 0 to 100 kg/ha and decreased at a P rate of 160 kg/ha for Jimai20. For Shannong12, individual HMW-GS content also increased with increasing P rate from 0 to 160 kg/ha under N1 conditions, but showed the highest content at a P rate of 40 kg/ha under N2 conditions. This showed that the higher P rate of 160 kg/ha favoured the accumulation of HMW-GS in both cultivars under low N conditions. However, under N2 conditions, the P rate of 100 kg/ha favoured the HMW-GS in the low-P-use efficiency cultivar Jimai20, while a P rate of 40 kg/ha was more beneficial in the high-P-use efficiency cultivar Shannong12.
Effect of phosphorus fertilizer on high-molecular-weight glutenin subunit (HMW-GS) content in wheat grains (d.f.=47)
N1, nitrogen rate of 112·5 kg N/ha; N2, 225 kg N/ha.
P0, no phosphorus; P1, 40 kg P2O5/ha; P2, 100 kg P2O5/ha; P3, 160 kg P2O5/ha.
Data are the average of three measurements.
At a P level of 0 kg/ha, less HMW-GS were synthesized under N1 than under N2 conditions, and a similar pattern was also observed at P1 and P2. In contrast, at the P3 level, more HMW-GS were synthesized under N1 than under high N fertilizer (N2), showing that a balanced supply of P and N fertilizer favoured HMW-GS synthesis.
Effects of phosphorus on glutenin macropolymer content in grains
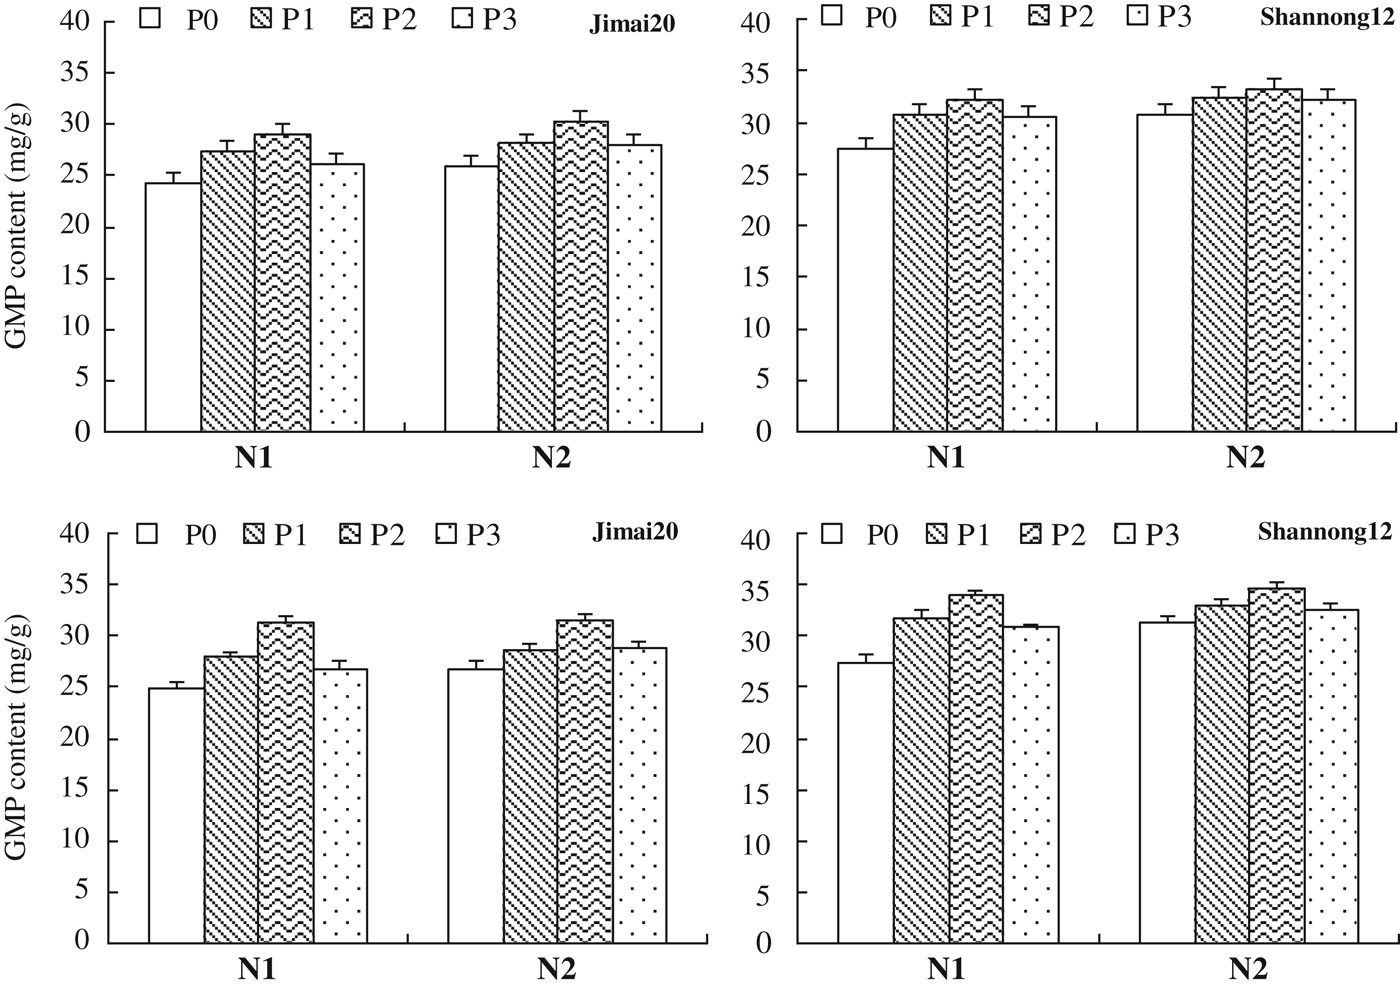
Glutenin macropolymer content in grains of the two cultivars at maturity showed a similar pattern in response to P rate under the two N conditions (Fig. 1). Phosphorous generally increased GMP content as the P rate was increased from 0 to 100 kg/ha, and then decreased GMP content as the P rate was further increased to 160 kg/ha. This indicated that P generally favoured GMP content up to a level of 100 kg/ha, whereas excessive P (160 kg/ha) decreased GMP content.
Effects of phosphorus on the glutenin macropolymer (GMP) content in grains of Jimai20 (left) and Shannong12 (right) in growing seasons 2008/09 (top) and 2009/10 (bottom). N1 and N2 represent low and high nitrogen conditions, respectively. Control (P0), P1, P2 and P3 represent phosphorus application rates of 0, 40, 100 and 160 kg/ha, respectively.
Size distribution of glutenin macropolymervolume
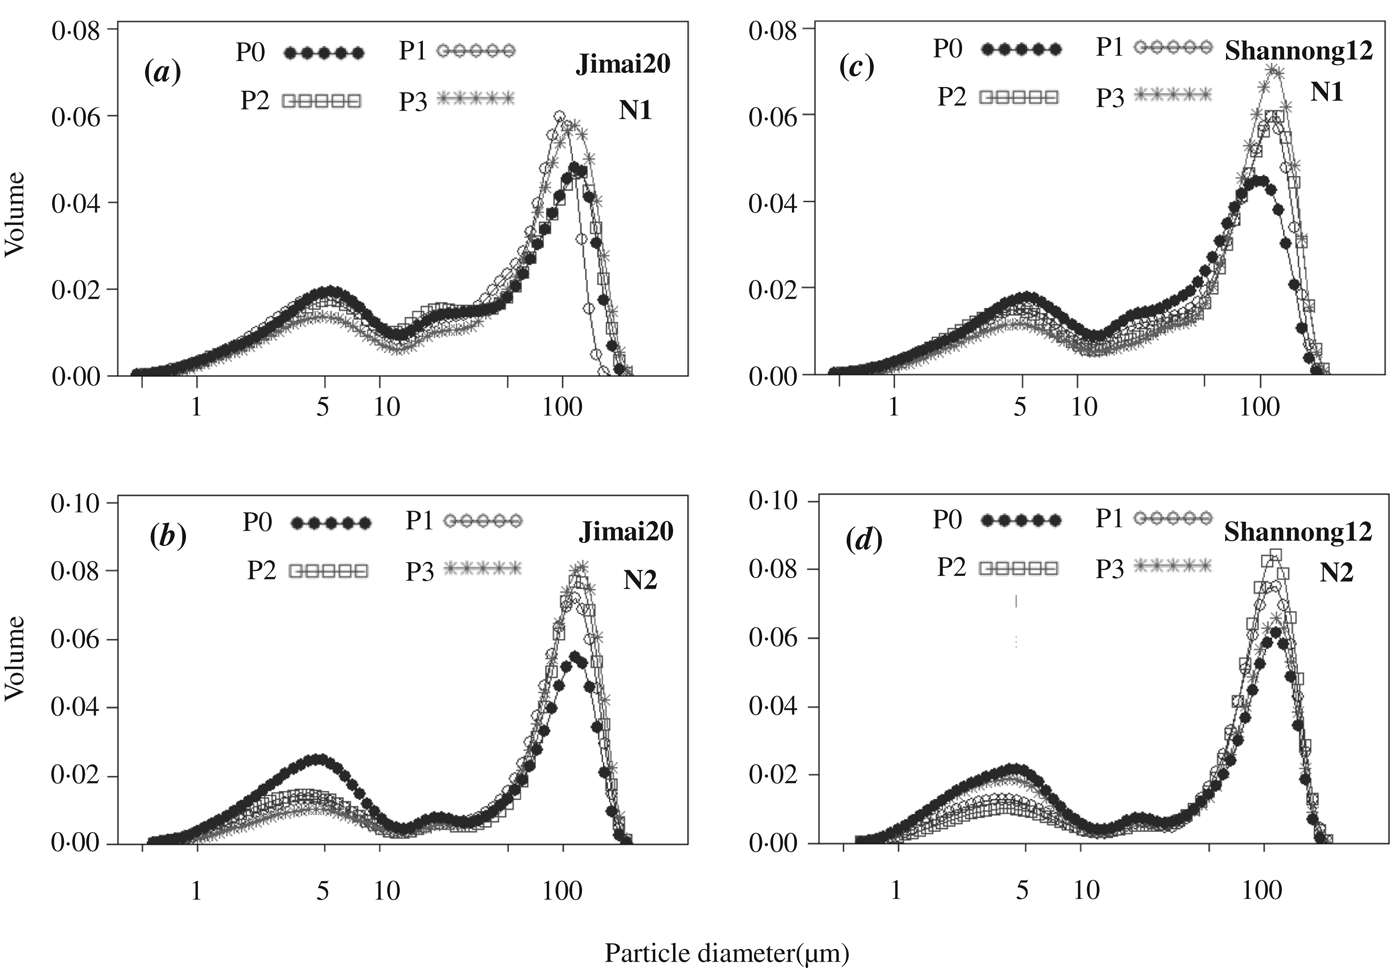
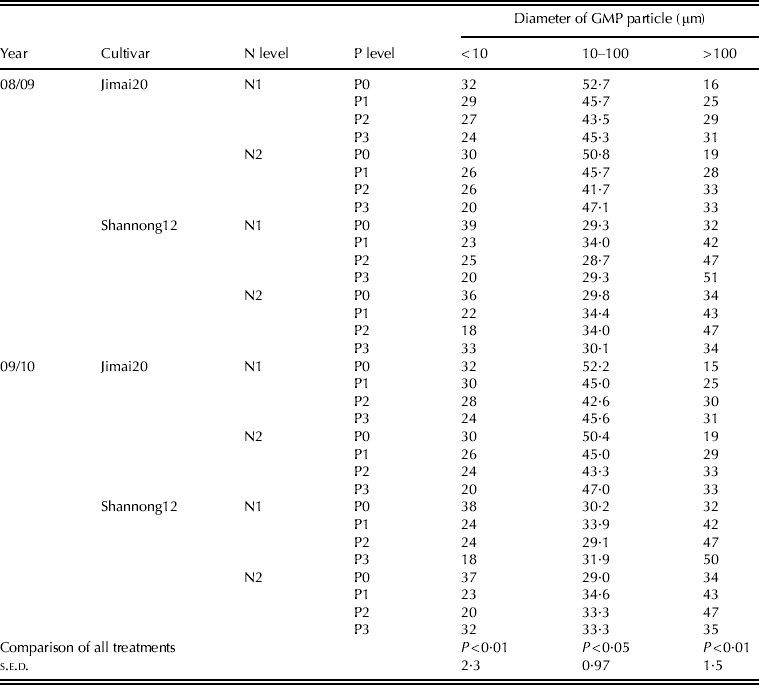
There were no significant differences in volume distribution of GMP in grains of either wheat cultivar, or between the two growing seasons (Table 3 and Fig. 2). In 2008/09, the volume proportion of GMP particles <10, 10–100 and >100 μm comprised 0·202–0·317, 0·417–0·527 and 0·156–0·328 in Jimai20 and 0·181–0·389, 0·287–0·344 and 0·320–0·510 in Shannong12, respectively.
Effects of phosphorus on volume distribution of glutenin macropolymer (GMP) in grains of Jimai20 (left) under N1 (A) and N2 (B) and Shannong12 (right) under N1 (C) and N2 (D) in 2008/09 under low (N1) and high (N2), nitrogen condition; Control (P0), 0 kg P2O5/ha; P1, 40 kg P2O5/ha; P2, 100 kg P2O5/ha; P3, 160 kg P2O5/ha.
Volume distribution of glutenin macropolymer (GMP) in wheat grains in 08/09 and 09/10 (d.f.=47)
N1, nitrogen rate of 112·5 kg N/ha; N2, 225 kg N/ha.
P0, no phosphorus; P1, 40 kg P2O5/ha; P2, 100 kg P2O5/ha; P3, 160 kg P2O5/ha.
Data are the average of three measurements.
The content of GMP particles of <10 μm in diameter was reduced significantly with increasing P application under N1 and N2 conditions in Jimai20. However, different patterns in response to P application treatments were observed in Shannong12 when under N1 conditions, the content of those GMP particles <10 μm showed the largest reduction at a P level of 160 kg/ha and the smallest reduction at 40 kg/ha when compared with the control (P0). However, under N2 conditions, GMP particles <10 μm showed the largest reduction at a P level of 100 kg/ha and the smallest reduction at 160 kg/ha for Shannong12, respectively, when compared with the control. For GMP particles of 10–100 μm in Jimai20, the content tended to decrease as the P rate increased from 0 to 100 kg/ha, but increased at a P rate of 160 kg/ha under both N conditions. For Shannong12, the content of GMP particles of 10–100 μm increased significantly at a P rate of 40 kg/ha under N1 conditions and at 40 and 100 kg/ha under N2 conditions. The content of GMP particles >100 μm tended to increase with the increasing P applied under N1 and N2 conditions in Jimai20 and showed a similar response in Shannong12 under N1 conditions. However, under N2 conditions, the content in Shannong12 increased up to 100 kg P/ha, but decreased as the P rate was increased to 160 kg/ha.
Relationship between glutenin macropolymer volume distribution and high-molecular-weight glutenin subunit content
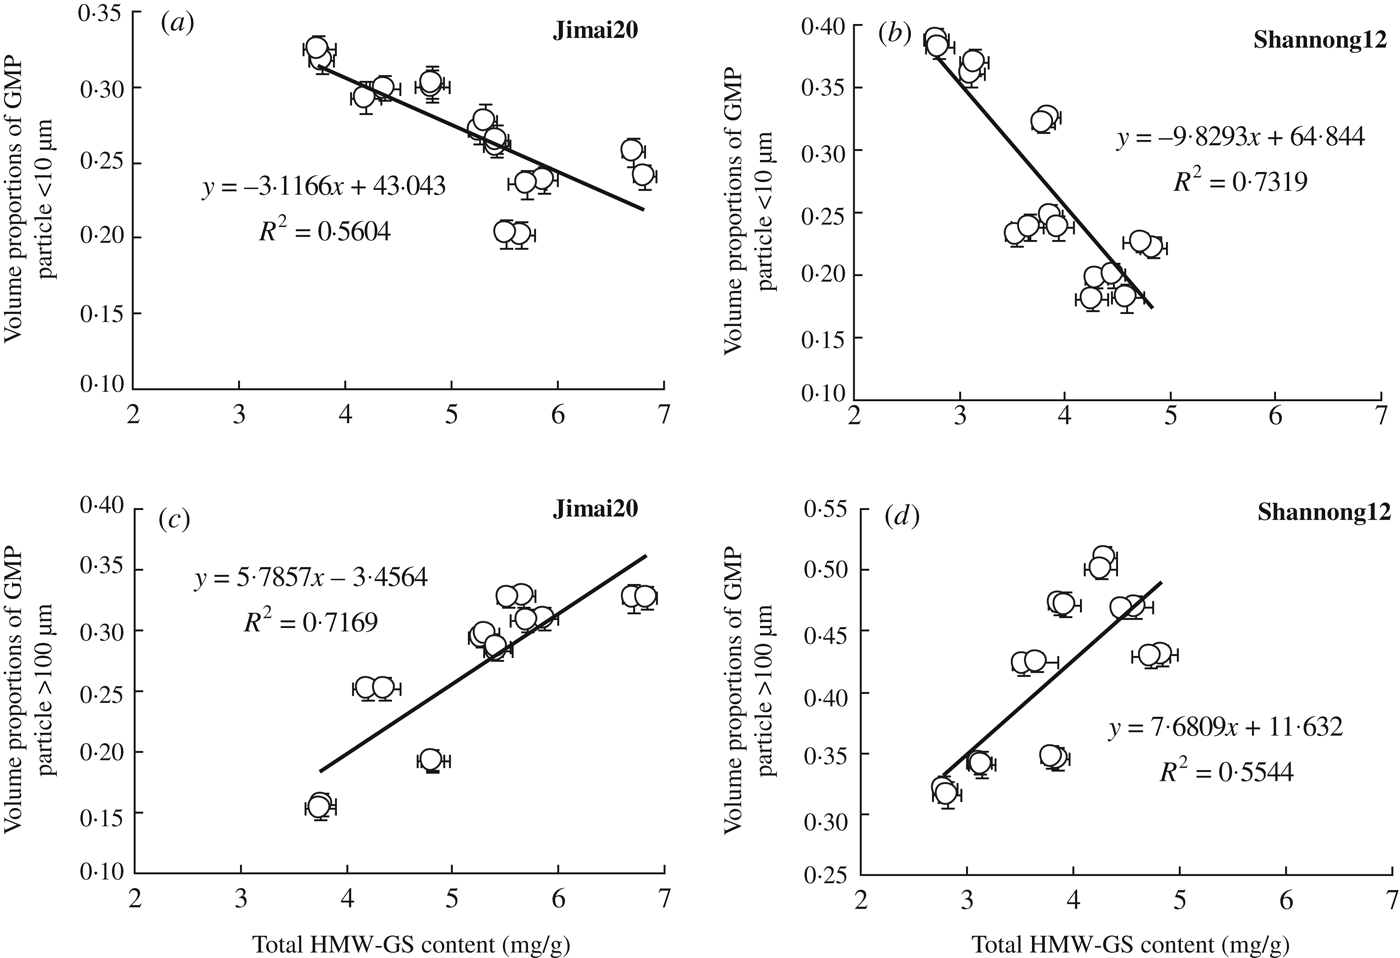
Total HMW-GS content was negatively correlated with GMP particle volume of <10 μm (r=−0·74 (P<0·05) for Jimai20 and −0·85 (P<0·05) for Shannong12 (Fig. 3), but positively correlated with that of >100 μm (r=0·84 (P<0·05) and 0·74 (P<0·05) for Jimai20 and Shannong12, respectively. It was suggested that larger GMP particles have higher HMW-GS content.
Relationship between the total high-molecular-weight glutenin subunit (HMW-GS) content and distribution by volume of GMP granules: <10 μm (A), >100 μm (C) for Jimai20 and <10 μm (B), >100 μm (D) for Shannong12, respectively.
DISCUSSION
The environment is known to have a strong effect on the rate and duration of accumulation of HMW-GS in wheat grain (Yue et al. Reference Yue, Qin, Dai, Jing, Cao and Jing2006, Reference Yue, Jiang, Dai, Qin, Jing and Cao2007; Liang et al. Reference Liang, Yin, Cai, Yan, Li, Geng, Wang, Wu, Li and Wang2008; Chen et al. Reference Chen, Wang, Yin, Guo, Chen, Li, Wang, Wu, Ni, Cai, Yang and Cao2013). Temperature and N fertilization altered the ratio of HMW-GS to LMW-GS per grain, and the proportion of HMW-GS per unit of flour protein (DuPont et al. Reference Dupont, Chan and Lopez2007). Triboi et al. (Reference Triboi, Abad, Michelena, Lloveras, Ollier and Daniel2000) also reported that HMW-GS content was greatly affected by environmental factors such as site, season and N fertilization. Jiang et al. (Reference Jiang, Yue, Wollenweber, Tan, Mu, Mu, Bo, Dai, Jing and Cao2009) reported that the content of both GMP and HMW-GS were reduced by post-anthesis drought and water-logging treatments. Zhu et al. (Reference Zhu, Li, Jiang, Huang, Feng, Guo and Peng2012) reported that a high P use efficiency resulted in increased leaf area index, chlorophyll content, photosynthetic rate and stable acid phosphatase activity to accumulate more dry matter after anthesis, which increased grain yield and grain quality of weak-gluten wheat. The present results revealed that appropriate phosphorus application, e.g. 100 kg/ha increased the GMP content, whereas excessive P (160 kg/ha) did not increase the content and even decreased it. In the present study, the response pattern of HMW-GS content to P rate differed between cultivars. For Jimai20, the HMW-GS content was highest at a P rate of 160 and 100 kg/ha, and was 66·93 and 34·22% higher than that at a P rate of 0 kg/ha under low and high N conditions, respectively. For Shannong12, total HMW-GS content was highest at a P rate of 160 kg/ha and was 53·38% higher at a P rate of 0 kg/ha under low N conditions, but under N2, it was highest at a P rate of 40 kg/ha and was 91·79% higher than the control (P0). In conclusion, HMW-GS synthesis was generally enhanced by P in the two cultivars under low N conditions and was more sensitive in response to P under high N conditions. In the present study, GMP content was closely correlated with HMW-GS in both cultivars, suggesting that changes in GMP content with respect to P were closely related to the impact of P regulation on HMW-GS synthesis; this is consistent with other findings (Don et al. Reference Don, Mann, Bekes and Hamer2006; Liang et al. Reference Liang, Yin, Cai, Yan, Li, Geng, Wang, Wu, Li and Wang2008; Jiang et al. Reference Jiang, Yue, Wollenweber, Tan, Mu, Mu, Bo, Dai, Jing and Cao2009).
Studies have revealed that the characteristics of GMP particles in wheat grains are controlled both genetically and environmentally. Glutenin macropolymer is present as particles with diameters of 1–300 μm (Don et al. Reference Don, Lichtendonk, Plijter and Hamer2003a, Reference Don, Lookhart, Naeem, Macritchie and Hamer2005, Reference Don, Mann, Bekes and Hamer2006). Zhao et al. (Reference Zhao, Li, Li, Wang, Chen, Yin and Wang2011) reported that irrigation increased yield markedly and that N application significantly affected GMP content, but the irrigation × N interaction was not significant. Chen et al. (Reference Chen, Wang, Yin, Guo, Chen, Li, Wang, Wu, Ni, Cai, Yang and Cao2013) reported that shading, especially at the middle grain-filling stage, i.e. GS75 (Zadoks et al. Reference Zadoks, Chang and Konzak1974), led to a significant increase in GMP content during grain filling. In the present study, the diameter of GMP particles in the two cultivars was 0·37–234 μm under all fertilizer conditions. In the two cultivars, the content of GMP particles of <10 μm with P applications were lower than P0, but the content of GMP particles of >100 μm were higher than P0. It is therefore suggested that P could improve the volume area proportions of the larger GMP particles. The differences of GMP size distribution with different P applications may be a reason for the variation in wheat quality (Zhao et al. Reference Zhao, Hu, Ji, Xue, Guo and Mares2001).
Wang et al. (Reference Wang, Zhu, Khan, O'Brienand and Chen2004) reported that the proportion of HMW-GS and LMW-GS play an important role in the particle size distribution of glutenin aggregates. The SDS–insoluble glutenin polymers, which have a greater proportion of HMW-GS to LMW-GS, are generally larger in size than SDS–soluble glutenins. Zhu & Khan (Reference Zhu and Khan2002) also indicated that the environment could significantly affect the proportion of total HMW-GS and individual HMW-GS from both SDS–soluble and SDS–insoluble glutenin polymers, which in turn affected the size distribution of glutenin polymers. Liang et al. (Reference Liang, Yin, Cai, Yan, Li, Geng, Wang, Wu, Li and Wang2008) reported that the contents of HMW-GS and GMP were negatively correlated with GMP particle volume of <10 μm, but positively correlated with that of >100 μm. Similar results were observed in the present study, in that there was a significant positive correlation between the content of HMW-GS and GMP particle volume of >100 μm and a significant negative correlation between the content of HMW-GS and GMP particle volume of <10 μm, suggesting that larger GMP particles had higher HMW-GS content.
The present results indicate that P significantly affected the content of HMW-GS and GMP at maturity in the two cultivars. In the present study, 100 kg/ha was the most appropriate P application for Jimai20 (a cultivar with low P utilization efficiency), but 40 kg/ha was most appropriate for Shannong12 (a cultivar with high P utilization efficiency). Furthermore, the present study reveals that the content of total HMW-GS is a determinant of the size distribution of the GMP particles, indicating that the expression levels of HMW-GS might have played an important role in determining the size distribution of glutenin aggregates, which confirms the earlier work by Don et al. (Reference Don, Mann, Bekes and Hamer2006).
The results obtained in the present study showed that P application up to 100 kg/ha increased both HMW-GS and GMP compared with no P applied, but caused a negative effect at higher P levels, i.e. 160 kg/ha. There was a significant positive correlation between total HMW-GS content and GMP particle volume of >10 μm and a negative correlation between total HMW-GS content and GMP particle volume of <10 μm in the grains. Therefore, it can be concluded that increased P-fertilizer favours the synthesis of HMW-GS and larger glutenin particles under low N conditions, whereas optimum P is needed for high N conditions. It is concluded that the response of individual and total HMW-GS content to P fertilizer differed between N conditions and cultivars. The N×P interaction was a key factor in regulation of the HMW-GS and GMP contents.
This research was supported by the National Natural Science Foundation of China (grant numbers 31271661 and 30871477), the National Basic Research Programme of China (973 Programme, No. 2009CB118602), the Special Fund for Agro-scientific Research in the Public Interest of China (grant numbers 201203100 and 201203029), the National Science and Technology Support Programme of China (grant number 2012BAD04B05), the Natural Science Foundation of Shandong Province of China (grant number ZR2010CM044) and the Key Natural Science Project of the Education Department in Anhui Province of China (grant number KJ2011A073).