

1 Introduction
A great deal of phonetic and sociolinguistic research has focused on the acoustic parameters and listeners’ perception of dialect differences between talkers. Peterson & Barney (Reference Peterson and Barney1952), and more recently Hillenbrand et al. (Reference Hillenbrand, Getty, Clark and Wheeler1995), reported acoustic parameters (formant frequencies F1–F3, formant amplitudes, and fundamental frequency f0, among others) of American English vowels produced by male and female adult speakers, as well as child speakers. Although Peterson & Barney did not control for dialect variation, their measurements have served as the foundation for many studies of vowel acoustics and vowel recognition. Hillenbrand et al. (Reference Hillenbrand, Getty, Clark and Wheeler1995) replicated Peterson & Barney's methods, but the talkers were screened for dialect and only those from the northern Midwest were included. Hillenbrand et al. (Reference Hillenbrand, Getty, Clark and Wheeler1995) observed a number of differences between the vowel spaces of their northern Midwestern talkers and the talkers in Peterson & Barney's study, including evidence of the Northern Cities Chain Shift (Labov Reference Labov and Linn1998) in /ɛ æ ɑ ɔ/.
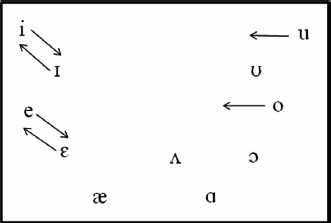
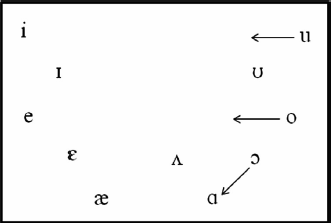
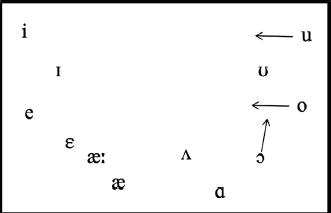
Previous research on vowel production in the United States by Labov and colleagues has identified four primary dialects of American English. These include the Northern dialect, which is characterized by the Northern Cities Chain Shift, and the Southern dialect, which is characterized by the Southern Vowel Shift (shown in Figure 1). The New England, Midland, and Western dialects are characterized by the merger of the low back vowels /ɑ/ and /ɔ/ and represent Labov's (Reference Labov and Linn1998) ‘third dialect’ of American English. The fourth major variety is the Mid-Atlantic dialect, which is characterized by a split /æ/ system, raised /ɔ/, and some fronting of the back vowels /u/ and /o/ (see Figure 3). The environments in which /æ/ tensing occurs include closed syllables ending in /n m f θ s/, as well as certain words ending in /d/ (Labov, Ash & Boberg Reference Labov, Ash and Boberg2006). Clopper, Pisoni & de Jong (Reference Clopper, Pisoni and de Jong2005) performed acoustic analyses on vowels produced by 48 talkers from six American English dialect regions based on the maps published in Labov et al. (Reference Labov, Ash and Boberg2006). Consistent with Labov et al.'s findings, Clopper et al. found that vowel systems vary considerably by region and that uniform baselines that attempt to encompass all of American English do not capture this important source of variation (see also Hagiwara Reference Hagiwara1997). They observed the Northern Cities Chain Shift in vowels produced by Northern speakers, the Southern Vowel Shift in vowels produced by Southern speakers, as well as some acoustic similarities between the Midland and Southern vowels. Although back-vowel fronting (mostly /u/) is quite common across much of North America, cases of extreme fronting have been observed predominantly in the South and in small regions in the Midwest (such as Kansas City, St. Louis, and Indianapolis; Labov et al. Reference Labov, Ash and Boberg2006), suggesting that extreme back-vowel fronting may be spreading from the Southern to the Midland dialect. The Midland and Mid-Atlantic vowel systems are shown in Figures 2 and 3, respectively.
Schematic of the Southern Vowel Shift (based on Labov Reference Labov and Linn1998).

Schematic of the Midland vowel system (based on Labov et al. Reference Labov, Ash and Boberg2006).

Schematic of the Mid-Atlantic vowel system (based on Labov et al. Reference Labov, Ash and Boberg2006). Tense /æ/ is shown as ‘æː’ while lax /æ/ is shown as ‘æ’.

Peterson & Barney (Reference Peterson and Barney1952) and Hillenbrand et al. (Reference Hillenbrand, Getty, Clark and Wheeler1995) also presented the vowel productions in their studies to listeners for identification. Although performance was generally near ceiling, some vowels were more difficult to identify than others. In both studies, /ɑ ɔ/ were among the most difficult vowels to identify, which may reflect the merger of these two vowels in the ‘third dialect’ of American English. In Peterson & Barney's (Reference Peterson and Barney1952) study, in which dialect was not well-controlled, /ɛ/ was also identified less accurately than the other vowels, which may reflect its variability across dialects of American English, including raising and fronting in the South and lowering and/or backing in the North. More recently, Clopper, Pierrehumbert & Tamati (Reference Clopper, Pierrehumbert and Tamati2010) examined cross-dialect vowel recognition performance. They found more errors in vowel recognition for /ɛ ɑ/ for Northern vowels than Midland vowels, consistent with the Northern Cities Chain Shift. In addition, the Northern listeners were better able to distinguish between /ɔ ɑ/ than the Midland listeners, due to the transitional merger of the two vowels in the Midland dialect. These results suggest that the acoustic differences between vowels across dialects can significantly affect vowel recognition performance and that the dialect of the listener can also affect the perceptual similarity between vowels.
Labov et al. (Reference Labov, Ash and Boberg2006) defined marked dialect features as those that are highly characteristic of a specific region, inasmuch as they are rarely used outside of that region. Thus, the Midland dialect, which is spoken in the lower Midwest, is one of the least marked of the regional American English varieties, because it exhibits no truly characteristic features. The features of the Midland dialect shown in Figure 2 are all found in other dialects of American English, including the transitional /ɑ/ ~ /ɔ/ merger in New England and the West, and back-vowel fronting in the South (Labov et al. Reference Labov, Ash and Boberg2006). The front vowel variants associated with the Southern Vowel Shift, however, are marked features of Southern American English and the split /æ/ system and raised /ɔ/ are marked features of the Mid-Atlantic dialect. Thus, the Southern and Mid-Atlantic dialects of American English are more marked in production than the Midland dialect.
Dialect markedness also emerges as a significant factor in perception. For example, Labov's (Reference Labov and Linn1998) ‘third dialect’ of American English, including the Midland dialect, has been found to be more intelligible in sentences mixed with noise than the Mid-Atlantic and Southern dialects, both for lifetime residents of the Midland and Northern dialect regions and for listeners who have lived in multiple different dialect regions (Clopper & Bradlow Reference Clopper and Bradlow2008). Similarly, in a study of perceptual dialect categorization, Clopper & Pisoni (Reference Clopper and Pisoni2006b) found that the Southern and Mid-Atlantic dialects are the perceptually most distinctive varieties, not only for listeners who have lived in one region for most of their lives but also for those who have lived in multiple different dialect regions. Dialect markedness also emerges as one of the primary dimensions of perceptual similarity in both dialect classification and perceptual similarity rating tasks (Clopper, Levi & Pisoni Reference Clopper, Levi and Pisoni2006, Clopper & Pisoni Reference Clopper and Pisoni2007).
Regional dialect similarity has been explored for other languages using both computational and perceptual measures. For example, Heeringa and colleagues have quantified regional dialect similarity in Dutch and Norwegian using string edit distance measures calculated over phonetically transcribed corpora (Nerbonne & Heeringa Reference Nerbonne and Heeringa2001, Gooskens & Heeringa Reference Gooskens and Heeringa2004). More recently, Heeringa, Johnson & Gooskens (Reference Heeringa, Johnson and Gooskens2009) extended their computational method to acoustic measures of similarity using formant frequencies and zero-crossing rates. Both computational methods return dialect distances that correspond well to traditional descriptions in dialectology and the computed distances are also well-correlated with perceptual judgments of dialect distance obtained in a perceptual similarity rating task.
The aim of the current study was to investigate whether the Midland dialect is acoustically more closely related to the Mid-Atlantic dialect or to the Southern dialect, and whether or not Midland listeners are sensitive to these acoustic relationships in a vowel recognition task. The findings will help further our understanding of acoustic and perceptual differences between more marked dialects (Mid-Atlantic and Southern) and less marked dialects (Midland) of American English.
2 Method
2.1 Materials
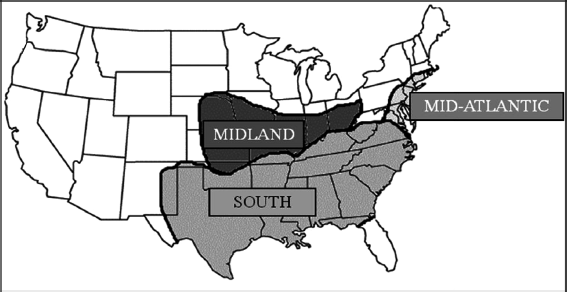
Materials were selected from the Nationwide Speech Project (NSP) corpus (Clopper & Pisoni Reference Clopper and Pisoni2006a). Sixty talkers – five males and five females from each of six dialect regions (based on Labov et al. Reference Labov, Ash and Boberg2006) – were recruited for participation in the corpus. All were native speakers of American English who reported no history of speech or hearing disorders. Each talker had lived exclusively in his or her respective dialect region before the age of 18 and had lived in Bloomington, Indiana for less than two years at the time of recording at Indiana University in Bloomington. Talkers were recorded in a sound-attenuated booth in the presence of the second author. Four different types of speech materials were collected in the NSP corpus: isolated words, sentences, passages of connected speech, and interview speech. For the purposes of the present study, only the isolated /hVd/ words were used. Specifically, the NSP corpus includes productions of the vowels /i ɪ e ɛ æ ɑ ʌ o ʊ u/, in /hVd/ format (heed, hid, hayed, head, had, hod, hud, hoed, hood, who 'd). Three male talkers aged 18–20 years, one each from the Mid-Atlantic, Midland, and Southern dialect regions (for a map see Figure 4), were selected at random from the corpus. Once selected, the first author listened to each talker's production of /hVd/ words, as well as samples of connected speech, for region-specific dialectal characteristics. Each talker was deemed a good representative of his specific dialect region. The talkers each produced five tokens of each vowel, yielding 50 tokens per talker. The waveform files were edited so that each file contained the test word preceded and followed by 10 ms of silence. The waveforms of the originally selected tokens were then scaled to the same average RMS amplitude using Cool Edit 2000.
Map of the three dialect regions examined in the current study.

For more information about specific recording procedures for the NSP corpus, see Clopper & Pisoni (Reference Clopper and Pisoni2006a).
2.2 Acoustic analyses
Vowel formant frequencies were derived from linear predictive coding (LPC) analysis of formant tracks. WaveSurfer (Sjölander & Beskow Reference Sjölander and Beskow2006) was used to accomplish this tracking using a 20-ms Hamming window and a 10-ms frame rate. LPC order was normally M = 12 but was adjusted to 10 or 14 when needed for individual tokens. Any remaining tracking errors were corrected by hand editing.
Values of the first two formants (F1 and F2) were extracted from the formant tracks at several locations. The vowel ‘steady state’ was defined following Ferguson & Kewley-Port (Reference Ferguson and Kewley-Port2007) as 20% of the vowel duration plus 30 ms. Values were also extracted at the 20%, 35%, 50%, 65%, and 80% points. These values were used to calculate trajectory length (TL), a metric recommended by Fox & Jacewicz (Reference Fox and Jacewicz2009) for assessing dialect differences in dynamic formant movement. The TL for each vowel token represents the sum of four Euclidean distances in the F2 × F1 vowel space: from 20% to 35%, from 35% to 50%, from 50% to 65%, and from 65% to 80%. Vowel duration was measured by determining the onset and offset times using the spectrogram and waveform. The onset generally corresponded to the beginning of the first clear pitch pulse, and periodicity often appeared in the waveform. The offset generally corresponded to the end of the last clear pitch pulse, and the waveform typically showed an abrupt drop in amplitude.
2.3 Perceptual vowel recognition
Vowel recognition data are reported for 31 University of Kansas students aged between 18 and 33 years. All listeners were native speakers of American English who had lived in the Midwest for a majority of their lives, and who had no history of prolonged exposure to another dialect or language. An additional seven listeners completed the experiment but did not meet these criteria; their data were excluded from analysis and are not reported. The remaining 24 female and 7 male participants had normal hearing in both ears, and the right ear was subsequently used as the test ear. Normal hearing was ascertained by a hearing screening, which was conducted at 25 dB HL (with respect to ANSI 2004) at 250–8000 Hz. Most of the participants (n = 22) were recruited by word of mouth and were not compensated for their participation; the others received extra credit in an introductory acoustics course.
Listeners performed all testing individually in a double-wall sound-treated room, seated in front of a computer monitor and keyboard. On each trial, a test word was played from one channel of a Tucker-Davis Technologies (TDT) RP2 real-time processor, attenuated (by a TDT programmable attenuator, PA-5) to achieve the desired presentation level of 70 dB SPL, and routed via a headphone buffer (TDT HB-7) to an insert earphone (E-A-RTONE 3A) for monaural presentation. The listener identified the vowel of the test word by clicking on the number of the response category corresponding to that vowel. The ten response alternatives were displayed on the computer monitor as 10 sets of three keywords: (1) feet, thief, bead; (2) sit, rib, bid; (3) tape, raid, bade; (4) head, said, bed; (5) back, mass, bad; (6) pot, sod, bod; (7) cup, rug, bud; (8) rode, own, bode; (9) good, should, book; (10) rude, news, boot. These keywords were selected to encourage listeners to respond based on the vowel sound and not on the spelling of the test word (Ferguson Reference Ferguson2004). Note that in the Mid-Atlantic dialect, the vowels in bad and mass would be raised, but the vowel in back would not. Prior to testing, a short face-to-face training task was presented orally by the first author until participants could reliably identify the various vowel categories.
The experiment consisted of a practice set of 20 words to familiarize participants with the experimental task followed by a single test block containing all 150 /hVd/ test words (10 vowels × 3 talkers × 5 tokens per vowel). The practice /hVd/ words were produced by a second male talker from the Midland dialect from the NSP corpus (10 vowels × 2 tokens per vowel). The 150 test words were presented in random order across all three dialects. Each listener heard the words in a different random order to control for order effects. One listener heard eight trials in a row from the same talker by chance, however most listeners heard no more than three or four trials in a row from the same talker. Participants were permitted to hear each word only once, but given unlimited time to submit their responses at their own pace. Participants received feedback during the practice trials only. If the participant answered incorrectly to any of the /hVd/ words during the practice trial, the correct answer was provided on the screen. No feedback was provided during the test block. The entire procedure lasted approximately 45 minutes.
3 Results and discussion
3.1 Acoustic data
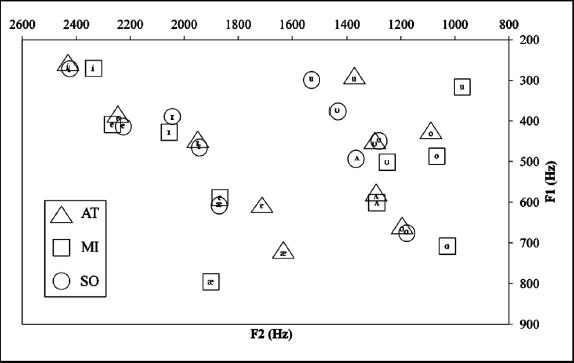
A summary of the average steady-state F1 and F2 values for the 10 American English vowels /i ɪ e ɛ æ ɑ ʌ o ʊ u/ for each of the three dialects is shown in Figure 5. A total of 30 data points are shown in the figure (10 vowels × 3 talkers). Given that all three of the talkers were adult males and that their vowel spaces do not exhibit systematic shifts in either dimension, normalization for vocal tract size was deemed unnecessary. Figure 5 shows evidence of the Southern Vowel Shift (see also Figure 1). The Southern talker's productions of /ɪ/ and /ɛ/ were raised, and /o/, /ʊ/, and /u/ were fronted, relative to the other two dialects. Other acoustic patterns we did not expect to find for the Southern talker were raised /æ/ and /ʌ/. For the Midland talker, /ʊ/ was somewhat lower than expected (meaning F1 was higher), appearing acoustically to be more of a mid vowel. For the Mid-Atlantic talker, /æ/ was backed and raised and /u/ was fronted, relative to the Midland talker. In addition, the Mid-Atlantic /o/ and /ʊ/ were produced with similar F1 values. Thus, both the Mid-Atlantic and Southern talkers exhibited /u/ fronting, but the Midland talker did not.
Mean F1 and F2 values for each talker (Mid-Atlantic, Midland, Southern) for 10 vowel categories /i ɪ e ɛ ae ɑ ʌ o ʊ u/. Vowel is denoted by its phonetic symbol; talker dialect is denoted by shape: Mid-Atlantic (triangle), Midland (square), and Southern (circle).

An examination of Figure 5 suggests that the Midland (MI) vowels (squares) more closely resemble the Mid-Atlantic (AT) vowels (triangles) than the Southern (SO) vowels (circles) in F2 × F1 position. For certain vowels, such as /i/, /e/, and /ɑ/, all three talkers produced similar vowels, regardless of dialect. For other vowels, such as /æ/ and /u/, however, the three talkers showed great variation from one another in terms of position, consistent with previously reported regional dialect differences. For nearly all of the remaining vowels, the Midland and Mid-Atlantic talkers showed greater similarity in F2 × F1 position than the Midland and Southern talkers.
Average duration (in milliseconds) and trajectory length (in Hz) of each vowel for each talker are shown in Tables 1 and 2, respectively. Each talker's overall mean duration and trajectory length are shown as well. Overall, the Midland talker exhibited the longest vowel duration across all vowel categories, while the Mid-Atlantic and Southern talkers did not seem to differ in average duration. The Midland talker also displayed the largest average TL, and many of his individual vowel trajectories appeared to be more dynamic than those of the Mid-Atlantic talker, particularly among the back vowels. This result could be a function of the longer vowel durations exhibited by the Midland talker. The Southern talker's TL did not appear to differ from either of the other two talkers, as his average TL fell between the Mid-Atlantic and Midland talkers’ TLs. It is important to note the great deal of variability in the TL among the vowels, particularly the relatively long TLs in the Mid-Atlantic talker's productions of /æ/, the Midland talker's productions of /ʌ/, /ʊ/, and /u/, and the Southern talker's productions of /ɪ/ and /e/. These differences are likely to be due to the diphthong-like nature of these vowel productions.
Mean vowel durations for individual talkers (in milliseconds).

Mean trajectory lengths (TLs) for individual talkers (in Hz).

3.2 Intelligibility data
The perception experiment was conducted to explore how sensitive Midland listeners are to the acoustic differences between the vowels from these three dialects. For each listener, intelligibility scores were determined by calculating the percent correct identification for each vowel category for each talker. These individual scores were then converted to rationalized arcsine units (RAU; Studebaker Reference Studebaker1985) before being submitted to a two-way repeated-measures ANOVA with talker and vowel as within-subject factors. The ANOVA revealed significant main effects of talker (F(2,60) = 52.53, p < .0001, η2 = .64) and vowel (F(9,270) = 28.13, p < .0001, η2 = .48). Examination of estimated marginal means and 95% confidence intervals indicated that intelligibility differed significantly among all three talkers. Intelligibility was highest for the Mid-Atlantic talker (95.2%), followed by the Midland talker (92.5%), and lowest for the Southern talker (79.7%). Among the vowels, intelligibility was highest for /i/ (100%) and lowest for /ɛ/ (71.6%). There was not a significant effect of listener gender on performance, as females correctly identified vowels 89% of the time, and males correctly identified vowels 90% of the time.
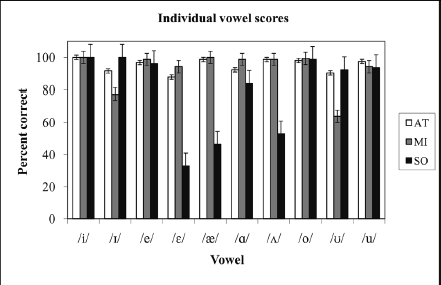
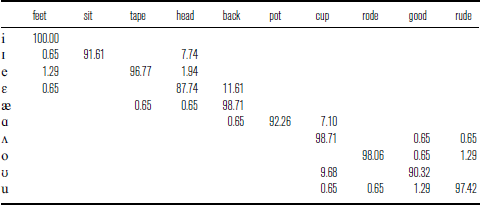
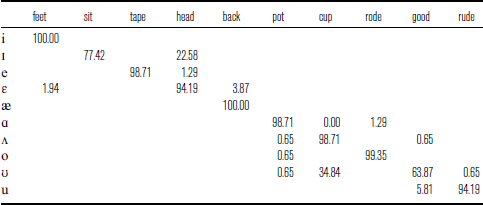
The talker × vowel interaction was also significant (F(18,540) = 46.61, p < .0001, η2 = .61). This interaction can be seen in Figure 6, in which percent correct scores averaged across the 31 listeners are shown for each vowel for each talker. The Southern dialect most noticeably had the poorest identification scores for a number of vowels, including /ɛ æ ɑ ʌ/, while the Midland talker had the poorest identification scores for /ɪ ʊ/. The Mid-Atlantic talker had consistently high scores across all vowel categories. Confusion matrices for all of the vowels in each dialect are shown in Tables 3–5.
Mean percent correct intelligibility scores for the Midland listeners of each vowel produced by each speaker. Color denotes dialect of the speaker: Mid-Atlantic (white), Midland (gray), and Southern (black). Error bars show standard error.

Confusion matrix for the Mid-Atlantic speaker. Rows represent the intended vowel and columns represent the responses. All rows sum to 100%.

Confusion matrix for the Midland speaker. Rows represent the intended vowel and columns represent the responses. All rows sum to 100%.

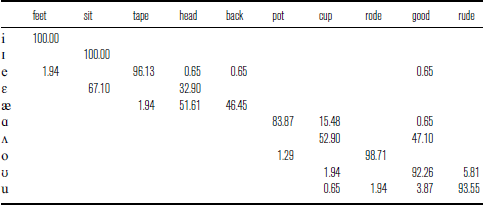
Confusion matrix for the Southern speaker. Rows represent the intended vowel and columns represent the responses. All rows sum to 100%.

To sort out the talker × vowel interaction, separate one-way ANOVAs investigating talker effects for individual vowels were conducted. The effect of talker on identification accuracy for /i/ was not analyzed, as there was no variance in scores (i.e. all listeners identified all productions of /i/ correctly). For /ɪ/, differences between all three talkers were significant. Performance was most accurate for the Southern talker, followed by the Mid-Atlantic talker, and was least accurate for the Midland talker. For /ɛ/, /æ/, and /ʌ/, performance was significantly more accurate for the Midland and Mid-Atlantic talkers than for the Southern talker; differences between the Mid-Atlantic and Midland talkers were not significant. The effect of talker for /ɑ/ was only significant between the Midland and Southern talkers, with more accurate performance for the Midland talker than the Southern talker. Finally, differences between talkers for /ʊ/ were significant between both Midland and Mid-Atlantic talkers and Midland and Southern talkers. Performance was less accurate for the Midland talker than the Mid-Atlantic and Southern talkers. No significant differences were found between talkers for /e/, /o/ or /u/.
3.3 Discussion
The overall results of this study on acoustic and perceptual similarity among the vowels of three American English dialects are consistent with some of the previous literature, but also provide new data on several unexpected patterns. First, one would anticipate that the Midland listeners tested in the current study would show the best identification accuracy for vowels produced by the Midland speaker, given that the dialect should be highly familiar to them. However, although the overall vowel intelligibility score for the Midland speaker was 92.5%, it was unexpectedly lower than that for the Mid-Atlantic speaker (95.2%). Two Midland vowels, /ɪ/ and /ʊ/, were identified with less than 80% accuracy. The Midland /ɪ/ was most commonly confused with /ɛ/, which was acoustically distinct from /ɪ/ in the F1 and F2 dimensions (see Figure 5 above), but acoustically similar in duration and trajectory length (see Tables 1 and 2 above). The most frequent confusion for /ʊ/ was /ʌ/, with listeners choosing it about 35% of the time. This confusion is consistent with the Midland talker's production of /ʊ/, which was lower than the /ʊ/s produced by the other two talkers. Clopper et al. (Reference Clopper, Pierrehumbert and Tamati2010) suggested that the Northern dialect has a lowered /ʊ/, which might be confusable with /ʌ/. However, Labov et al.'s (Reference Labov, Ash and Boberg2006) map of variation in /ʊ/ height suggests substantial variability throughout the United States, including relatively lower productions in eastern Kansas and relatively higher productions in western Kansas. Thus, the frequent misidentification of the Midland /ʊ/ as /ʌ/ reflects this variation within the Midland dialect region.
The Southern talker's vowels typically behaved in accordance with the Southern Vowel Shift (see Figure 1 above), including the raising of /ɪ/ and /ɛ/ and the fronting of /o/ and /u/. It is evident in Figure 5 that the raised /ɛ/ could easily be confused with Mid-Atlantic or Midland /ɪ/ due to the overlap in formants. The perceptual effects of this overlap are seen in Table 5 above, where /ɛ/ was misidentified as /ɪ/ 67.1% of the time. One acoustic finding we did not anticipate was the raised /æ/ produced by the Southern talker. It is obvious from Figure 5 that the Southern /æ/ is directly overlapping with the Midland /ɛ/, while Table 5 shows it was misidentified as /ɛ/ 51.6% of the time. Southern /æ/ was correctly identified only 46.5% of the time. It is interesting to note that Clopper et al. (Reference Clopper, Pisoni and de Jong2005) found /æ/ fronting among Southern talkers, while the current study found /æ/ raising. This raising and fronting of /æ/ may reflect a parallel shift or a drag chain with the raised and fronted /ɪ ɛ/ in the Southern Vowel Shift. Alternatively, Thomas (Reference Thomas2001) and Labov et al. (Reference Labov, Ash and Boberg2006) both discuss the ingliding diphthongal quality of /æ/ in the Southern dialect. The /æ/ raising observed in the current study may therefore be due to our definition of steady state (which may have captured the part of the diphthong that is closer to /ɛ/), or may simply be an individual characteristic of the talker chosen for this study.
Another surprising acoustic finding from the Southern talker that has not been documented before was a raised /ʌ/. As shown in Figure 5, the Southern speaker's production of /ʌ/ had a much lower F1 value than those of his Mid-Atlantic and Midland counterparts and overlapped with Midland /ʊ/, Mid-Atlantic /ʊ/, and Southern /o/. Table 5 shows that Southern /ʌ/ was misidentified as /ʊ/ 47.1% of the time, suggesting that the Midland listeners perceived the Southern /ʌ/ as a vowel that would normally fall within the acoustic range of the Midland vowel /ʊ/. As discussed above, the height of /ʊ/ is also variable in the Midland dialect, which may have further contributed to this pattern of errors. Finally, the Southern /ɑ/ was misidentified as /ʌ/ 15.5% of the time. Although the Midland and Southern /ɑ/s are very similar in F1 and F2 (see Figure 5), the Southern /ɑ/ was relatively short and had a relatively long trajectory length. These temporal properties make the Southern /ɑ/ more similar to the Midland /ʌ/ in those dimensions, which may account for the perceptual patterns.
Only a few dialect-specific patterns were observed in the formants of the Mid-Atlantic vowels – such as backed and raised /æ/, fronted /u/, and similar F1 values for /o/ and /ʊ/ – but the listeners had no trouble identifying these vowels (see Figure 6 above). The raised /æ/ may have been particularly unproblematic given that its long duration and trajectory length make it acoustically distinct from /ɛ/. In addition, raising of /æ/ before /d/ is common in eastern Kansas (Labov et al. Reference Labov, Ash and Boberg2006), which may have facilitated its identification in had by the Midland listeners. The fact that the vowels produced by both the Mid-Atlantic and Midland talkers were identified with over 90% accuracy suggests that, perceptually, these two dialects are more similar to one another than are the Midland and Southern dialects. This perceptual similarity could reflect the settlement patterns discussed by Carver (Reference Carver1987), in which the Midland dialect region (specifically central Ohio and regions due west) was settled predominantly by people moving west along the National Road from Maryland and Pennsylvania in the early 19th century. The National Road stretched through a number of states, beginning on the east coast in Maryland, and continuing into Pennsylvania, West Virginia, Ohio, Indiana, and Illinois. Certain acoustic features of the dialects of these eastern states may thus have infiltrated Midwestern states along with those settlers, and traces of dialect influences from hundreds of years ago could very well still be present in American English dialects today.
In interpreting these results one must take into consideration some limitations of this study. First, /hVd/ productions from only three talkers were examined: one male talker from each of the three dialects. A similar study using more talkers, and possibly including women, would facilitate a more thorough examination of the vowel space characteristics of these three dialects in comparison to one another. It may also prove useful to examine the acoustic parameters of vowels in more complex phonetic environments than the /hVd/ words. It might also be interesting to collect production data from each of the listeners, as their own productions of vowels could potentially influence their perception of the stimuli (Evans & Iverson Reference Evans and Iverson2004). Finally, the NSP corpus did not include /hɔd/ among the /hVd/ productions, and thus the effect of the Mid-Atlantic raised /ɔ/ on intelligibility could not be examined. In addition, the stimulus materials did not reflect the Mid-Atlantic split /æ/ system, which may have artificially inflated the intelligibility of the Mid-Atlantic dialect in this study.
4 Conclusion
The present study provides acoustic and perceptual data on what have been described as the more marked American English dialects, Mid-Atlantic and Southern, and one of the least marked dialects, Midland (Clopper & Pisoni Reference Clopper and Pisoni2006b). Although only one talker was used to represent each dialect, the talkers from the Southern and Mid-Atlantic dialect regions reliably produced vowel features consistent with previous descriptions of their varieties. However, the Midland talker did not front /u/ or /o/, which might be expected in a Midland vowel system (Figure 2). Differences between the individual vowel durations were found among all three talkers, and overall the Midland talker exhibited longer vowels than the Mid-Atlantic or Southern talkers. While these duration differences could explain, in part, why the Southern talker's vowel productions were less intelligible, they do not account for the higher intelligibility of the Mid-Atlantic talker. In addition, these results are inconsistent with previous findings that Southern talkers generally exhibit longer vowels than Northern and Mid-Atlantic talkers (Wetzell Reference Wetzell2000, Clopper et al. Reference Clopper, Pisoni and de Jong2005, Jacewicz, Fox & Salmons Reference Jacewicz, Fox and Salmons2007). The Midland talker also exhibited more dynamic individual vowel trajectories than the Mid-Atlantic and Southern talkers. These results are also inconsistent with previous findings that Southern talkers exhibit longer vowel trajectories than Midland and Northern talkers (Fox & Jacewicz Reference Fox and Jacewicz2009). However, the longer trajectories may simply reflect the longer vowel durations produced by the Midland talker in this study. Further examination of vowel duration and trajectory in these dialects may be helpful to determine the role of vowel dynamics in the acoustic and perceptual similarity of regional dialects of American English.
The interpretation of the intelligibility results crucially relied on the steady state formant frequencies and the duration and trajectory length measures, suggesting that multiple acoustic dimensions contribute to perceptual vowel similarity across dialects. The Mid-Atlantic and Midland dialects were perceived much more accurately by Midland listeners than was the Southern dialect, and the perceptual error patterns were consistent with some of the acoustic similarities observed between the talkers. Taken together, the results of these two experiments suggest that acoustically and perceptually the Midland dialect is more closely related to the Mid-Atlantic dialect than the Southern dialect in speech produced by young college-educated male talkers.
Acknowledgements
This work was supported by a University of Kansas Honors Program Undergraduate Research Award. Patrick Pead assisted with the dynamic formant measures. The comments and suggestions of two anonymous reviewers on an earlier version of the paper are greatly appreciated.