I. INTRODUCTION
Nowadays, the patterned-sapphire substrate techniques have been widely used in high-power GaN-based light-emitting diodes (LEDs), which are the most promising alternative light source for general lighting.Reference Koike, Shibata, Kato and Takahashi1, Reference Lydecker, Leadford and Ooyen2 With the breakthrough of the patterned-sapphire substrate technique, the efficacy of high-brightness GaN-based LEDs has been driven to a record high of 150 lm/W.3, Reference Narukawa, Narita, Sakamoto, Deguchi, Yamada and Mukai4 The efficacy enhancement of GaN-based LEDs with the patterned-sapphire substrate technique generally attributes to the improvement in both light extraction efficiency and internal quantum efficiency.Reference Lee, Kuo, Lu, Su and Wang5–Reference Tadatomo, Okagawa, Ohuchi, Tsunekawa, Imada, Kato and Taguchi9 The regular patterns created on the sapphire substrate counteracts the effect of the total internal reflection at the GaN/sapphire interface.Reference Lee, Kuo, Lu, Su and Wang5 And, the enhancement in the internal quantum efficiency benefits from the reduction of threading dislocations by possible lateral growth of GaN epilayer on the patterned-sapphire substrate.Reference Lee, Kuo, Lu, Su and Wang5, Reference Lee, Tseng and Kuo10–Reference Wuu, Wang, Wen, Huang, Horng, Yu and Pan13
Numerous patterning features produced on the patterned-sapphire substrate by either dry etching or wet etching processes, which includes circle cavities, square cavities, hemispheric bumps, and trenched stripes, have been studied.Reference Lee, Kuo, Lu, Su and Wang5, Reference Dwikusuma, Saulys and Kuech14–Reference Li, Huang and Lai16 Yet, no matter what etching process is used to create the patterns, a hard mask lithographic process is required on the flat c-plane sapphire wafer. In this study, a mask-free wet etching process was used to produce a nature-patterned sapphire substrate (n-pss). Then, a metalorganic chemical vapor deposition (MOCVD) GaN LED epilayer was grown on the n-pss wafer. The MOCVD GaN epilayers were characterized by photoluminescence (PL) and x-ray rocking curve analysis. The above analysis can spell out the crystalline quality and the in-plane stress level of the GaN epilayer grown on the n-pss wafer. Previous researches have shown that the residue compressive stress in the GaN epilayer would result in a piezoelectric field across the multiquantum wells (MQWs). The piezoelectric field distorts the energy levels in the energy band diagram of the MQWs of the GaN LED epilayer, which degrades the internal quantum efficiency.Reference Simon, Langer, Barski and Pelekanos15, Reference Li, Huang and Lai16 So, the in-plane stress level of the GaN epilayer grown on the patterned-sapphire substrate is another important factor affecting the efficacy of the GaN-based LED. So far, there is no systematical study on the in-plane stress of the GaN epilayer grown on the patterned sapphire substrate. How do the patterns on the patterned sapphire substrate affect the in-plane stress level of the GaN epilayer is still unknown. In this work, a comparison study would be carried on the in-plane stress level in the GaN epilayers grown on the n-pss wafer and on the standard sapphire wafer.
II. EXPERIMENTAL
The sapphire wafers studied in this work are the common 2-inch c-plane sapphire wafers. A cohesive contact between the backside of the sapphire wafers and the bottom of the growth pots in MOCVD growth chamber is very important for growing a good crystal quality of GaN epilayers. It is because that any poor contact interface between the backside of the sapphire wafers and the bottom of the growth pots caused by the scratched or rough backside of the sapphire wafers will result in temperature fluctuation on the growth surface of the sapphire wafer during MOCVD growth process. Therefore, before the etching process, a plasma-enhanced chemical vapor deposition SiO2 layer would be deposited on the backside of the sapphire wafers to protect the backside of the sapphire wafers from being etched.
The etching on sapphire wafers was done by immersing sapphire wafers into three etching solutions: pure H3PO4, pure H2SO4, and a mixing solution (H3PO4:H2SO4 = 3:1). Four etching temperatures are studied, which are 200, 260, 280, and 320 °C. After certain etching times, 15, 30, and 60 min, the sapphires wafers were removed from the etching solutions to measure the etched sapphire thickness. The etched thickness is measured by following method. A SiO2 layer was deposited on the sapphire substrate. Then, by using lithography, the SiO2 layer was defined as 1 × 1 cm2 patterns. The patterned SiO2 layer serves as a hard mask to prevent sapphire from etching. So, during the etching process, the acid only etched the “exposed” sapphire area, i.e., without SiO2 hard mask on the top. Then, we used Alpha step to measure the height difference between the area with SiO2 hard mask and without SiO2 hard mask. Then, the etched thickness of the sapphire substrate can be determined. The backside SiO2 layer can be removed by hydrogen fluoride solution. After stripping the backside SiO2 layer, the etched sapphire wafers, i.e., n-pss wafers, are ready for the growth process of MOCVD GaN LED epilayer.
III. RESULTS AND DISCUSSIONS
A. Etching rate and etching surface morphology on sapphire wafer
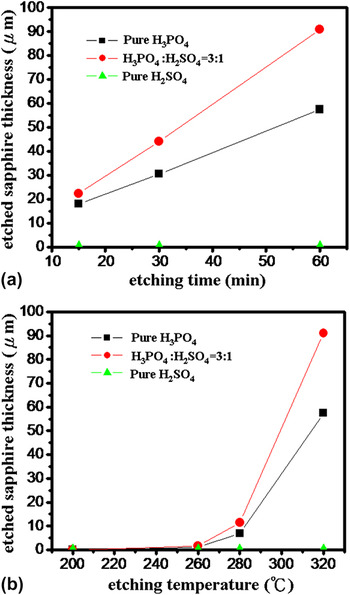
Figure 1(a) shows the etched thickness of sapphire wafers with three etching solutions [H3PO4, H2SO4, and the mixing H3PO4/H2SO4 (3:1) solution] versus the etching time at a constant temperature of 320 °C. For H3PO4 and the mixing H3PO4/H2SO4 etching solutions, the etched sapphire thickness shows a very linear relationship with the etching time. The mixing H3PO4/H2SO4 solution has the fastest etching rate (about 1.5 μm/min). Interestingly, we found that pure H2SO4 did not etch the sapphire wafer in thickness. Even after 60-min etching, the thickness of the sapphire wafer almost remains the same. Figure 1(b) plots the etched sapphire thickness against the etching temperatures with 60-min etching time. An onset temperature for the sapphire wafer starting to being etching is found to be about 260 °C. As the etching temperature was over 260 °C, the etching rates of both H3PO4 and the mixing H3PO4/H2SO4 etching solutions on the sapphire wafer greatly increase.
(a) Etching thickness versus etching time at 320 °C with different solutions. (b) Etching thickness versus etching temperature for 60 min with different solutions.

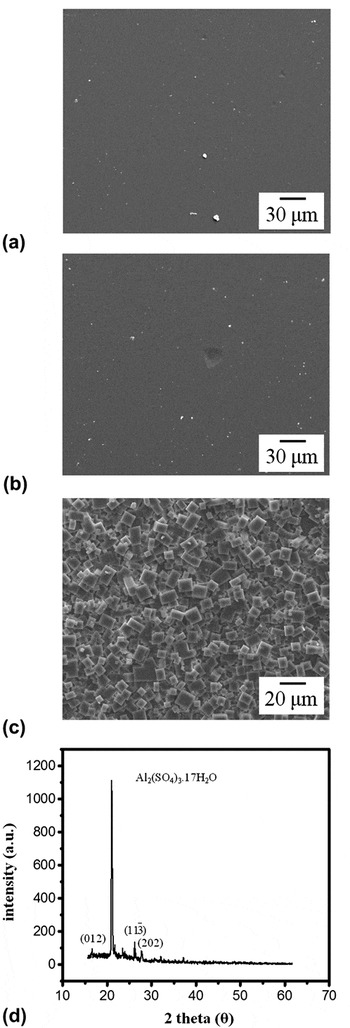
The surface morphology on the etched sapphire wafers by H3PO4 and the mixing H3PO4/H2SO4 solution is quite similar. As shown in Figs. 2(a) and 2(b), the etched sapphire surfaces by H3PO4 and the mixing H3PO4/H2SO4 solution are relatively flat and only few etching pits can be seen on the etched sapphire surface. Previously, we have shown that H2SO4 does not etch the sapphire wafer in thickness. Instead, a very dense etching reaction product phase was found and completely covered on the surface of the sapphire wafer, as seen in Fig. 2(c). The etching reaction product phase has a cubic shape. X-ray diffraction (XRD) was used to identify the exact compound phase and the structure of the etching reaction product phase. As shown in Fig. 2(d), only one strong peak appears in the XRD pattern of the etching product, which matches with the (104) plane of the standard XRD pattern of Al2 (SO4)3·17H2O phase. Dwikusuma reported a similar finding on the Al2 (SO4)3·17H2O phase.Reference Dwikusuma, Saulys and Kuech14 However, Dwikusuma’s XRD result showed a polycrystalline structure on the Al2 (SO4)3·17H2O etching product. In the present work, one strong (104) peak shown in XRD pattern implies that the etching product grown on the sapphire wafer should be a highly preferred orientation polycrystalline structure. The etching reaction product grew (or precipitated) with a particular <104> growth direction on the c-plane of the sapphire wafer. We believe that it is the etching reaction product layer (Al2(SO4)3·17H2O) preventing the sapphire surface from being etched by H2SO4.Reference Dwikusuma, Saulys and Kuech14, Reference Törmä, Svensk, Ali, Suihkonen, Sopanen, Odnoblyudov and Bougrov17 On the contrary, no etching reaction product would form on the sapphire wafer as the sapphire wafer was etched by the acid solutions containing H3PO4, such as the H3PO4 or the H3PO4/H2SO4 mixing solution. It implies that H3PO4 can etch the etching reaction product phase. Thus, without forming the etching reaction product on the sapphire wafer, the sapphire wafers can be etched by H3PO4-contained acid solutions.Reference Dwikusuma, Saulys and Kuech14
(a) Morphology of etched sapphire wafer by H3PO4-contained solution. (b) Morphology of etched sapphire wafer by H3PO4/H2SO4 mixing solution. (c) Morphology of the etching reaction product by H2SO4. (d) X-ray diffraction (XRD) result of etching reaction product on the etched sapphire surface with H2SO4.

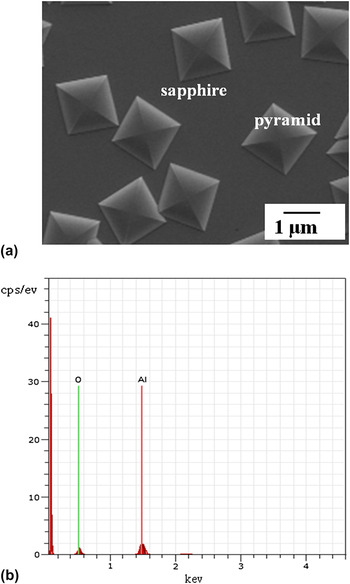
HCl solution can remove the etching reaction product layer on the sapphire surface, which was resulted from the H2SO4 etching. After removing the etching reaction product by dilute HCl, facet pyramids were observed on the etched sapphire surface. Figure 3(a) shows the scanning electron microscopy (SEM) image of the facet pyramids on the etched sapphire surface. The height and the width of the pyramid are about 0.2 μm and 1–2 μm, respectively. Energy-dispersive x-ray diffraction spectroscopy (EDX) analysis on the pyramids on the sapphire wafer shows that no S atom can be found and Al and O are the only two elements that can be detected (the atomic ratio is 2:3). The EDX result is shown in Fig. 3(b). Therefore, we can confirm that the pyramids on the sapphire wafer belong to sapphire phase.
(a) Scanning electron microscopy (SEM) image of the pyramids on the etched sapphire wafer. (b) Energy-dispersive x-ray spectroscopy analysis on the pyramids on the sapphire wafer.

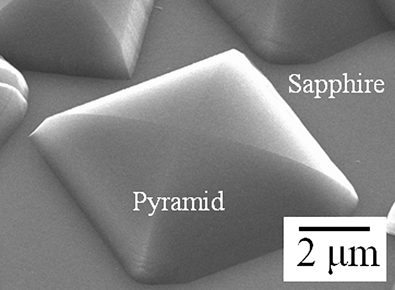
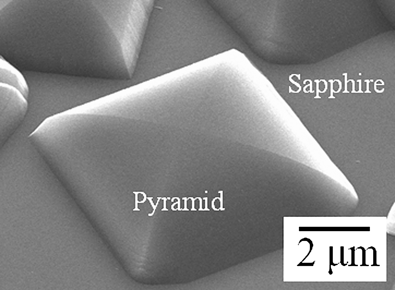
Figure 4 shows the titled SEM image on a particular pyramid on the etched sapphire surface. We can clearly see that the side-planes of the pyramids are not flat; instead, they are curved surfaces. It means that the dihedral angle of the side-planes in respect to the sapphire surface (c-plane) varies with the height of the pyramid. In the bottom part of the pyramids, the dihedral angle is relatively large and it becomes smaller toward the apex of the pyramids. So, we believe that the side-planes of the pyramids do not belong to any known common planes of the sapphire crystalline structure, such as r, m, and a planes. Those side-planes could be composed of many high-index planes of the sapphire crystalline structure.
Titled SEM image on a pyramid.
B. Epitaxial GaN LED epilayers grown on n-pss and standard flat sapphire wafers
Previously, it has been shown that facet pyramids can be created on the sapphire wafer by etching with H2SO4. The unique pyramidal morphological pattern on the sapphire surface might have similar functions with current patterned sapphire substrates, i.e., excellent improvements in the GaN epitaxial quality and the light-extraction efficiency for LED devices.Reference Lee, Kuo, Lu, Su and Wang5–Reference Tadatomo, Okagawa, Ohuchi, Tsunekawa, Imada, Kato and Taguchi9 So, it is of interesting to grow epitaxial GaN/InGaN LED structure on the n-pss wafer with the pyramidal pattern by MOCVD process. The LED epilayer structure includes a 1.8-μm-thick undoped GaN layer and a 2.5-μm-thick Si-doped n-type GaN cladding layer, an active region of 450-nm emitting wavelength with six periods of InGaN/GaN MQWs, and a 0.3-μm-thick Mg-doped p-type GaN cladding layer.
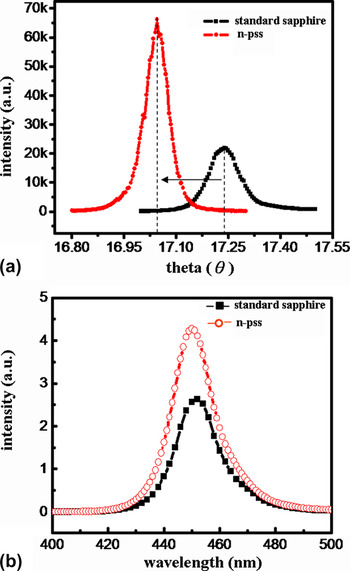
X-ray rocking curve and PL measurement were performed on the GaN LED epilayers on the n-pss wafer and the standard flat sapphire wafer. From XRD rocking curve result [Fig. 5(a)], we can observe: (i) the (0002) diffraction peak intensity of the GaN epilayer on the n-pss wafer is larger than that on the standard flat sapphire wafer and (ii) also, full width at half maximum (FWHM) of the GaN epilayer on the n-pss wafer is narrower than that on the standard flat sapphire wafer. The above observations indicate that the crystalline quality of the GaN LED epilayer on the n-pss wafer is better than that on the standard flat sapphire wafer. In addition, the smaller FWHM of the GaN epilayer on the n-pss wafer further implies that the GaN epilayer on the n-pss wafer has a lower defect level (predominant as screw dislocations) than that of the GaN epilayer on the standard flat sapphire wafer.Reference Zhao, Jiang, Zhu, Liu, Wang, Zhang, Wang and Yang18Fig. 5(b) shows PL measurement for the GaN epilayers on the n-pss wafer and on the standard flat sapphire wafer, respectively. The GaN epilayer on the n-pss wafer has a higher intensity and a narrower FWHM than that on the standard flat sapphire wafer. Again, the PL results imply that the GaN epilayer grown on the n-pss sapphire wafer has a better epitaxial quality.
(a) XRD result and (b) photoluminescence measurement on the GaN epilayer grown on the n-pss and the standard flat sapphire wafers.

The present XRD rocking curve result shows that the (0002) diffraction peak of the GaN epilayer on the n-pss wafer sits slightly toward the smaller angle region, compared to the (0002) diffraction peak of the GaN epilayer on the standard flat sapphire wafer. Lee et al.Reference Lee, Oh, Kim and Lee19 reported a similar finding that the position of the diffraction peak of the GaN epilayer grown on the cone shape-patterned sapphire wafer shifted to the smaller angle region, comparing to that of the GaN epilayer on the standard flat sapphire wafer. The shift in the (0002) diffraction peak indicates that the in-plane stress level of the GaN epilayer on the n-pss wafer is different from the in-plane stress level of the GaN epilayer on the standard flat sapphire wafer. So far, there is no study on how the pyramidal patterns on the sapphire wafer would affect the in-plane stress level in the GaN epilayer. In the following, we will calculate the in-plane stress level in the GaN epilayers grown on the n-pss wafer and the standard sapphire wafer. The d-spacing values of the (0002) GaN plane on the n-pss wafer and the standard flat sapphire wafer can be determined by Bragg’s law:

where λ is the wavelength of x-ray (1.542 Å). From XRD rocking curve results, the diffraction angle of the (0002) peak of the GaN epilayers on the n-pss wafer and on the standard flat sapphire wafer is 17.05 and 17.24, respectively. Therefore, plugging in the wavelength of x-ray (1.542 Å) and the diffraction angles into Bragg’s law, the (0002) d-spacing of the GaN epilayers on the n-pss wafer and the standard flat sapphire wafer are calculated to be 2.627 Å (d n-pss) and 2.598 Å (d flat), respectively. Using the interplanar spacing Eq. (2) and the calculated interplanar d-spacing values (d n-pss and d flat), the c-axial lattice constants of the GaN epilayers on the n-pss wafer and on the standard flat sapphire wafer can be computed to be 5.254 Å and 5.196 Å, respectively.

The c-axial lattice constant of the GaN epilayer on the n-pss wafer is larger than that of the GaN epilayer on the standard flat sapphire wafer. Also, we notice that the c-axial lattice constants of both GaN epilayers are larger than the equilibrium c-axial lattice constant (c 0) of the stress-free bulk GaN (c 0 = 5.185 Å). It means that both GaN epilayers are in tensile state in the c-axial direction. The c-axial strain (ε zz) of the GaN epilayer on sapphire wafer can be expressed as  where Δc is the difference between the equilibrium c-axial lattice constant (c 0) of the stress-free bulk GaN and the c-axial lattice constant of the GaN epilayer either on the n-pss wafer or on the standard flat sapphire wafer. With knowing the above calculated c-axial lattice constants and the equilibrium c-axial lattice constant of the stress-free bulk GaN (c 0 = 5.185 Å), the c-axial strain values (ε zz) of the GaN epilayers on the n-pss wafer and the standard flat sapphire wafer can be calculated to be 1.331% and 0.212%, respectively. Poisson ratio relates the in-plane compressive strain and the c-axial tensile strain in the GaN epilayer. Then, via the Poisson ratio of GaN (ν = 0.22), the in-plane compressive strain values for the GaN epilayers on the n-pss wafer and the standard flat sapphire wafer are calculated to be 0.268% and 0.047%, respectively. Using Young’s equation, σ = Yε, (Y GaN = 150 GP), the in-plane compressive stress level in the GaN epilayers on the n-pss wafer and the standard flat sapphire wafer can be calculated to be 305 MPa and 53.6 MPa, respectively. The calculated in-plane compressive stress level of the GaN epilayer on the n-pss wafer is larger than the compressive stress level of the GaN epilayer on the standard flat sapphire wafer. It means that the pyramidal pattern on the n-pss wafer would enlarge the in-plane compressive stress in the GaN epilayer. The exact reasons for the augment of the in-plane compressive stress in the GaN epilayer deserve future detail study.
The previous researches have shown that the compressive stress in the GaN epilayer would result in a piezoelectric field across the MQWS, which distorts the energy band diagram and degrades the internal quantum efficiency of the MQWS in GaN LED epilayer.Reference Simon, Langer, Barski and Pelekanos15, Reference Li, Huang and Lai16 So, it could be expected that, with a larger in-plane compressive stress, the GaN LED epilayer on the n-pss wafer would have a larger degradation effect on the internal quantum efficiency than that of the GaN LED epilayer on the standard flat sapphire wafer.
From the overall discussions above, we realize that the pyramidal pattern on the n-pss wafer would result in two contradiction effects on the internal quantum efficiency of the GaN LED epilayer: (i) the possible lateral growth due to the pyramidal pattern on the n-pss wafer leads to the improvement in the crystalline quality of the MOCVD-grown GaN LED epilayer, which enhances the internal quantum efficiency of the GaN LED epilayer. (ii) Yet, a larger compressive stress level in the GaN epilayer caused by the pyramidal pattern on the n-pss wafer degrades the internal quantum efficiency of the GaN LED epilayer.
C. Horizontal LED chip fabrications and characterizations
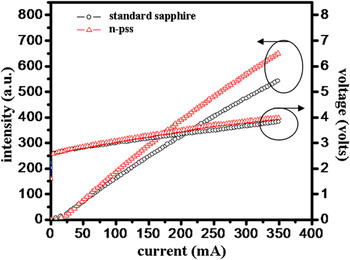
Both GaN LED epilayers grown on the n-pss wafer and the standard flat sapphire wafer were fabricated into the conventional horizontal LED chips. Figure 6 is the plot of L–I–V curves of LED chips on the n-pss wafer and the standard flat sapphire wafer. The turn-on voltages of both LED chips on the n-pss wafer and the standard flat sapphire wafer at the 350 mA input current are very similar (the difference is less than 0.2 V). From the L–I curves, we find that the LED chips fabricated on the n-pss wafer have a higher light output than the LED chips on the standard flat sapphire wafer. At the input current of 350 mA, the average light output of the LED chips on the n-pss sapphire wafer is larger than that of the LED chips on the standard flat sapphire wafer by about 20%.
L–I–V curves of light-emitting diode chips fabricated on the nature-patterned sapphire substrate (n-pss) wafer and on the standard sapphire wafer.

IV. SUMMARY
In conclusion, three etching solutions [pure H3PO4, pure H2SO4, and mixing solution (H3PO4:H2SO4 = 3:1)] on sapphire wafers were investigated. Among three kinds of etching solutions, the mixing solution has the fastest etching rate (about 1.5 μm/min) at 320 °C. The etching rates increases greatly with the etching temperature. On the other hand, it is found that pure H2SO4 could not etch the sapphire in thickness. Instead, very-facet pyramids were created on the sapphire surface.
XRD and PL measurement show that GaN LED epilayer grown on pyramidal-patterned sapphire wafer has a better crystalline quality than that grown on the standard flat sapphire. In addition, the analysis from the XRD results implies that the pyramidal pattern on the n-pss wafer would enlarge the in-plane compressive stress in the GaN epilayer. Yet, at the input current of 350 mA, the light output of the LED chips on the pyramidal-patterned sapphire is larger than that of the LED chips on the standard sapphire by 20%.
ACKNOWLEDGMENTS
The authors thank Prof. Chung, National Central University, Taiwan, for the fruitful discussion. Also, the work was financially supported by NSC 100-3113-E-008-001, Top-level Research Centers Grants 100G903-2, and National Science Council Grant projects NSC 98-2221-E-008-027-MY3. Also, PL measurement by N.W. Hsu is greatly acknowledged.