Implications
The advances of studies on animal genomes enable the development of new breeds or lines, in which favorable genes identified in different breeds or lines are combined, through gene pyramiding. Gene pyramiding has been successfully applied in plant breeding, but has not yet been practiced in animals because of the long generation intervals and limitation of fertility of animals. In this paper, we propose some schemes for pyramiding three and four genes, taking into consideration various features of animal populations, and discuss how reproductive capacity, the probabilities of obtaining the desired genotypes and genetic distances between adjacent genes would affect the design of an optimal scheme. We also provide an algorithm to compute the population sizes needed in each generation. This paper would provide a reference for designing gene-pyramiding schemes and analyzing the feasibility of carrying out gene pyramiding in animals, and would promote the practical gene pyramiding in animals.
Introduction
Along with the advances of studies on animal genomes, functional genes and quantitative trait loci (QTLs) of many important economic traits are continuously identified. These genes are of major significance to animal breeding. On the one hand, they can be used for marker-assisted selection (MAS) to increase the response to selection in within-breed or within-line breeding programs. On the other hand, they can be used for marker-assisted introgression to incorporate one or several favorable genes from one breed or line (donor) into another (recipient) in backcross breeding programs. These two aspects have been used in practical animal breeding (Dekkers and Hospital, Reference Dekkers and Hospital2002). A third possible application of the functional genes in animal breeding is gene pyramiding, i.e., to develop a new breed or line by integrating favorable genes identified in different breeds or lines so as to build an ideal genotype.
Gene pyramiding has been successfully applied in several crop breeding programs, and many varieties and lines possessing multiple attributes have been produced, most of which involved pyramiding of disease resistance genes (e.g., Huang et al., Reference Huang, Angeles, Domingo, Magpantay, Singh, Zhang, Kumaravadivel, Bennett and Khush1997; Hittalmani et al., Reference Hittalmani, Parco, Mew and Huang2000; Wang et al., Reference Wang, Chen and Zhang2001; Jiang et al., Reference Jiang, Xu, Tu, Li, He and Zhang2004; Saghai Marrof et al., Reference Saghai Marrof, Jeong, Gunduz, Tucker, Buss and Tolin2008). These varieties and lines have been playing important roles in crop breeding. In comparison with plants, it is much more difficult to conduct gene pyramiding in animals because of the lower fertility, longer generation intervals, inability to conduct self-fertilization and existence of inbreeding depression in most animal species. Therefore, gene pyramiding has not yet been practiced in animal populations. Nevertheless, gene pyramiding may provide a new and (possibly) efficient way to develop new breeds for animal breeders.
Since it is much harder to conduct gene pyramiding in animal populations, it is important to plan an optimal scheme before carrying out gene pyramiding. Servin et al. (Reference Servin, Martin, Mézard and Hospital2004) investigated the theoretical issues of gene pyramiding and proposed general principles for designing gene-pyramiding schemes. They provided an algorithm to compute the minimum population size needed for obtaining a single individual possessing the required genotype at each of the intermediate genotypes (nodes) of the pyramiding process. Their work laid the foundation for studying and designing optimal gene-pyramiding schemes. However, for animal populations, it is not enough to design gene-pyramiding schemes based solely on the theory of Servin et al. (Reference Servin, Martin, Mézard and Hospital2004). The reproductive capacity of animals also has to be taken into account when designing an optimal pyramiding scheme. For plants, only a single individual with required genotype is needed at each node, from which enough offspring for the next stage can be produced by self-fertilization. For animals, however, depending on their reproductive capacity, a certain minimum number of individuals with the required genotype at each node are needed to produce enough offspring for the next stage. Therefore, the reproductive capacity of animals has a great effect on the efficiency of gene-pyramiding schemes in animals. In this study, based on the theory developed by Servin et al. (Reference Servin, Martin, Mézard and Hospital2004) and in consideration of the features of animals, we propose a method for calculating the population size needed at each node and a series of schemes for pyramiding three and four genes in animals. We compared these schemes in terms of the total population size and the number of generations needed for obtaining an individual with all target genes pyramided under various conditions. The purpose of this research is to provide a reference for analyzing and designing gene-pyramiding schemes in animals.
Methods
Basic steps of gene pyramiding
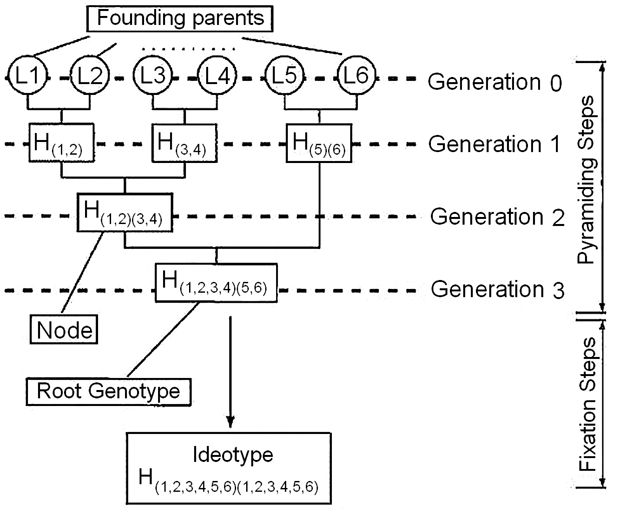
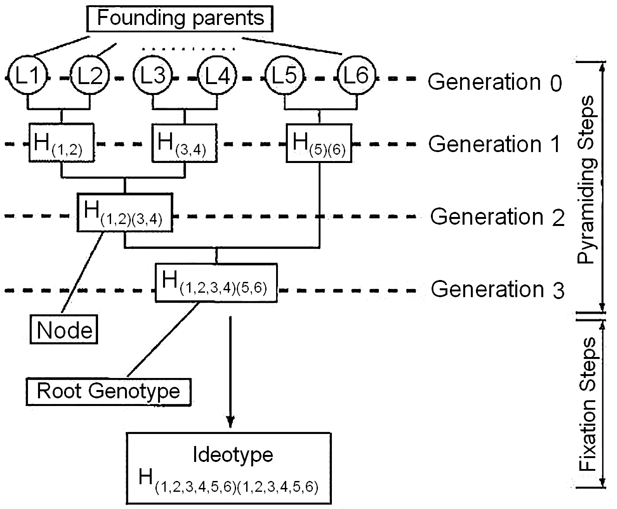
The general procedure of gene pyramiding, as described by Hospital et al. (Reference Hospital, Goldringer and Openshaw2000), is illustrated in Figure 1. It consists of two basic steps: the pyramiding step and the fixation step. The pyramiding step aims to cumulate target genes existing in different lines into individuals through various kinds of crosses, involving individuals that contain all of the desired genes, but for which not all target genes are fixed. The genotype in these individuals is termed the ‘root’ genotype. The fixation step aims to fix all target genes into an ideal genotype (called ideotype) through intercrosses or backcrosses. For example, as shown in Figure 1, there are six different lines (L1, L2, L3, L4, L5 and L6), each being homozygous at target gene gi. In the pyramiding step, the root genotype H (1,2,3,4)(5,6) is generated by crossing the six lines. The intermediate genotypes H (1,2), H (3,4), H (5,6) and H (1,2)(3,4) generated in the process of pyramiding step are termed as nodes. In the fixation step, the ideotype H (1,2,3,4,5,6)(1,2,3,4,5,6) is obtained from the root genotype via intercross.
Schematic diagram of gene pyramiding (Servin et al., Reference Servin, Martin, Mézard and Hospital2004).
Gene-pyramiding schemes
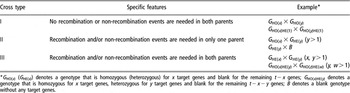
There are many possible schemes when three or more genes are to be pyramided. Basically, the gene pyramiding is realized through a series of crosses of various types. In each cross, the individuals with certain genotypes for the target genes are chosen to cross with each other such that they can transmit gametes carrying certain target genes to the offspring with probabilities which depend on whether the target genes to be transmitted are on the same or different chromosomes. If on the same chromosome, probabilities will depend on whether recombinants or non-recombinants are needed and on the corresponding recombination rates between target genes. Suppose there are t target genes to be pyramided. Let G HO(x ) and G HE(x ), respectively, denote a genotype that is homozygous or heterozygous for x target genes and blank for the remaining t − x target genes, and let G HO(x )HE(y ) denote a genotype that is homozygous for x target genes, heterozygous for y target genes and blank for the remaining t − x − y target genes. Based on the genotypes of the individuals to be crossed with each other, three cross types with respect to the requirement of recombination or non-recombination events in parents, can be defined and are given in Table 1.
Three cross types and their features with respect to the requirement of recombination or non-recombination events in parents for producing gametes carrying required target genes

*G HO(x ) (G HE(x )) denotes a genotype that is homozygous (heterozygous) for x target genes and blank for the remaining t − x genes; G HO(x )HE(y ) denotes a genotype that is homozygous for x target genes, heterozygous for y target genes and blank for the remaining t − x − y genes; B denotes a blank genotype without any target genes.
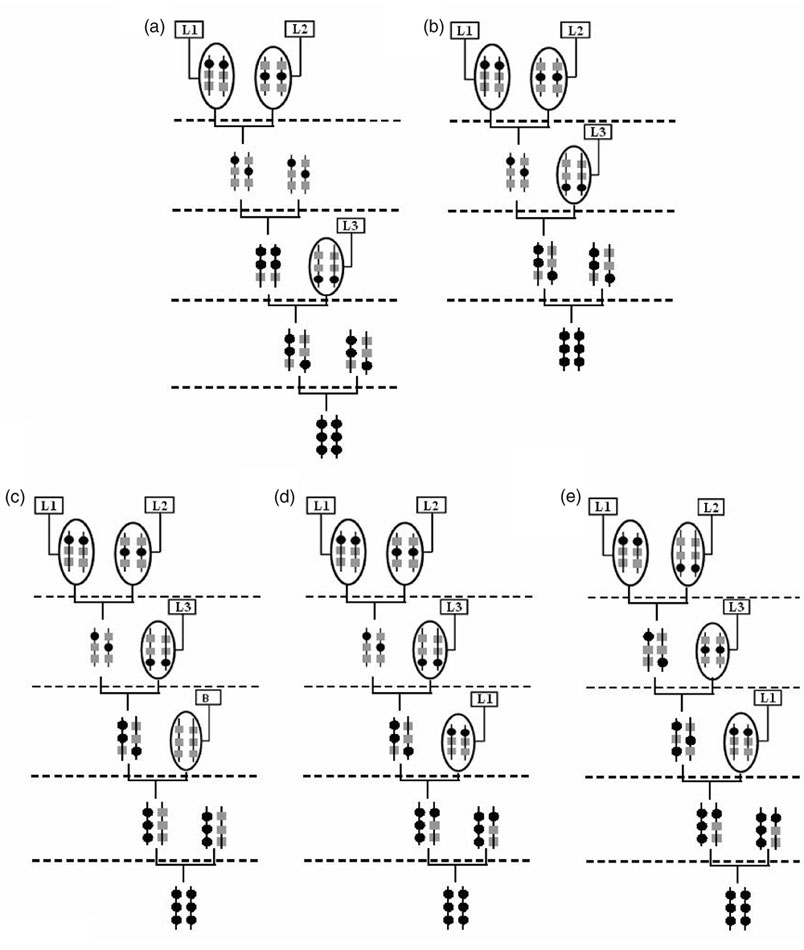
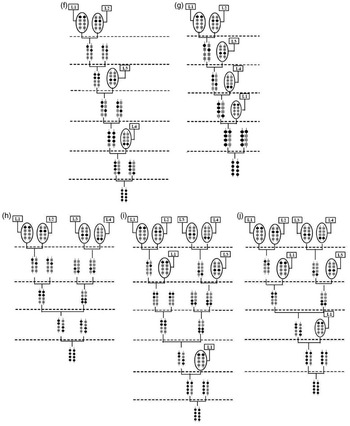
In designing a gene-pyramiding scheme, it is essential to optimally select the above cross types in each generation to ensure the probability that the cross will produce the required gametes with a probability as large as possible. In consideration of the features of animal populations, we present five schemes for pyramiding three and four genes as shown in Figures 2 and 3, respectively.
Schemes for pyramiding three target genes. L1, L2 and L3 represent different lines carrying the three target genes, respectively. B represents a blank line without any target genes. The target genes are represented by solid circles, their corresponding alleles are represented by shaded rectangles.

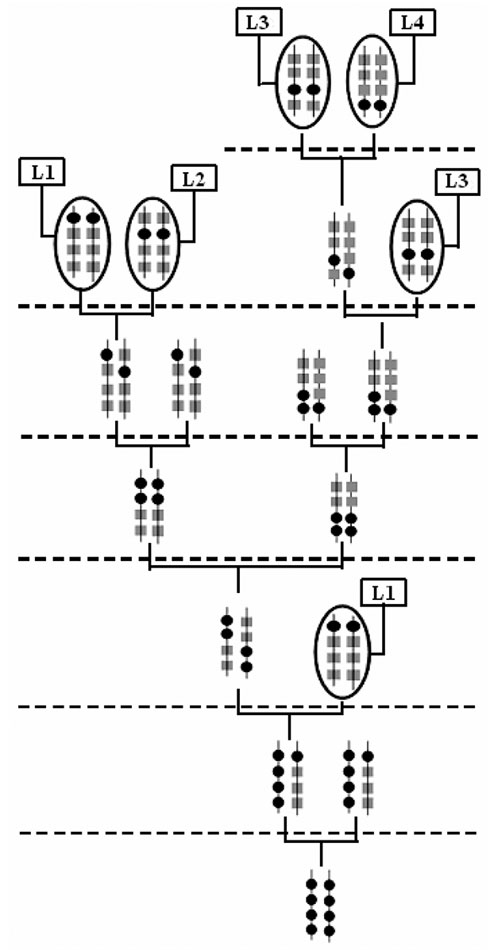
Schemes for pyramiding four target genes. L1, L2, L3 and L4 represent different lines carrying the four target genes, respectively. The target genes are represented by solid circles, their corresponding alleles are represented by shaded rectangles.

Schemes for pyramiding three genes
Suppose that the three target genes g1, g2 and g3 are presented in three different lines L1, L2 and L3, respectively. In Scheme A, genes g1 and g2 are first pyramided and fixed by crossing L1 and L2 and then intercrossing the F1 individuals. Gene g3 is then incorporated and fixed to get the ideotype. In Scheme B, the F1 individuals from the cross of L1 and L2 are crossed directly with line L3, then the root genotypes are intercrossed to fix the target genes. Compared to Scheme A, Scheme B needs one generation less. Scheme C is similar to Scheme B, with the difference that the root genotypes are first crossed with a blank line, which does not carry any target genes, and then intercrossed to fix the target genes. The introduction of a blank line was suggested by Servin et al. (Reference Servin, Martin, Mézard and Hospital2004) with the purpose of obtaining a genotype carrying all favorable alleles in coupling (namely, H (1…n )(B)). This will reduce the population size needed in the fixation step, at the cost of needing one more generation. Scheme D is similar to Scheme C, with the difference that root genotypes are backcrossed with L1 instead of crossing with a blank line, which will reduce the interference of the recombination between genes g1 and g2. Scheme E is similar to Scheme D and the only difference is the order of cumulating genes. In Scheme D, the adjacent genes are first pyramided, while in Scheme E the genes at the two ends are first pyramided. The cross types used in the five schemes are presented in Table 2.
Cross types used in schemes for pyramiding three genes

Schemes for pyramiding four genes
Suppose that the four target genes g1, g2, g3 and g4 are presented in four different lines L1, L2, L3 and L4, respectively. In Scheme F, the four target genes are pyramided (by crossing) and fixed (by intercrossing) one by one successively. Scheme G is similar to Scheme F, with the difference that no intercrosses are conducted in the pyramiding step and a backcross of the root genotype to L1 is introduced for the same reason as that in Scheme D. In Scheme H, genes g1 and g2 are first pyramided and fixed by crossing L1 and L2 and intercrossing the F1 individuals. In the meantime, genes g3 and g4 are pyramided and fixed in the same way. Then the two intermediate genotypes are crossed and then intercrossed to get the ideotype. Scheme I is similar to Scheme H, with the difference that a backcross to a initial line is introduced before each intercross and it needs two generations more than Scheme H. Scheme J is similar to Scheme I, with the difference that no intermediate genotypes with genes g1 and g2, or g3 and g4 fixed are produced and hence it needs one generation less than Scheme I. The cross types used in the five schemes are presented in Table 3.
Cross types used in schemes for pyramiding four genes

Calculation of population size needed at each node in a pyramiding scheme
Population size needed for obtaining a single individual with required genotype at each node
The total population size needed in a pyramiding scheme firstly depends on the population size needed for obtaining a single individual with required genotype at each node. This can be calculated using the following formula proposed by Servin et al. (Reference Servin, Martin, Mézard and Hospital2004):

where P is the probability of success to obtain a required genotype at that node, p f (p m) is the probability that the dam (sire) transmits the gamete carrying the required target genes to the offspring and can be calculated as (Servin et al., Reference Servin, Martin, Mézard and Hospital2004),

where  is the parental genotype consisting of haplotypes s 1 and s 2 which contain different subsets of target genes,
 is the probability that the parent generates gamete s containing all target genes in s 1 and s 2, v(s) is the number of target genes in s, and π(i, i + 1) is the probability of the gamete carrying genes i and i + 1, which is equal to ri ,i + 1 (the recombination rate between genes i and i + 1) if the two genes are in the same haplotype, or 1 − ri ,i + 1 if they are in different haplotypes. Note that if a target gene exists in both s 1 and s 2, it can be excluded from the formula because it will be transmitted with probability of 1. As an example, assume the genotype of the parent is H (1,2)(1,3,4). Here gene 1 exists in both haplotypes, genes 2 and 3 are in different haplotypes and genes 3 and 4 are in the same haplotype. The probability that this parent generates a gamete carrying genes 1, 2, 3 and 4 is
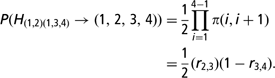
Note that when both p f and p m are equal to 1, n is equal to 1.
Actual population size needed at each node
It should be noted that n calculated from equation (1) is just the population size needed to obtain a single individual with required genotype at a node with the given probability of success. Because of the fertility limitations in animal populations, more than one individual with required genotype at each node are needed to produce enough offspring in the next generation. The number of individuals with required genotype needed at each node depends on the reproductive capacity of the male and female, i.e., the number of females each male can mate with and the number of offspring each female can produce. We can express these numbers as ratio of male and female and total offspring produced by a single male, i.e., male : female : offspring. This ratio varies in different animal species, for example, with natural mating, it is about 1 : 10–20 : 100–200 in pig and 1 : 8–10 : 500–2000 in chicken. For example, if in the next generation, 500 offspring are needed and the reproductive capacity of the male and female is 1 : 10 : 100, then we need 500/10 = 50 females or/and 500/100 = 5 males at this node. In addition, assuming equal probability of an individual being male or female, to obtain a certain number of males (females) with required genotype, a doubled number of individuals need to be produced (although not all of them are actually needed). Based on the above considerations, the actual population size needed at each node can be calculated as

where, λ = 2 if at this node only male or female individuals are used or the individuals are to be intercrossed to produce offspring, and λ = 1 if the individuals at this node and those at another node are to be reciprocally crossed to produce offspring; k is the number of individuals with the required genotype needed at this node. If both males and females are needed at this node, for example, in the case of intercross or reciprocal cross, k equals the larger of the number of males and females needed, and n, as defined above, is the minimum population size needed for obtaining a single individual with required genotype at each node.
Example for calculating the actual population sizes
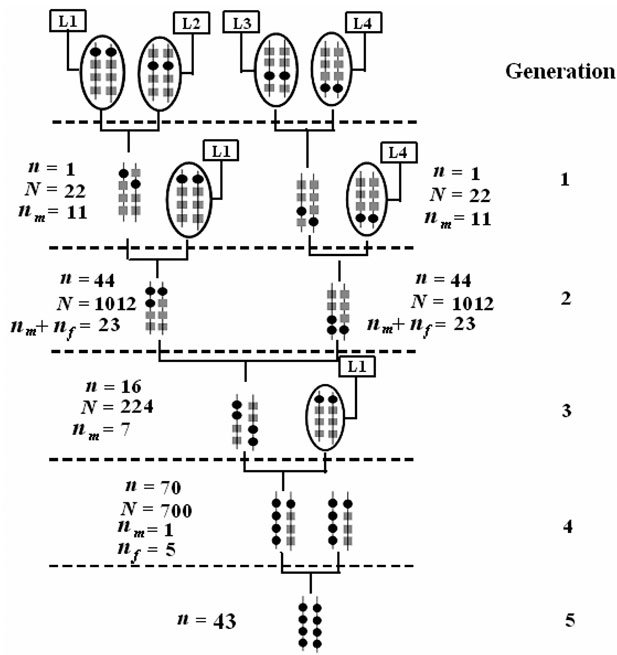
We now illustrate the calculation of the actual population size needed at each node using Scheme J (Figure 3) as an example. We assume (i) all adjacent genes have equal recombination rate of 0.2; (ii) the overall probability of success (i.e., of obtaining the desired ideotype) is 0.95 and the probabilities of success at each node are the same, except for the nodes with probability of success being 1.0 and (iii) the ratio of male : female : offspring is 1 : 10 : 100. In Scheme J, there are a total of seven nodes and the two nodes in the first generation have the probability of success being 1.0. Consequently, to obtain the target success rate of 0.95, the probability of success at the remaining five nodes must be P = 0.951/5 = 0.9898.
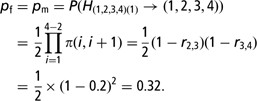
First, we calculate the minimum population size n at each node using equations (1) and (2). The results are shown in Figure 4. For example, for the node in the last generation, to obtain an ideotype, both parents should pass a gamete carrying the four target genes to their offpsring. Since the genotypes of both parents are H (1,2,3,4)(1), where locus 1 is homozygous and the other three target genes are all on the same chromosome, the probability that they pass on the gamete carrying all four target genes to the offpsring is
Population size needed at each node for obtaining one ideotype. n represents the population size needed for obtaining a single individual with required genotype at each node, N represents the actual population size needed at each node. n m and n f respresent the number of male and female individuals with required genotype needed at each node, respectively. It is assumed that the genetic distances between all adjacent target genes are the same with the recombination rate of 0.2, the overall probability of success is 95% and the ratio of male : female : offspring is 1 : 10 : 100.

The minimum population size at this node is

Namely, at least 43 individuals are needed to obtain one ideotype with the probability of success of 0.9898.
Then, we calculate the actual population size at each node, using equation (3) and following a bottom-up procedure. Since 43 individuals are needed in the last generation, at least one male and five female parents with the required genotype in the previous generation (the fourth generation) are needed and they are intercrossed to produce the 43 offspring. So, the actual population size needed at the node in the fourth generation should be N = λkn = 2 × 5 × 70 = 700 (where 70 is the minimum population size for obtaining one individual with the required genotype, i.e., n = 70). At the node in the third generation, line L1 is introduced as the female parents, therefore only male parents with the required genotype are needed. For producing 700 offspring in the fourth generation, 7 such male parents are needed, so the actual population size at this node should be N = 2 × 7 × 16 = 224. To produce these individuals, 23 female and 3 male parents in the second generation are needed. Since reciprocal crosses between individuals of the two nodes in this generation can be conducted, the actual population size at each node is N = 1 × 23 × 44 = 1012. In the first generation, lines L1 and L4 are used as female parents at the two nodes, respectively, so 11 male parents with the required genotype are needed at each node and the actual population size at each node is N = 2 × 11 × 1 = 22. The total population size needed for obtaining an individual with the desired ideotype with the probability of success of 0.95 is the sum of the actual population sizes required at each node, i.e., N T = 22 + 22 + 1012 + 1012 + 224 + 700 + 43 = 3035.
Comparison of different pyramiding schemes
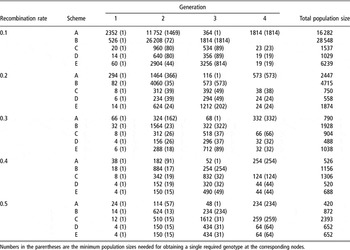
When comparing different pyramiding schemes, two criteria are to be taken into account: the number of generations and the population sizes needed for obtaining an ideotype. For comparison of the schemes proposed above for pyramiding three and four target genes, we assume that the overall probability of success is 95% and the ratio of male : female : offspring is 1 : 10 : 100. The recombination rates between adjacent target genes are set as 0.1, 0.2, 0.3, 0.4 and 0.5, respectively. The number of generations, the population size in each generation and the total population size needed by each scheme for pyramiding three genes and four genes are shown in Tables 4 and 5, respectively.
The population sizes required in each generation and the total population size when cumulating three genes of interest

Numbers in the parentheses are the minimum population sizes needed for obtaining a single required genotype at the corresponding nodes.
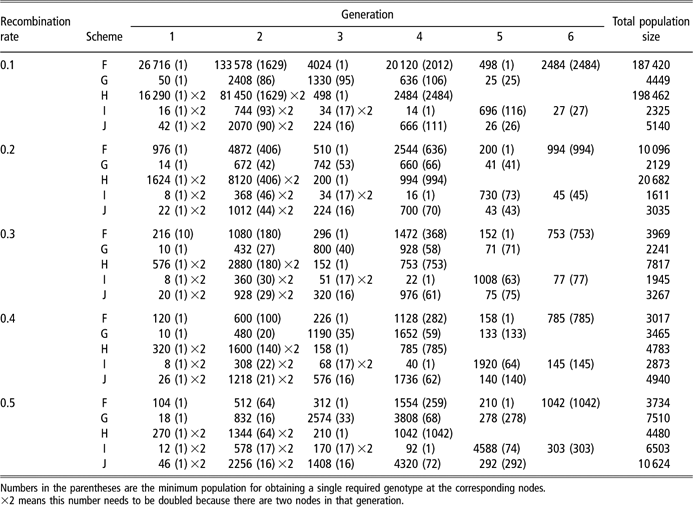
The population sizes required in each generation and the total population size when cumulating four genes of interest
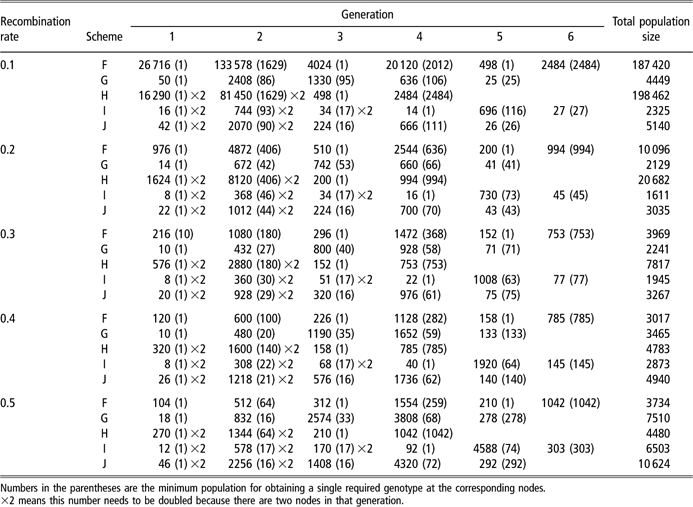
Numbers in the parentheses are the minimum population for obtaining a single required genotype at the corresponding nodes.
×2 means this number needs to be doubled because there are two nodes in that generation.
When pyramiding three genes of interest with the given assumptions, as can be seen in Table 4, in consideration of the total population size, Scheme D has a significant advantage over others in the case of the recombination rate ranging from 0.1 to 0.3; Scheme A is similar to Scheme D when the recombination rate is 0.4, and is optimal when the recombination rate is 0.5. In consideration of the number of generations, Scheme B needs one generation less than all other schemes, but much larger population size in most cases and is difficult to implement. When pyramiding four genes of interest, Table 5 shows that Scheme I is a good choice in the case of the recombination rate ranging from 0.1 to 0.3. When the recombination rate is 0.4, the total population size of Scheme I is a little less than that of Scheme F, but the population size required in the fifth generation is large, so both of them are reasonable alternatives. When the recombination rate is 0.5, Scheme F is the optimal choice. In consideration of the number of generations required, Scheme H needs one or two generations less than the other schemes, but much larger population sizes in most cases.
Discussion
The biggest difference of designing gene-pyramiding schemes in animals from that in plants is that, instead of a single individual, a number of male and female individuals with the required genotype are needed at each node, because self-fertilization cannot be conducted in animals. Therefore, we need to know how many male and female individuals with the desired genotype are needed at each node, and the population size required for obtaining these individuals. To compute this population size, the reproductive capacity of animals has to be taken into account, in addition to the minimum population size needed to obtain a single individual with required genotype. We proposed the corresponding algorithm, which provides a foundation for designing and comparing gene-pyramiding schemes in animal populations. When designing pyramiding schemes in animals, one needs to compare the efficiency of different schemes according to the population sizes as calculated with our algorithm rather than the minimum population size proposed by Servin et al. (Reference Servin, Martin, Mézard and Hospital2004). For example, as seen in Table 5, when pyramiding four genes, Scheme J is generally superior to Scheme I according to the minimum population sizes, whereas Scheme I is superior to Scheme J according to the actual population sizes in most generations and the total population sizes.
We proposed five schemes for pyramiding three and four target genes, respectively, in consideration of the features of animal populations. In addition to these schemes, there are certainly many other schemes available, but the schemes we proposed are representative of the possible alternatives. When carrying out gene pyramiding in animal populations, we must consider the high cost of genotyping as well as raising animals. Therefore, when selecting an optimal scheme, the population size is the most important criterion that determines the feasibility of a scheme. In designing these gene-pyramiding schemes, we invested considerable effort to reduce the population sizes as much as possible. The basic idea is to choose optimal cross types in each generation to minimize the number of recombination events needed when the target genes are on different chromosomes, or reduce the interference of the recombination when the target genes are already on the same chromosome, such that the probability of obtaining the required genotype at each node is the largest and the population size needed is the smallest. For example, in Scheme I for pyramiding four genes, in the pyramiding step (generations 0 to 4), we used cross types I, II, I and I in generations 0, 1, 2 and 3, respectively. In this process, only one recombination event in one parent in generation 1 is required. In the fixation step (generations 4 to 6), before intercrossing the individuals with root genotype, a backcross with one of the founding parents (cross type II) was introduced in generation 4 to reduce the interference of the recombination between genes g1 and g2. On the other hand, the number of generations is also an important factor to be considered because the generation interval is generally long in most animal species. If the population sizes are in the acceptable range, we may select the scheme which is not the best with respect to the population size but needs fewer generations. For example, in the case of pyramiding four target genes and the recombination rate is 0.5, Scheme H needs two fewer generations than Scheme F and the population size in Scheme H is not very much larger than that in Scheme F; so, we may select Scheme H instead of Scheme F if the population size in Scheme H is acceptable.
When comparing the different gene-pyramiding schemes, we assumed that the overall probability of success was 95%. This means that with the given population size we would have a probability of 95% to obtain an ideotype. This overall probability of success has an important effect on the population sizes. The higher this probability, the larger the population sizes needed at each node. For example, if the overall probability of success is increased up to 99% and the recombination rate is 0.5, in Scheme F the population sizes are 178, 890, 436, 2172, 292 and 1457 from the first to the sixth generation, respectively, and the total population size is 5425, which is 1691 more than that in the case of the overall probability of success being 95%. It should be noted that in practical gene pyramiding, the population size required might be much less than that calculated here, because in practical operation it is possible to identify the genotypes of individuals immediately after they are born and once the number of individuals with the required genotype attains the needed amount we will cease producing or genotyping the rest.
The recombination rate between target genes has a large impact on the population sizes needed at each node. As can be seen in Tables 4 and 5, for a certain scheme, the total population size as well as the population sizes at each node vary greatly along with change of the recombination rate between target genes. For Schemes A and B, the total population size decreases monotonically with an increase in the recombination rate between the target genes. This is because for these two schemes, the overall requirement for recombination between target genes is higher than non-recombination, so that a higher recombination rate leads to a higher probability of obtaining the required gametes and so, smaller population sizes. However, this is not the case for the other schemes, where the requirement for recombination or non-recombination is not monotonic, i.e., the overall preference for recombination or non-recombination varies with different recombination rates, resulting in the non-monotonic change of the total population size with different recombination rates.
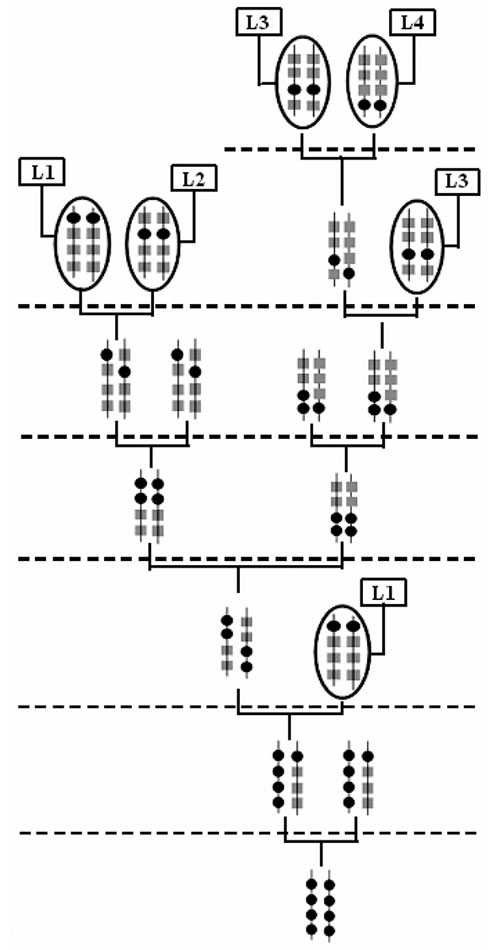
In this study, we assumed that the genetic distances between the adjacent genes were the same. If the genetic distances between adjacent genes are not equal, the optimal schemes suggested here may not be optimal. However, for a specific situation, we can combine advantages of the proposed schemes to design a new scheme. For example, if of the four genes to be pyramided, two (g3 and g4) are on the same chromosome with recombination rate of 0.1 and the other two (g1 and g2) on other two different chromosomes, the optimal scheme may be that as shown in Figure 5, which is in fact a combination of Scheme F (optimal when the recombination rate is 0.5) and Scheme I (optimal when the recombination rate is 0.1). If we still assume that the overall probability of success is 95% and the ratio of male : female : offspring is 1 : 10 : 100, the total population size needed for obtaining an ideotype is 1749, whereas when using Scheme F or Scheme I the total population sizes are 4507 and 1876, respectively.
A pyramiding scheme for the case where the recombination rates between the four target genes are unequal. g3 and g4 are on the same chromosome with recombination rate of 0.1, g1 and g2 are on other two different chromosomes.
The reproductive capacity of the animals is one of the most important factors influencing the population sizes necessitated. In this study, we assumed that the ratio of male : female : offspring is 1 : 10 : 100. The population sizes will decrease with increase in this ratio. For example, for Scheme F and in the case of the recombination rate being 0.5, if the ratio is 1 : 10 : 200 (increasing the number of offspring per female) and 1 : 20 : 200 (increasing the number of females with which each male can mate), the total population sizes are 1860 and 2804, respectively, which are 1874 and 930 less than that when the ratio is 1 : 10 : 100. Obviously, the number of offspring each female can produce has a larger effect on the population sizes.
It should be noted that the results of this study are based on generating a single individual with the desired ideotype. To find a new population of individuals that are fixed at all target alleles, many more individuals with the desired ideotype would be needed and the population sizes would be much larger than those in Tables 1 and 2 and become unfeasible under the assumed conditions. However, the population size will decrease dramatically with the increase of the reproduction capacity. For example, assuming the ratio of male : female : offspring being 1 : 10 : 500 and the recombination fraction between target genes being 0.20, the total population sizes for obtaining an individual with the desired ideotype with a probability of success of 95% are 202 for pyramiding three genes using Scheme D and 307 for pyramiding four genes using Scheme J, which are acceptable in practice even when more individuals with the desired ideotype are needed. Therefore, for animals with very high reproductive capacity (such as chicken), it is still feasible to conduct gene pyramiding in some cases if an optimal scheme is applied, in particular with the development of the genotyping technology, which leads to a significant reduction of genotyping cost.
Weller and Soller (Reference Weller and Soller1981) proposed a strategy for production of a multi-marker strain using a series of strains, each carrying a single marker by recurrent cycles of random mating, and selection based on the number of desired alleles carried by the individuals. Piyasatian et al. (Reference Piyasatian, Fernando and Dekkers2008) also suggested a similar strategy for gene pyramiding by creating a synthetic of the breeds that carry favorable alleles and then conducting MAS within the synthetic to increase the frequency of favorable alleles. They showed, for a two-way cross of inbred lines, that allele frequencies at five QTL could be increased from 0.25 to close to fixation, by MAS, in four intercross generations of MAS in a population of 500 individuals. An advantage of this strategy is that it allows selection for other traits. Further studies are needed on this strategy and to compare it with the pyramiding schemes presented in this paper under various conditions.
Acknowledgements
The authors are grateful to Prof. Morris Soller for his suggestions and two anonymous reviewers for helpful comments. This work was supported by the National High Technology Development Project of China (863 Program) (Grant No. 2006AA10Z1D7) and the State key Basic Research Project of China (973 Program) (Grant No. 2006CB102104).