Implications
Different nutritional strategies can impact dairy cows’ lactational performance. This study evaluated the effect of varying dietary energy and nutrient level, both pre- and post-calving using different breeds. As milk yield obviously also depends on feeding during the dry period, the same attention must be given as during the productive phase. Meeting dairy cows’ energy and nutrient requirements in early lactation is necessary to avoid economic losses in milk production. Increasing energy supply pre partum enhances milk yield and content post partum, but exacerbates the problem of negative energy balance and its consequences.
Introduction
Over the last decade, significant increases in milk production have been realized in Europe due to the continuously increasing genetic merit of dairy cows and the intensified use of concentrates (Knaus, Reference Knaus2009). Energy requirements of dairy cows increase two- to three-fold from 21 days before to 21 days after calving (Drackley et al., Reference Drackley, Overton and Douglas2001). As dry matter intake (DMI), and thus the amount of nutrient and energy obtained from dietary sources, lags far behind requirements during early lactation, this consequently results in a negative energy balance. The mobilization of nutrients, mainly from adipose tissue (McNamara, Reference McNamara1991), but also from skeletal muscle, to provide an adequate supply to the mammary gland is regulated by an insulin-resistant state, which accompanies the negative energy balance of early lactation (Bauman, Reference Bauman2000). In order to fully understand changes occurring in the biology of dairy cows during the periparturient period, and with the goal of maximizing milk production in the subsequent lactation and minimizing incidences of disease, numerous studies have been conducted in this area in the last 20 years (e.g. reviews of Lins et al., Reference Lins, Gruber and Obritzhauser2003; Friggens et al., Reference Friggens, Andersen, Larsen, Aaes and Dewhurst2005). Feeding strategies in these experiments have either focused on maximizing DMI or energy intake during the close-up period, or in contrast, on limiting energy supply during the dry period to promote a high DMI post partum (Dann et al., Reference Dann, Litherland, Underwood, Bionaz, D’Angelo, McFadden and Drackley2006). Regarding the effects of pre-calving DMI and energy intake on post-calving feed intake and milk production, results are still inconclusive and warrant further study (Remppis et al., Reference Remppis, Steingass, Gruber and Schenkel2011).
Although increasing the energy density of post-calving diets by increasing concentrate supplementation improves milk production (Friggens et al., Reference Friggens, Emmans, Kyriazakis, Oldham and Lewis1998; McNamara et al., Reference McNamara, O’Mara, Rath and Murphy2003), there is evidence that as the level of concentrate feeding increases, milk yield responses to additional concentrate in the ration are reduced considerably (Huhtanen, Reference Huhtanen1998). Decreased milk yield when energy or feed was restricted post partum was reported by Kunz et al. (Reference Kunz, Blum, Hart, Bickel and Landis1985) and Roche (Reference Roche2007), whereas interactions of pre- and post-calving nutrition were existent in the study by Law et al. (Reference Law, Young, Patterson, Kilpatrick, Wylie, Ingvartsen, Hameleers, McCoy, Mayne and Ferris2011). A smooth and successful transition from the late gestation to the early lactation period is of crucial importance because it effectively determines the profitability of cows during that lactation (Drackley, Reference Drackley1999).
Whereas Holsteins are by far the most important dairy breed world-wide, in some Central European countries (regions) like Austria, Switzerland and Southern Germany, etc. the dual purpose Simmental breed and Brown Swiss make up considerable proportions of cattle (e.g. 72% Simmental, 14% Brown Swiss, 11% Holstein; percentage of controlled cows in Austria; ZAR (Association of Austrian Cattle Breeders, 2012)). There is mounting evidence that reliance on body reserves is increased and that robustness of dairy cows is reduced by selection for increased milk production (Friggens et al., Reference Friggens, Brun-Lafleur, Faverdin, Sauvant and Martin2011). Coffey et al. (Reference Coffey, Simm, Oldham, Hill and Brotherstone2004) compared two cow genotypes of different milk yield potential from the Langhill herd over three total lactations. This herd has been selected for maximum production or to remain at the UK national average for production (control group) and has been fed two diets of different energy density (high or low concentrate). Cows selected for maximum production lost more body lipid than control cows on either diet, indicating that selection mainly for yield has predisposed cows to utilize body energy to support lactation on both diets used. Similarly, Yan et al. (Reference Yan, Mayne, Keady and Agnew2006) investigated the effects of dairy cow genotype (Holstein v. dual purpose Norwegian) with two planes of nutrition on energy partitioning between milk and body tissue during one total lactation. Holstein cows produced more milk energy than Norwegian cows, mainly as a result of higher metabolizable energy (ME) intake and because of a greater ability to partition more energy into milk and less into body tissue, mainly in early and mid-lactation and particularly with high concentrate diets.
Therefore, the objectives of the current study were to investigate the effects of pre-calving and post-calving dietary energy as well as nutrient supply and their interactions on feed intake, performance and energy status in the dry period and in the subsequent early lactation period of multiparous cows of breeds Simmental, Brown Swiss and Holstein.
Material and methods
The study was conducted at the Federal Agricultural Research and Education Centre Raumberg-Gumpenstein in the province of Styria, Austria. Ethical approval for the study was given by the Department III/5 – Animal husbandry/Protection of animals – of the Austrian Federal Ministry of Agriculture, Forestry, Environment and Water Management. Cows were managed in compliance with good husbandry practices (Austrian Ministry of Health, 2004).
Experimental design, diets and feeding
A pre-experimental period of two weeks was used. The forage diet during this period consisted of ⅓ hay, ⅓ grass silage and ⅓ corn silage (dry matter (DM) basis). From –98 days through –92 days before they were due to calve, cows were fed according to energy requirements (German Society of Nutrition Physiology, 2001) and milk yield as well as milk composition were recorded in order to obtain a measure for milk yield potential. In a similar way, cows received a ration composed of 85% forage and 15% concentrates from –91 days through –85 days, in order to obtain a measure of feed intake capacity. Both forage and concentrate were the same as in the experimental period.
In this experiment the effects of three energy and nutrient supply levels (low (L), medium (M), high (H)), both pre-calving (PRE) and post-calving (POST), were investigated, using a 3×3 factorial arrangement of treatments. In both phases (i.e. pre-calving and post-calving) energy and nutrient supply levels applied to the cows were 75%, 100% and 125% of recommendations of the German Society of Nutrition Physiology (GfE, 2001), resulting in three experimental groups pre partum (L, M, H) as well as nine experimental groups post partum (LL, LM, LH, ML, MM, MH, HL, HM and HH). The energy and nutrient supply level, that is composition, as well as amount of diets were adjusted according to the experimental design (energy level) two times a week during the whole experiment, based on feed intake and milk yield of the preceding 3 to 4 days. Cows were studied from 84 days before they were due to calve and were dried off 66±7 days before calving (i.e. 18 days of preceding lactation was included in the pre-calving phase). The post-calving phase lasted for 105 days.
In experimental groups L, M and H forage diets consisted of varying proportions of grass silage, corn silage and hay, differing in energy density. To achieve the intended experimental energy and nutrient supply, treatments differed mainly in concentrate level. If energy intake exceeded the experimental target values, feed intake was restricted. Cows in HPOST treatments were fed for ad libitum intake. Forages and concentrates were offered separately in the following order: (1)
 $$1\over 2$$
concentrate, (2) hay, (3) corn silage, (4)
 $$1\over 2$$
concentrate and (5) grass silage. Feeding times were 0430 to 0830 and 1500 to 1900 h. To ensure full intake, during the dry period minerals were top-dressed on the corn silage and during lactation they were mixed with concentrates.
Except for the last week of pregnancy, no concentrates were fed during the dry period. Concentrate amounts were increased progressively during the first week of lactation (0.3, 0.6 and 0.9 kg increase per day in LPOST, MPOST and HPOST, respectively). Subsequently concentrate proportions were assigned according to experimental design. Concentrate amounts were increased in 1 kg steps per day, if necessary. To avoid rumen acidosis, concentrate amounts higher than 4 kg per meal were offered in three portions. The rations were formulated to meet or exceed the nutrient requirements of the cows (mineral composition provided in Table 2).
Animals and housing
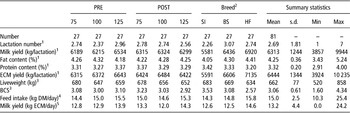
A total of 81 multiparous cows of the breeds Simmental (SI), Brown Swiss (BS) and Holstein–Friesian (HF) were used in the feeding trial (n=27 for each breed). Data in Table 1 shows that cows were well balanced among groups 75, 100 and 125 both PRE and POST for the factors lactation number, milk yield and milk content, feed intake, liveweight and body condition score (BCS). On the other hand, as expected, significant differences existed between the breeds regarding these parameters, according to the typical characteristics of the breeds (higher liveweight and BCS with SI, higher feed intake and milk yield with HF, BS being intermediate).
Characteristics of dairy cows before starting the experimentFootnote 1
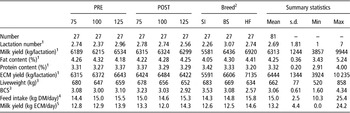
DM=dry matter; ECM=energy-corrected milk.
1 Total lactation of PRE phase.
2 Breed: SI=Simmental, BS=Brown Swiss, HF=Holstein–Friesian.
3 Week –2 and –1 before start of experiment.
4 Week –1 before start of experiment.
5 Week –2 before start of experiment.
Animals were housed in individual tie stalls with rubber mat bedding and free access to fresh water throughout the experiment. All cows were allowed to exercise daily in an outside lot from 1300 to 1500 h.
Measurements and chemical analyses
Cows were milked twice daily at 0500 and 1600 h. Milk yield was recorded at the morning and evening milking (Tru-Test, Auckland, New Zealand). Milk compositional analysis was conducted daily with individual samples taken at each milking and pooled for 1 day. Milk fat, protein, lactose and milk urea concentrations were determined by an infrared spectrophotometric method using a Milkoscan instrument (MilcoScan MSC-605; Foss, Hillerød, Denmark) at an official Austrian milk-recording laboratory. BW of the animals was recorded weekly. Feeds offered and refusals were determined daily at each meal and analysed for DM (drying at 105°C for 24 h). Daily feed samples were pooled over 4 weeks and subjected to oven drying for DM determination, proximate analysis (CP, ether extract, crude fibre, crude ash) according to the guidelines of the Association of German Agricultural Analytic and Research Institutes VDLUFA (2007), and analysis of cell wall constituents NDF, ADF and ADL (Van Soest et al., Reference Van Soest, Robertson and Lewis1991) using Foss Fibertec System (Foss). The loss of volatile substances occurring during oven drying was accounted for using equations of Weissbach and Kuhla (Reference Weissbach and Kuhla1995).
Data calculation
Data calculations followed the GfE (2001) methodology: Energy-corrected milk (ECM)=(0.38×milk fat%+0.21×milk protein%+0.95)×kg of milk/3.2, maintenance requirements (NEM)=0.293×BW0.75, pregnancy requirements (NEC)=(0.044×exp0.0165×days pregnant+0.01905×days pregnant–3.6619)/0.175×0.6, lactation requirements (NELAC)=(0.38×milk fat%+0.21×milk protein%+1.05)×daily milk yield.
Calculation of energy concentration of feedstuffs was based on crude nutrients (gross energy) and in vivo digestibility coefficients (ME, net energy lactation (NEL)) obtained using sheep and the respective regression equations as outlined by GfE (1995). Digestibility trials were carried out according to the guidelines for determination of crude nutrient digestibility with ruminants of GfE (1991), using 4 wethers per forage. The digestibility of concentrate was determined according to the regression method as described by Giger and Sauvant (Reference Giger and Sauvant1983), using concentrate levels of 0%, 25%, 50% and 75% of DM and 16 wethers (four per concentrate level). The net energy intake (NEI) of each cow was determined by multiplying the DMI of individual feedstuffs with their calculated energy concentration. In the German NEL system (GfE, 2001) the influence of feeding level on digestibility and ME content in ruminants is considered by increasing the requirement by 0.1 MJ NEL per each kg milk.
Estimated daily energy balance (DEB) was calculated by subtracting energy requirements from energy intake as follows: In the late lactation period (pre-dry off) DEB=NEI–(NEM+NELAC+NEC) in the pre partum period DEB=NEI–(NEM+NEC), in the post partum period DEB=NEI–(NEM+NELAC), and was expressed in MJ/day. Days pregnant were calculated retrospectively, using actual calving dates. In calculating DEB, neither mobilization nor retention of body tissue were accounted for in cases of negative or positive energy balance, respectively.
Statistical analyses
Data of pre- and post-calving periods were analysed separately. Statistical analyses were conducted using the SAS MIXED procedure (version 9.2; SAS Institute, 2010) with the following model:
 $$\eqalignno{ y_{{ijklm}} = \,& \mu {\plus}E_{{{PRE}i}} {\plus}E_{{{POST}j}} {\plus}B_{k} {\plus}P_{l} {\plus}W_{m} \cr & {\plus}\left( {E_{{{PRE}}} {\times}{\rm }E_{{{POST}}} } \right)_{{ij}} {\plus}\left( {E_{{{PRE}}} {\times}{\rm }B} \right)_{{ik}} {\plus}\left( {E_{{{POST}}} {\times}{\rm }B} \right)_{{jk}} \cr &{\plus}\left( {E_{{PRE}}} {\times}{\rm }E_{{{POST}}} {\times}{\rm }B} \right)_{{ijk}} {\plus}{\rm }\left( {E_{{{PRE}}} {\times}{\rm }W} \right)_{{im}} \cr &{\plus}\left( {E_{{{POST}}} {\times}{\rm }W} \right)_{{jm}} {\plus}\left( {E_{{{PRE}}} {\times}{\rm }E_{{{POST}}} {\times}{\rm }W} \right)_{{ijm}} {\plus}{\varepsilon}_{{ijklm}} $$
where y ijklm is an observation from the ith pre-calving treatment, jth post-calving treatment, kth breed and lth parity; µ the grand mean; E PREi the effect of the ith pre-calving treatment; E POSTj the effect of the jth post-calving treatment; B k the effect of the kth breed; P l the effect of the lth parity; W m the mth experimental week; (EPRE×EPOST ) ij the effect of the pre-calving treatment by post-calving treatment interaction; (EPRE×B) ik the effect of the pre-calving treatment by breed interaction; (EPOST×B) jk the effect of the post-calving treatment by breed interaction; (EPRE×EPOST×B) ijk the effect of the pre-calving treatment by post-calving treatment by breed interaction; (EPRE×W) im the effect of the pre-calving treatment by week interaction; (E POST ×W) jm the effect of the post-calving treatment by week interaction; (E PRE ×E POST ×W) ijm the effect of the pre-calving treatment by post-calving treatment by week interaction; ε ijklm the random residual error. Interactions of parity with the other factors were not estimable and so were not included in the final models. For repeated measures, a first-order autoregressive covariance structure was used. Denominator degrees of freedom were approximated with the Kenward–Roger method.
Differences of least squares means were calculated with the PDIFF option of the LSMEANS statement using Tukey’s method for the adjustment of multiple comparisons.
Results
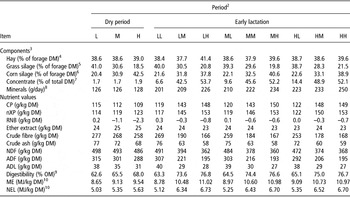
The forage composition, concentrate proportion and nutrient content of total rations, based on realized feed intake, is shown in Table 2.
Forage composition, concentrate proportion and nutrient content of total rationsFootnote 1 supplying low (L), medium (M) or high (H) energy levels
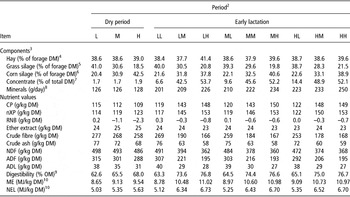
DM=dry matter; RNB=ruminal nitrogen balance; ME=metabolizable energy; NEL=net energy lactation.
1 Based on actual feed intake.
2 Period: dry period=–66±7 days before parturition until calving; early lactation=calving until 105 days of lactation.
3 Meadow forage for hay and silage production was harvested from alpine permanent grassland (65% grasses, 15% legumes, 20% herbs), forage maize was from two breeds (FAO 230 and 260). Hay, differing in energy density, was offered in varying proportions: in the L treatments 100% low-quality hay, in the M treatments 50% low- and 50% high-quality hay, and in the H treatments 100% high-quality hay.
4 Nutrient values (mean±standard deviation (s.d.) per kg DM): 603±40 g NDF, 99±15 g CP, 105±4 g utilizable CP at the duodenum (nXP; GfE, 2001), –1.1±1.9 g RNB (GfE, 2001), 4.48±0.16 MJ NEL (low quality); 579±21 g NDF, 120±8 g CP, 123±5 g nXP, –0.5±1.1 g RNB, 5.40±0.29 MJ NEL (high quality).
5 Nutrient values (mean±s.d. per kg DM): 478±33 g NDF, 154±14 g CP, 120±6 g nXP, 5.4±1.9 g RNB, 5.13±0.32 MJ NEL.
6 Nutrient values (mean±s.d. per kg DM): 440±36 g NDF, 81±6 g CP, 125±3 g nXP, –7.1±0.8 g RNB, 6.05±0.16 MJ NEL.
7 Composition (% in DM): 24% corn grain, 16% barley, 16% sugar beet pulp, 12% wheat, 12% wheat bran, 6.7% soya bean meal, 6.7% rapeseed meal and 6.7% sunflower meal; nutrient values (mean±s.d. per kg DM): 247±20 g NDF, 182±12 g CP, 182±4 g nXP, 0.1±0.3 g RNB, 7.83±0.03 MJ NEL. To adapt rumen microbes to the lactation rations, all cows were fed 1 kg concentrates for 1 week before they were due to calve.
8 Minerals were supplied according to current recommendations (GfE, 2001) in all groups and production phases, using limestone (380 g Ca), salt (380 g Na) and a premixed mineral supplement (92 g Ca, 126 g P, 43 g Mg and 117 g Na per kg). Additionally, all cows received 120 g of a mineral–vitamin mix containing (per kg) 520 mg Fe, 1400 mg Mn, 5400 mg Zn, 220 mg Cu, 150 mg I, 13 mg Co, 6 mg Se, 1000 kIU/kg of vitamin A, and 110 kIU/kg of vitamin D3 per day.
9 Nutrient digestibility values of individual feedstuffs determined in vivo using wethers (concentrate with the regression method; Giger and Sauvant, Reference Giger and Sauvant1983).
10 calculated according to GfE (1995).
Parameters in the late lactation period (week –12 to –9 before calving)
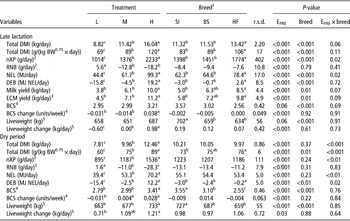
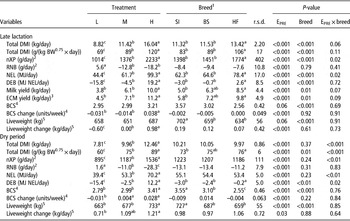
According to the experimental design, feed and nutrient intake differed significantly between the groups in the late lactation period (Table 3). Forage intake was 8.6, 10.8 as well as 11.2 kg DM/day and concentrate intake was 0.1, 0.5 and 4.7 kg DM/day for LPRE, MPRE and HPRE, respectively. Consequently, there was a significant influence of EPRE and breed on NEL intake (ΔMPRE–LPRE=17 and ΔHPRE–MPRE=38 MJ NEL/day, and SI/BS<HF, respectively) and DEB. Milk yield and composition were typical of late lactation cows. L cows lost liveweight and BCS whereas H cows gained liveweight and BCS, M cows being intermediate (Table 3).
Least squares means of DMI and nutrient intake, milk yield and composition as well as energy balance and BCS of multiparous cows during late lactation (pre-dry off) and during the dry period fed diets supplying low (L), medium (M) or high (H) energy levels pre partum
DMI=dry matter intake; NEL=net energy lactation; DEB=daily energy balance.
a–cMeans within a row with different superscripts differ.
1 Breed: SI=Simmental, BS=Brown Swiss, HF=Holstein–Friesian.
2 nXP=utilizable crude protein at the duodenum, RNB=ruminal nitrogen balance (GfE, 2001).
3 Energy-corrected milk (ECM)=(0.38×milk fat%+0.21×milk protein%+0.95)×milk yield/3.2 (GfE, 2001).
4 BCS=body condition score (Edmonson et al., Reference Edmonson, Lean, Weaver, Farver and Webster1989).
5 Liveweight was recorded once weekly, liveweight change was calculated using polynomial regression.
Parameters in the dry period (week –8 to –1 before calving)
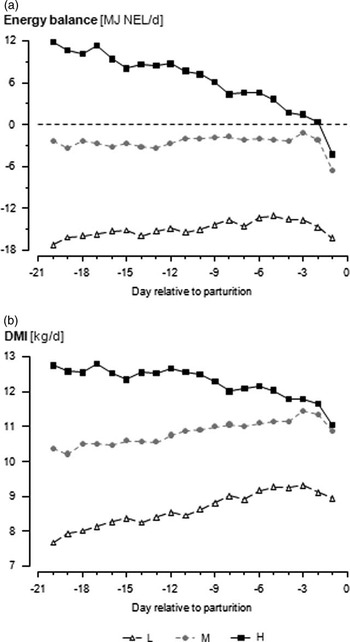
Apart from the week before animals were due to calve, when 1 kg of concentrates was fed to adapt rumen microbes to the lactation diet, only forages were fed in different proportions. DMI increased (P<0.001) in a linear manner from treatment L to H (Table 3). With this feeding regime, the difference (P<0.001) of DEB between LPRE and HPRE was 27.6 MJ NEL/day (51% expressed in terms of energy requirements). In contrast to treatments LPRE and MPRE, where the intended energy supply could be maintained through increasing feed intake, the DMI of cows of treatment HPRE could not be increased in the last weeks of gestation (Figure 1). For this group, DMI decreased from week –3 to calving. The corresponding magnitude of depression of DEB for treatment HPRE between week –3 and the day before calving was 14.3 MJ NEL/day (Figure 1), a drop from 117% to 94% in terms of energy requirements.
Least squares means of energy balance (a) and dry matter intake (DMI, b) of multiparous cows fed diets supplying low (L), medium (M) or high (H) energy levels during the pre partum period. For energy balance, effects of treatment, breed, time, and interactions of treatment × breed, and treatment × time were significant at the levels of P=<0.001, 0.012, <0.001, 0.018 and <0.001, respectively (s.e.=1.0). For DMI, effects of treatment, parity, time, and interactions of treatment × breed, and treatment × time were significant at the level of P<0.001 (s.e.=0.17).

SI cows were significantly heavier (P<0.001), and had the highest (P<0.001) BCS in the dry period, as compared with the other breeds. BCS for SI, BS and HF cows was 3.55, 3.10 and 2.55, respectively. Subsequently, total DMI, expressed as proportion of metabolic BW, was higher (P=0.01) for HF cows than for SI cows.
Milk yield and milk composition in the lactation period (1 to 105 days in milk)
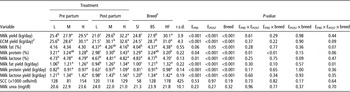
Energy supply before parturition (main effect of EPRE) had a major impact on milk production variables post-calving (Table 4). Milk yield of cows of treatment LPRE was significantly lower (P<0.001) than for groups MPRE and HPRE, the differences being 3.0 and 4.5 kg ECM/day, respectively. Milk protein concentration was lower (P=0.044) for LPRE compared with HPRE. Milk fat concentration tended to be lower (P=0.055), and milk lactose concentration was lower (P=0.006) for LPRE compared with the other pre partum treatments. Yields of milk components all differed significantly (P<0.001). Milk urea concentration was in a similar range (P=0.231) in all pre-calving treatments, averaging 22.3 mg/100 ml.
Main effects of a low (L), medium (M) or high (H) energy supply during the pre and post partum period on milk production variables (least squares means) of multiparous cows from 1 to 105 days of lactation

SCC=somatic cell count (×1000 cells/ml).
a–cMeans within a row with different superscripts differ.
1 Breed: SI=Simmental, BS=Brown Swiss, HF=Holstein–Friesian.
2 Energy-corrected milk (ECM)=(0.38×milk fat%+0.21×milk protein%+0.95)×milk yield /3.2 (GfE, 2001).
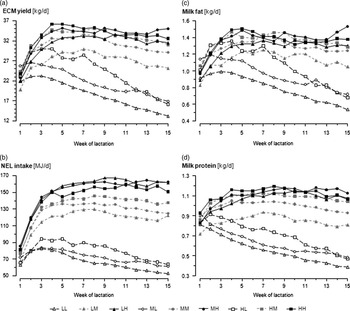
Apart from milk protein concentration, no significant interactions of EPRE×EPOST regarding milk yield and composition existed (Figure 2). For milk protein, the interaction (P=0.006) showed that, in contrast to MPOST and LPOST treatments, HPOST concentrations decreased with a higher pre partum energy supply.
Least squares means of energy-corrected milk (ECM) yield (a) and energy (NEL) intake (b), and yields of milk fat (c) and milk protein (d) of multiparous cows fed diets supplying low (L), medium (M) or high (H) energy levels during the pre and post partum period. Treatments: LL=low energy supply (E) pre partum (PRE), low E post partum (POST); LM=low EPRE, medium EPOST; LH=low EPRE, high EPOST; ML=medium EPRE, low EPOST; MM=medium EPRE, medium EPOST; MH=medium EPRE, high EPOST; HL=high EPRE, low EPOST; HM=high EPRE, medium EPOST; HH=high EPRE, high EPOST. For ECM yield, effects of EPRE, EPOST, breed, parity, time, and interaction of EPOST×time were significant at the level of P<0.001 (s.e.=1.4). Interactions of EPRE×time and of EPRE×EPOST×breed tended to be significant at the levels of P=0.08 and 0.09, respectively (s.e.=1.4). For NEL intake, effects of EPRE, EPOST, breed, parity, time and interaction of EPRE×EPOST, EPOST×time were significant at the levels of P=0.009, 0.001, 0.001, 0.001, 0.001, 0.004 and 0.001, respectively (s.e.=4.4). Interaction of EPRE×EPOST×time tended to be significant at the level of P=0.07. (s.e.=4.4). For milk fat yield, effects of EPRE, EPOST, breed, parity, time and interaction of EPOST×time were significant at the level of P<0.001, interaction of EPRE×EPOST×breed at the level of P=0.01 (s.e.=0.07). Interaction of EPRE×breed tended to be significant at the level of P<0.10 (s.e.=0.07). For milk protein yield, effects of EPRE, EPOST, breed, parity, time and interactions of EPOST×time, and EPRE×EPOST×time were significant at the level of P<0.001 (s.e.=0.05).

Influence of energy supply after calving was significant for almost all relevant production variables (Table 4). Milk yield increased (P<0.001) with energy level (+11.0 kg ECM/day for HPOST and +8.5 for MPOST, as compared with LPOST). This was also true for milk protein concentration, and yields of milk protein and milk lactose (P<0.001). Milk fat concentration differed (P=0.05) for LPOST and HPOST. Milk lactose concentrations for treatments HPOST and MPOST were higher (P<0.001) than for LPOST.
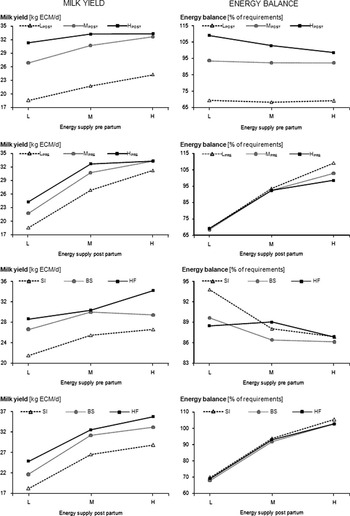
The typical characteristics of the breeds existed also in terms of milk production variables. The effect of breed was highly significant (P<0.001) regarding the milk yield, milk composition and yield of milk components (Table 4). Interactions of EPRE×breed as well as EPOST×breed were statistically not significant (with the exception of milk protein concentration), meaning that – strictly speaking – energy supply pre and post partum affected milk production variables of the respective breeds in the same way. Nevertheless, trends for an EPRE×EPOST interaction and an EPRE×breed interaction existed regarding milk yield and energy balance (Figure 3). A trend to a three-way pre-calving treatment by post-calving treatment by breed interaction existed regarding milk fat and protein concentration, but not for milk yield. The low number of animals (n=3) in these subclasses has to be taken into account.
Least squares means of energy-corrected milk (ECM) yield (panels on the left side) and energy balance (panels on the right side) of multiparous Simmental (SI), Brown Swiss (BS) and Holstein–Friesian (HF) cows fed diets supplying low (L), medium (M) or high (H) energy levels (E) during the pre (PRE) and post partum (POST) period. For ECM yield, effects of EPRE, EPOST, breed, parity, time and interaction of EPOST×time were significant at the level of P<0.001. Interactions of EPRE×time and of EPRE×EPOST×breed tended to be significant at the levels of P=0.08 and 0.09, respectively. For energy balance, effects of EPRE, EPOST, parity, time and interactions of EPRE×EPOST and of EPOST×time were significant at the levels of P=<0.001, <0.001, 0.001, <0.001, <0.001 and <0.001, respectively. The effect of breed and interactions of EPRE×breed and EPRE×EPOST×breed tended to be significant at the levels of 0.07, 0.07 and 0.05, respectively.

DMI and energy intake in the lactation period (1 to 105 days in milk)
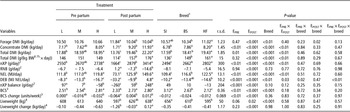
There were no significant interactions between EPRE×EPOST with regard to forage intake (P=0.397), which averaged 10.6 kg DM. Concentrate intake was highest (P=0.001) for HPOST groups, where an average F : C ratio (DM basis) of 46 : 54 was realized (Table 5). Energy restriction, in order to achieve the targeted energy supply values, led to considerably varying concentrate intake (P=0.001) and total DMI (P=0.005). The highest feed intake (MH) was almost twice that of the lowest (LL). In contrast to the feed restricted treatments (LPOST, MPOST), where high EPRE led to the highest feed intake, for ad libitum fed groups (HPOST) DMI and subsequently NEL intake was numerically lower for HH as compared with LH and MH, starting in week 5 of lactation (Figure 2). Energy balance (DEB, and % of NEL requirements) for treatment LH was significantly higher (P<0.05) as compared with MH and HH. For LPOST groups LL had a higher DEB than LH (P=0.043), whereas for MPOST treatments DEB did not differ.
Main effects of a low (L), medium (M), or high (H) energy supply during the pre and post partum period on DMI and nutrient intake (least squares means) of multiparous cows from 1 to 105 days of lactation

DMI=dry matter intake; NEL=net energy lactation; DEB=daily energy balance.
a–cMeans within a row with different superscripts differ.
1 Breed: SI=Simmental, BS=Brown Swiss, HF=Holstein–Friesian.
2 nXP=utilizable crude protein at the duodenum, RNB=ruminal nitrogen balance (GfE, 2001).
3 BCS=body condition score (Edmonson et al., Reference Edmonson, Lean, Weaver, Farver and Webster1989).
4 Liveweight was recorded once weekly, liveweight change was calculated using polynomial regression.
Although statistical analysis revealed an effect of energy level pre partum on feed and nutrient intake post partum, interpretation of results is difficult due to the controlled offering of feed post-calving (only cows of HPOST treatment were fed ad libitum).
As expected, significant differences (P<0.001) existed among the breeds regarding feed and nutrient intake, liveweight and BCS, according to the typical characteristics of the breeds (higher liveweight and BCS with SI, higher feed and nutrient intake with HF, BS being intermediate; Table 5). Interactions of EPRE×breed and EPRE×EPOST×breed existed only for DEB (P=0.02 and <0.01, respectively). While energy balance post partum decreased with higher energy supply pre partum for SI and HF cows (–3.7, –11.5, –15.4 MJ NEL/day, and –11.9, –12.2, –19.8 MJ NEL/day for LPRE, MPRE and HPRE, respectively), BS cows experienced the lowest DEB with medium energy supply pre-calving (–9.3, –16.2 and –14.8 MJ NEL/day for LPRE, MPRE and HPRE, respectively). For HPOST treatment (the only ad libitum fed animals), a low energy supply pre partum (LPRE) resulted in higher DEB for SI and BS cows post partum (18.2, 6.2, –4.2 MJ NEL/day, and 14.8, –0.7, –0.2 for LH, MH and HH, respectively) but for HF cows MPRE was most favourable for energy balance in the lactation period (3.4, 7.6 and –1.8 for LH, MH and HH, respectively).
Discussion
The experiment focused on investigating the effects of differing energy supply. This was designed by varying NEL concentration of diets (achieved by different forage quality as well as concentrate proportion) and restricting DMI, if necessary. There is clear evidence that microbial protein synthesis mainly depends on the amount of fermentable organic matter available to ruminal microbes (e.g. Institut National de la Recherche Agronomique (INRA), 1989; Russell et al., Reference Russell, O’Connor, Fox, Van Soest and Sniffen1992; Agricultural Food and Research Council (AFRC), 1993), meaning that supply of host animals with metabolizable protein (National Research Council (NRC), 2001) or utilizable protein at the duodenum (nXP; GfE, 2001) cannot be kept constant in different energy supply levels. Likewise, a similar supply of CP in all treatment groups also would not result in equal nXP supply. It was therefore decided to provide ruminal microbes with adequate amounts of rumen degradable protein in each energy level (L, M, H), in order to ensure optimal microbial protein synthesis. Based on ruminal nitrogen balance (RNB; GfE, 2001) values (Tables 2, 3 and 5), this prerequisite for efficient microbial protein synthesis was achieved quite well in phase post partum, the mean RNB being –6.9 g/day. This corresponds well to the urea concentration in milk (mean of 22.3 mg/dl, Table 4; range of 18.8 to 24.4 mg/dl in several subclasses). According to literature data, urea concentrations in milk of 16 to 24 mg/dl (Kirchgessner et al., Reference Kirchgessner, Kreuzer and Roth-Maier1986) and 20.8 mg/dl (Steinwidder and Gruber, Reference Steinwidder and Gruber2000) reflect optimal nutrient supply in dairy cows. In phase pre partum RNB declined with energy level (Table 2) since proportion of maize silage increased and no concentrate was offered. It can be assumed that ruminal N recycling compensates for this N deficiency, as protein requirement of host animals is low in nonlactating, pregnant cows (GfE, 2001; Lapierre and Lobley, Reference Lapierre and Lobley2001). Regarding the protein supply of the host animals it can be seen that this protein feeding strategy influenced the calculated protein balance (nXP intake – nXP requirement) in a similar way as the calculated energy balance (NEL intake – NEL requirement), but on a higher level, meaning that protein supply was not the first limiting nutrient (e.g. 88%, 102%, 108% of nXP requirement and 69%, 93%, 103% of NEL requirement in groups L, M, H post partum). Therefore, the results are discussed based on differences in NEL intake, taking into account that potential effects could partly be attributed to differences in nXP supply.
DMI and energy status in the dry period
In late gestation, a typical decline of 20% to 30% in DMI of dairy cows fed high-energy diets for ad libitum intake can be observed (Bertics et al., Reference Bertics, Grummer, Cadorniga-Valino and Stoddard1992; Dann et al., Reference Dann, Morin, Bollero, Murphy and Drackley2005), whereas the decrease is lower for animals with restricted intake. Foetal growth and an accompanying reduction in abdominal space have been suggested as reasons for this pre partum decrease in DMI (Ingvartsen et al., Reference Ingvartsen, Andersen and Foldager1992). In contrast to other species and to Jersey cows, it has been demonstrated that in Holstein dairy cows, ruminal capacity did not limit feed intake as parturition approached (Park et al., Reference Park, Shirley, Titgemeyer, DeFrain, Cochran, Wickersham, Nagaraja and Johnson2011). In the present study with SI, BS and HF cows, a 12% depression in DMI could be observed for the HPRE treatment in the last 3 weeks before calving. Energy balance already began to decrease in week 7.
In the study by Law et al. (Reference Law, Young, Patterson, Kilpatrick, Wylie, Ingvartsen, Hameleers, McCoy, Mayne and Ferris2011), multiparous cows offered ad libitum access to a high energy density diet pre-calving showed significantly higher DMI in the last 21 days before parturition than animals with restricted access to a low energy density diet (10.2 kg v. 6.6 kg DMI). Daily energy balance in these high and low energy treatments were +0.2 MJ ME/day and –40.9 MJ ME/day. Accordingly, the high energy group of the experiment mentioned above corresponds approximately to treatment MPRE, where a DMI of 9.96 kg and a DEB of –2.5 MJ NEL/day was achieved. Cows of the LPRE treatment had a relatively higher energy status compared with those of the low energy treatment in the Law et al. (Reference Law, Young, Patterson, Kilpatrick, Wylie, Ingvartsen, Hameleers, McCoy, Mayne and Ferris2011) study. The greater DMI depression of the HPRE cows of the present study is in agreement with the observations of others (Dann et al., Reference Dann, Litherland, Underwood, Bionaz, D’Angelo, McFadden and Drackley2006; Winkelman et al., Reference Winkelman, Elsasser and Reynolds2008; Janovick and Drackley, Reference Janovick and Drackley2010) and supports the hypothesis of Rabelo et al. (Reference Rabelo, Rezende, Bertics and Grummer2003) that the drop in DMI as parturition approaches is greater the higher the energy intake is above requirements during the dry period. Although the energy levels were higher in that experiment, the difference in energy balance between the high and low energy density treatments of Rabelo et al. (Reference Rabelo, Rezende, Bertics and Grummer2003) was comparable to the difference of the current study (23.4 and 27.6 MJ NEL/day, respectively).
Even though controlling pre partum energy intake by feed restriction to maintain a stable energy balance seems to be an appropriate dry period feeding strategy, in practical settings it is an ambitious task. A physical restriction of the amount of feed provided leaves the problem of ensuring that all animals in common group housing are allowed equal amounts of DM (Winkelman et al., Reference Winkelman, Elsasser and Reynolds2008). Moreover, lower social status of heifers relative to older cows can lead to an unintentional limitation of DMI in mixed groups of multiparous and primiparous cows (Grant and Albright, Reference Grant and Albright1995). Formulating pre partum diets without the inclusion of lower quality forages to increase NDF concentration will usually result in an overconsumption of energy relative to requirements in multiparous as well as in primiparous cows (Janovick and Drackley, Reference Janovick and Drackley2010).
Production parameters and energy status in the lactation period
Milk and milk components yields of the cows of HPRE and MPRE were significantly higher than of cows of LPRE. This is in agreement with findings of McNamara et al. (Reference McNamara, O’Mara, Rath and Murphy2003), who altered grass silage-based diet composition and consequentially plane of nutrition pre partum, but in contrast to other studies, where pre-calving energy supply showed no effects on milk yield in the subsequent lactation (e.g. Holcomb et al., Reference Holcomb, Van Horn, Head, Hall and Wilcox2001). Cows of the LPRE treatment mobilized body reserves during the dry period (loss of 0.23 BCS units, interaction of EPRE×time at the level of P<0.001, data not shown), and post partum must partly have utilized ingested energy to maintain homeostasis instead of milk energy output (Chilliard et al., Reference Chilliard, Bocquier and Doreau1998; Bauman, Reference Bauman2000). Cows overfed in the dry period were able to mobilize more lipid from adipose tissue to support milk production in early lactation, as the difference between BCS pre- and post-calving for this treatment was highest (0.28, 0.45 and 0.61 BCS units for LPRE, MPRE and HPRE, respectively; Tables 3 and 5). Although the interaction was not significant, it is worth noting that the influence of pre-calving energy level on ECM yield was more pronounced when animals received a low energy supply post-calving (ΔHL–LL=5.7 and ΔHH–LH=2.1kg ECM/day, Figure 3).
As in the study by Law et al. (Reference Law, Young, Patterson, Kilpatrick, Wylie, Ingvartsen, Hameleers, McCoy, Mayne and Ferris2011), the effect of post-calving energy supply was much greater than pre-calving treatment in present experiment. The lower concentrate allowance in early lactation was detrimental to milk production in LPOST treatments. The milk yield declined more rapidly for the treatment group HL, compared with ML and LL (Figure 2). Thus, a longer experimental period post partum could have led to a significant effect of a high pre-calving diet on the milk yield trend of animals given a low E post-calving diet, as found by Law et al. (Reference Law, Young, Patterson, Kilpatrick, Wylie, Ingvartsen, Hameleers, McCoy, Mayne and Ferris2011). In contrast, Rabelo et al. (Reference Rabelo, Rezende, Bertics and Grummer2003) found neither effects of a dry period diet and lactation diet (in both periods high energy v. low energy) nor interactions on milk production responses and energy balance. In the current study, there was a main effect of pre partum energy and nutrient supply on energy balance post-calving. Cows of the restrictively fed group before parturition (LPRE), had a higher DEB post partum than cows in the HPRE treatment, MPRE was intermediate. The lower ECM yield could most likely have contributed to this effect, as stated by Janovick and Drackley (Reference Janovick and Drackley2010). In agreement with findings of Law et al. (Reference Law, Young, Patterson, Kilpatrick, Wylie, Ingvartsen, Hameleers, McCoy, Mayne and Ferris2011), the LPRE and MPRE treatments led to higher differences in energy balance between animals in high energy and low energy treatments post partum (pre-calving×post-calving interaction, Figure 3). A mean proportion of 54% concentrates during the lactation period in HPOST treatments resulted in a positive energy balance exceeding energy requirements by an average of only 3%.
Even though the interaction effect of energy level pre partum with breed was not significant, HF cows obviously mobilized body lipid reserves to a greater extent when overfed before calving (28.6, 30.3 and 34.2 kg ECM/day for LPRE×HF, MPRE×HF and HPRE×HF, respectively). SI cows responded in a different manner to the altered prepartal energy supply (21.5, 25.4 and 26.6 kg ECM/day for LPRE×SI, MPRE×SI and HPRE×SI, respectively), indicating that this dual-purpose cattle breed is more tolerant of feeding below requirements in the dry period. The differences for the BS cows were not so pronounced (26.6, 30.0 and 29.4 kg ECM/day for LPRE×BS, MPRE×BS and HPRE×BS, respectively). Thus, the results of the current experiment regarding energy traits (ECM yield, Table 4; DEB, energy balance, Table 5) support previous research, stating that high genetic merit cows are able to produce higher milk energy output than low genetic merit cattle, both within the same breed (Coffey et al., Reference Coffey, Simm, Oldham, Hill and Brotherstone2004) and between breeds (Tyrell et al., Reference Tyrell, Reynolds and Baxter1990; Yan et al., Reference Yan, Mayne, Keady and Agnew2006). However, in contrast to the results of Yan et al. (Reference Yan, Mayne, Keady and Agnew2006), who found only main effects of genotype and plane of nutrition on energy balance in early lactation, in the present experiment also interactions of breed with energy supply existed. Although the post-calving phase of current study was shorter, the results regarding BCS (HF<BS<SI) and liveweight (HF/BS<SI) can be put in the context of those of Coffey et al. (Reference Coffey, Simm, Oldham, Hill and Brotherstone2004). The latter authors state that body energy stores gradually erode with every lactation number for cows selected for production traits, probably leading to health, welfare and economic concerns.
In the current study, total feed intake post partum differed significantly (LPRE<HPRE). A tendency towards higher DMI during the first 20 days in milk in cows fed a high energy diet pre partum as compared with animals fed a low energy diet was also observed by Rabelo et al. (Reference Rabelo, Rezende, Bertics and Grummer2003). In contrast to these results, others found no effects of pre-calving diet on mean DMI post partum (Agenäs et al., Reference Agenäs, Bursted and Holtenius2003; Janovick and Drackley, Reference Janovick and Drackley2010; Law et al., Reference Law, Young, Patterson, Kilpatrick, Wylie, Ingvartsen, Hameleers, McCoy, Mayne and Ferris2011), or even improvements in DMI post-calving (Douglas et al., Reference Douglas, Overton, Bateman, Dann and Drackley2006) for cows with limited energy intake compared with an ad libitum intake in the dry period. Nevertheless, current findings support the theory of Grummer et al. (Reference Grummer, Mashek and Hayirli2004), that absolute intake pre partum is not as predictive for feed intake in early lactation, as changes in DMI before calving. The decreasing feed intake in HPRE during the last 3 weeks before parturition seemed to have negative effects on DMI during lactation (HH<MH/LH).
Conclusions
From the present data it can be concluded that milk yield and composition were influenced by all three main experimental factors (EPRE, EPOST, breed), as hypothesized. Moreover, the interactions between energy supply pre- and post-calving as well as with breed are worthwhile to be studied (Figure 3). Numerically, only for milk protein content the interactions EPRE×EPOST (P=0.01) and EPRE×breed (P<0.01) reached significance. Nevertheless, the data show that impact of energy supply pre-calving is more pronounced when cows had lower energy supply post-calving and vice versa. On the other hand, milk yield response of cows to energy supply above requirements is greater for cows that have been fed on a low energy level pre partum. This shows that milk yield response on energy supply pre- and post-calving depends to a certain degree on their long-term energy balance. Not as expected, response of cows to energy supply above requirements post partum was similar for all breeds, meaning that nutrient partition into milk of SI cows must have been high. On the other hand, impact of energy level pre partum was higher for HF cows, showing that their milk production relies to a greater extent on mobilization of body reserves. This aspect is reflected in the liveweight and BCS data of this investigation as well as their development during gestation and lactation. Further, these relationships are reflected also in feed intake data. DM and NEL intake slightly decreased with increasing energy level pre partum and vice versa.
Finally, this investigation shows that the varying energy supply pre and post partum and its interaction significantly affected the resulting energy balance of the cows during the first third of lactation. Increasing energy supply pre partum led to a more negative energy balance post partum, mainly by increasing milk yield and milk protein concentration, whereas feed intake was slightly reduced. The negative energy balance is indicated in several ‘mobilization parameters’ as liveweight and BCS change. On the other hand, increasing energy supply post partum enhanced milk yield as well as milk protein and lactose content, as expected. Response of milk yield to increasing energy supply followed the principle of diminishing returns, since energy was more and more partitioned to body retention, as increase of liveweight and BCS show. The influence of energy balance on metabolism of the cows in this study will be described in a companion paper (Urdl et al., Reference Urdl, Gruber, Obritzhauser and Schauerforthcoming). Increasing energy supply pre partum enhances milk yield and content post partum, but exacerbates negative energy balance and its consequences.
Acknowledgements
The authors would like to thank all the co-workers of the institute of livestock research for their commitment and cooperation in herd management, data collection and electronic data processing, and Kathleen Knaus for editing assistance. Thanks are also due to the editor and the two anonymous reviewers for their helpful suggestions to improve this paper. This study was financed by the Austrian Federal Ministry of Agriculture, Forestry, Environment and Water Management (Vienna).