I. INTRODUCTION
Transforming automotive power sources into higher efficiency technologies is vital to the stability of our environment, energy supply, and economy. The urgency of this transformation resulted in a major focus on plug-in hybrid electric vehicles (PHEVs). However, if the PHEVs are charged by conventional coal power plants at night and conventional internal combustion (IC) engines while in transit, the “well to wheels” reduction in CO2 is limited to the increase in efficiency gains afforded by the electric drive hybrid technology, rather than an increase in the actual hydrocarbon to electricity energy conversion process.
Moreover, the range and cost of PHEVs are limited by the energy density of the batteries; and no current battery can compare on a kWh/kg or kWh/L basis with a liquid-fueled energy conversion (hydrocarbon to electricity) process. Unfortunately, IC engines are limited by Carnot efficiency, are far from pollution free, and convert chemical energy to mechanical energy rather than electric power needed by an electric drive vehicle thus requiring an additional mechanical to electrical energy conversion step. In contrast, the use of fuel cells (FCs) rather than an IC engine in a PHEV would result in a dramatic improvement in efficiency, reduction in emissions, and is directly amenable to an electric drive system.
For high efficiency energy conversion, there has been a tremendous effort to develop solid oxide fuel cells (SOFC) operating at temperatures below 900 °C for cost and reliability considerations. Simultaneously, there has been an even larger effort to increase the operating temperature of proton exchange membrane fuel cells (PEMFC) above 100 °C for performance and fuel poisoning considerations. Somewhere in between is the optimum operating temperature for a FC depending on fuel choice and degree of external fuel processing (versus relying exclusively on internal reforming). While there has been some success at developing high temperature PEMFCs operating at temperatures around 140 °C, the power densities and fuel flexibility of these systems are limited. Moreover, there is significant concern that the hydrogen infrastructure necessary for PEMFCs will always make this a future technology with limited market penetration. In contrast, SOFCs can operate on both current conventional fuels (e.g., natural gas, gasoline, and diesel) and biofuels (e.g., biogas, ethanol, and biodiesel). As such, SOFCs offer great promise as a clean and efficient process for directly converting chemical energy to electricity while providing significant environmental benefits. SOFCs produce negligible CO, HC, or NOx and, as a result of their high efficiency, produce about one-third less CO2 per kWh than IC engines. Moreover, SOFC operation on biofuels is the most energy efficient means to utilize home grown carbon neutral fuels.
Therefore, SOFCs are the most efficient technology for converting energy from hydrocarbon fuels to electricity on a “well to wheels” basis. On a system basis, SOFCs hold the potential for producing the least CO2/kWh from conventional fuels. If designed to operate on a renewable resources like biofuel, SOFCs would effectively be carbon neutral. Such a vehicle development would be a transformational change in transportation technology. Not only could low temperature, SOFCs transform the automotive sector as a range extender for PHEVs, but this enabling technology would impact numerous other industries from personal power to large-scale power production.
As an auxiliary power unit, this technology could transform the energy efficiency and emissions of the rest of the transportation sector (trucks, boats, trains, and airplanes), which have to operate large engines in their most inefficient mode (idle) to maintain electric power. SOFCs are modular and can be made in sizes ranging from mW to MW. By driving down the temperature, the door opens to a whole host of small personal power applications from battery replacements (mW to W) to battery chargers (∼100 W) for both civilian and military applications. Operating on natural gas, SOFCs could provide more efficient combined heat (including hot water) and power units for residential (∼10 kW) and commercial (∼200 kW) use.Reference Wachsman and Lee1, Reference Wachsman, Marlowe and Lee2
Unfortunately, current SOFC technology must operate in the temperature region of ∼800 °C to avoid unacceptably high ohmic losses with conventional zirconia-based electrolytes. These high temperatures demand specialized and expensive materials for the FC interconnects and insulation and significant time and energy to heat up to the operating temperature. Therefore, development of SOFCs to provide reasonable power output at lower temperatures (≤600 °C) would make SOFCs both more cost competitive with conventional technology and significantly reduce start-up times, which are critical to transportation and portable power applications.Reference Wachsman and Lee1, Reference Steele3
To address the issue mentioned above, alternative oxide electrolytes with higher conductivities have been considered to allow operation at lower temperatures. Materials considered range from gallates and ceria to bismuth oxide-based materials. However, each of these materials has their own specific issues. Moreover, transitioning from a zirconia electrolyte to one of these alternate electrolytes requires development of an entirely new cell material set.
Over the last 20 years, we have focused on using the most conductive, and hence lowest temperature, bismuth oxide-based electrolyte.Reference Wachsman, Jiang, Mason and Stevenson4–Reference Jung, Duncan, Camaratta, Lee, Nino and Wachsman17 To overcome its inherent instability in reducing environments, we developed a bilayer bismuth oxide/ceria electrolyte.Reference Wachsman, Jayaweera, Jiang, Lowe and Pound18 To avoid reactivity of bismuth oxide with more conventional cathode materials, we developed a bismuth ruthenate/bismuth oxide composite cathode.Reference Jaiswal, Hu and Wachsman19, Reference Camaratta and Wachsman20 Finally, these materials were integrated into an anode-supported cell resulting in power densities of ∼2 W/cm2 at 650 °C.Reference Ahn, Camaratta, Pergolesi, Lee, Yoon, Lee, Jung, Traversa and Wachsman21, Reference Ahn, Pergolesi, Camaratta, Yoon, Lee, Lee, Jung, Traversa and Wachsman22 These SOFCs demonstrate sufficient power down to 400 °C, thus attaining the temperature “sweet spot” necessary to transform FC technology. In this paper, we review effort over the last 20 years to develop high performance lower temperature SOFCs.
II. DEVELOPMENT OF HIGH PERFORMANCE ELECTROLYTES FOR LT-SOFCs
A. Higher conductivity electrolytes
For lower SOFC operation temperature, the ohmic polarization resistance should be suppressed due to its thermally activated nature.Reference Steele and Heinzel23 One of the most successful approaches for lowering the resistance of a solid electrolyte is ultrathin electrolyte design (<∼15 μm).Reference deSouza, Visco and DeJonghe24 With this approach, it was shown that yttria-stabilized zirconia (YSZ), a conventional electrolyte for high temperature SOFCs, can have a reasonably low area-specific resistance (ASR) (∼0.15 Ωcm2) at around 700 °C.Reference Steele25 However, below that temperature, it must be ∼1-μm thick to achieve the same ASR, and this introduces processing issues. Alternatively, higher ion conductivity electrolytes have been studied and applied. Among these materials, our research has focused on isovalent cation-doped stabilized bismuth oxide and aliovalent cation-doped ceria.
1. Stabilized bismuth oxide
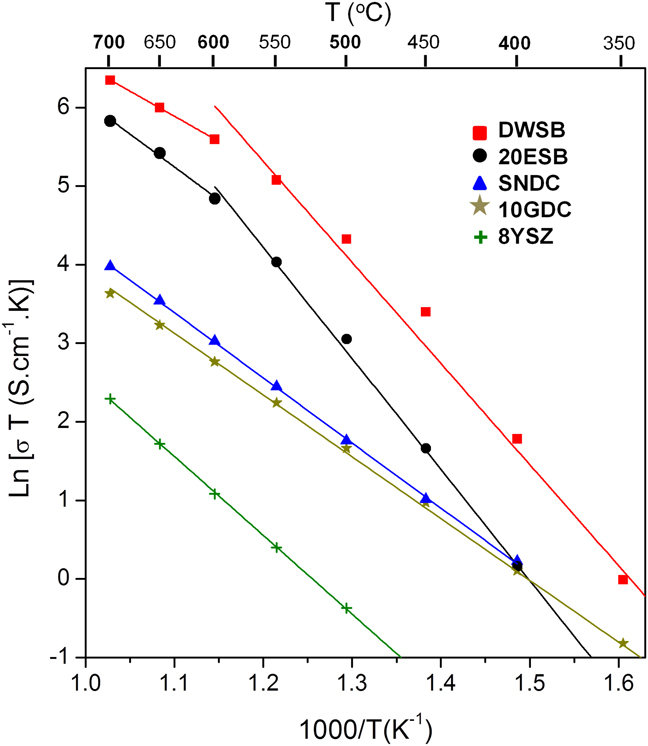
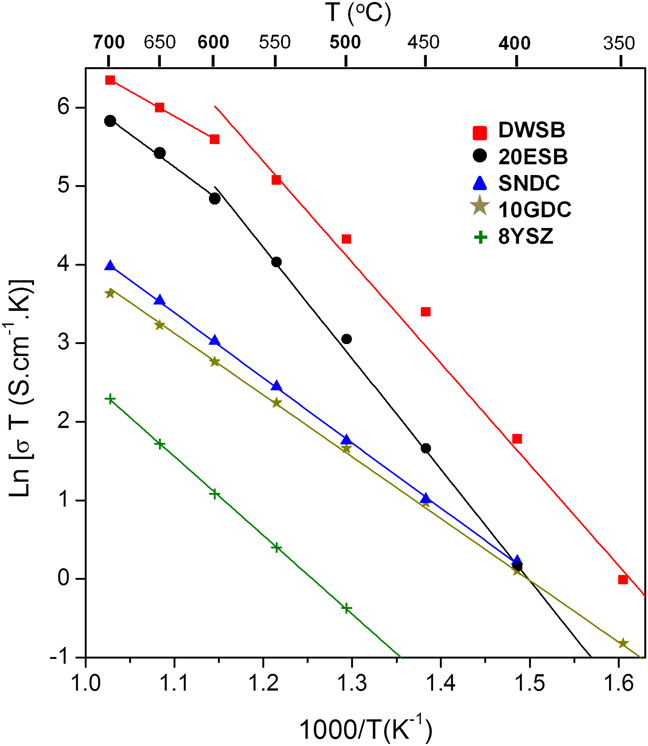
Phase-stabilized bismuth oxide electrolytes have been known to have the highest oxygen conductivity among the studied electrolytes.Reference Takahashi, Esaka and Iwahara26 Various polymorphs in bismuth oxides have been identified, with α, β, γ, and δ phases.Reference Harwig27 Even though the cubic δ phase with fluorite structure at high temperature (>729 °C) shows an excellent ionic conductivity, attributed to the presence of such a large concentration (25%) of oxygen vacancies, it is unstable and transforms into a monoclinic phase below 729 °C resulting in a discontinuous decrease in conductivity.Reference Takahashi, Esaka and Iwahara28 However, when a solid solution of bismuth oxide is formed with various rare earth oxides, it maintains the high temperature defective fluorite structure down to room temperature. This results in high conductivity at much lower temperature, thus making it a promising electrolyte for low temperature (LT) SOFC.Reference Verkerk, Keizer and Burggraaf29 Based on literature, ASRs of YSZ, gadolinia doped ceria (GDC), and erbia-stabilized bismuth oxide (ESB) with thickness of 10 μm are 1.259, 0.145, and 0.037 Ωcm2, respectively, at 500 °C (Fig. 1).Reference Jung, Duncan and Wachsman15 These data indicate that when using stabilized bismuth oxide, the ohmic polarization can be reduced by 1–2 orders of magnitude without compromising electrolyte thickness.
Comparison of conductivity of various solid electrolytes.Reference Wachsman and Lee1 (8YSZ—Y0.16Zr0.92O2.08, 10GDC—Gd0.1Ce0.9O1.95, SNDC—Sm0.075Nd0.075Ce0.85O2−δ, 20ESB—Er0.4Bi1.6O3, DWSB—Dy0.08W0.04Bi0.88O1.56.)
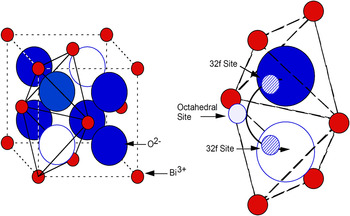
For the last two decades, we have intensively studied the effect of oxygen sublattice structure and ionic transport on conductivity in these highly defective fluorite oxides.Reference Wachsman, Jiang, Mason and Stevenson4–Reference Boyapati, Wachsman and Chakoumakos11, Reference Wachsman14 The structure of fluorite bismuth oxide is a combination of a fcc cation sublattice and oxygen ions in six of the eight tetrahedral sites. Moreover, in contrast to aliovalent cation-doped ceria or zirconia, bismuth oxides stabilized by isovalent cations have no electrostatic difference between host (Bi3+) and dopant, while maintaining a high fraction of oxygen vacancies with 25% of the anion sites. Thus, this high ionic conduction strongly depends on the arrangement of the two oxygen vacancies in the anion sublattice in a unit cell without consideration of Coulombic attraction.Reference Wachsman14 Based on previously proposed structural models for δ-Bi2O3,Reference Sillen30–Reference Willis32 we determined that the fluorite structure of bismuth oxide consists of a disordered oxygen sublattice with a short-range ordering of oxygen vacancies along the <111> directions.Reference Wachsman, Boyapati, Kaufman and Jiang9, Reference Boyapati, Wachsman and Jiang10 In addition, from our neutron diffraction studies, we have experimentally confirmed extensive displacement of oxygen ions from regular 8c sites to interstitial 32f sites.Reference Boyapati, Wachsman and Jiang10, Reference Boyapati, Wachsman and Chakoumakos11 In this structure, the ionic transport mechanism is more complicated than simple hopping between the regular tetrahedral sites along the <100> directions due to the presence of vacant octahedral sites. Thus, there are more energetically favorable paths involving the displacement of oxygen ions toward the central vacant position along the <111> directions (Fig. 2) resulting in a local structural dependence on ionic conductivity.Reference Boyapati, Wachsman and Jiang10
Ionic transport mechanism in δ-Bi2O3 from one tetrahedron to an adjacent empty tetrahedron in <100> direction.Reference Boyapati, Wachsman and Jiang10

For most of the bismuth oxides stabilized with lanthanide dopants (Dy, Ho, Er, Tm, and Yb), the conductivity activation energy (E A) increases below 600 °C due to an order–disorder transition of the oxygen sublattice.Reference Jiang and Wachsman8 Moreover, at this temperature (<600 °C), the stabilized bismuth oxides experience time-dependent conductivity degradation. Our results revealed that this conductivity decay of lanthanide-doped Bi2O3 is not due to phase transformation, which is a main reason for conductivity degradation of some doped Bi2O3 at higher temperature (>600 °C), but due to anion ordering within the cubic fluorite structure–stability window. Transmission electron microscopy (TEM) observations showed a superstructure with the alignment of vacant 8c anion sites in <111> direction, indicating occupational ordering.Reference Wachsman, Boyapati, Kaufman and Jiang9 In addition, analysis of neutron diffraction patterns indicated positional ordering, which can be explained by displacement of the occupied anion sites in a <111> direction from 8c to 32f sites. In a modeling study based on these TEM and neutron diffraction studies, we concluded that this aging phenomenon is the result of combination of occupational ordering and positional ordering.Reference Wachsman, Boyapati, Kaufman and Jiang9, Reference Boyapati, Wachsman and Jiang10, Reference Wachsman14
Further studies of the effect of dopant radii and concentration have shown that the ionic radii and polarizability of dopant cations influence the kinetics of vacancy ordering in the oxygen sublattice, thus affecting stability of conductivity below the order–disorder transition temperature.Reference Wachsman, Boyapati and Jiang12 These results showed that most lanthanide dopants used to stabilize the fluorite Bi2O3 are less polarizable than host cation (Bi3+) and the stability of the disordered oxygen sublattice was improved as dopant radii and polarizability increased. Thus, the highest stability for the disordered anion sublattice was obtained with Dy, which has both large ionic radii and high polarizability.Reference Jiang and Wachsman8, Reference Wachsman, Boyapati and Jiang12 Moreover, simulation results revealed that polarizability is more important than radii for determining oxygen diffusion in Bi2O3, leading to a disordered lattice.Reference Aidhy, Nino, Sinnott, Wachsman and Phillpot33, Reference Aidhy, Sinnott, Wachsman, Phillpot and Nino34 Other studies pointed out W as a highly attractive dopant to stabilize the cubic Bi2O3 structure due to its high polarizability.Reference Hoda and Chang35, Reference Watanabe and Ono36 Accordingly, we developed a stabilized bismuth oxide with double dopants, Dy and W (DWSB).Reference Jiang, Wachsman and Jung13 Using the double dopant strategy, bismuth oxide was stabilized with less total dopant concentration, only ∼12 mol%. Finally, we achieved a conductivity of 0.57 and 0.098 S/cm at 700 and 500 °C, respectively, with a composition of (DyO1.5)0.08(WO3)0.04(BiO1.5)0.88 (8D4WSB).Reference Jung, Duncan and Wachsman15–Reference Jung, Duncan, Camaratta, Lee, Nino and Wachsman17 Comparing at 500 °C, the conductivity of DWSB is ∼4×, 10×, and 100× higher than those of ESB, GDC, and YSZ, respectively (Fig. 1). Thus, this novel electrolyte (DWSB) creates great opportunity for high power density LT-SOFCs.
Despite the high conductivity of stabilized bismuth oxide electrolytes, they have not been used in solid electrochemical devices such as SOFCs due to their thermodynamic instability. Takahashi et al.Reference Takahashi, Esaka and Iwahara37 indicated that the critical Po2 value below which stabilized bismuth oxide would decompose is the equilibrium oxygen pressure of a Bi/Bi2O3 mixture. The decomposition process may be simplified as:

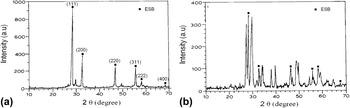
The open circuit potential (OCP) from galvanic cells with an air cathode and metal/metal oxide anode was stable in oxygen partial pressures above 10−13.1 atm at 600 °C. This result showed that there was no contribution of electronic conduction to the total conductivity above the equilibrium oxygen potential of Bi/Bi2O3 mixture. Therefore, they concluded that the minimum oxygen partial pressure at 600 °C is 10−13.1 atm. On the other hand, Wang and other researchersReference Wang, Xu and Li38, Reference Duran, Jurado, Moure, Valverde and Steele39 reported that the ionic conductivity of Bi2O3 could be measured without critical decomposition of Bi/Bi2O3 under an H2/H2O atmosphere. Later, we reported that the measured conductivity of ESB was independent of Po2 over the range 1–10−22 atm under O2/Ar atmosphere, while, as shown in Fig. 3, ESB decomposed at low Po2 (10−21 atm) with H2 as confirmed by x-ray diffraction (XRD).Reference Wachsman, Ball, Jiang and Stevenson6 Thus, the stability of ESB in the Ar/O2 atmosphere is probably due to slow heterogeneous kinetics in the absence of an active reducing agent, such as H2. Therefore, to use bismuth oxide as a SOFC electrolyte, exposure to the reducing environment of the fuel gases must be prevented to limit decomposition.
X-ray diffraction of 20 mol% ESB: (a) as received; (b) annealed 4 h at 700 °C in H2/H2O PO2 = 10−21 atm.Reference Wachsman, Ball, Jiang and Stevenson6

2. Aliovalent cation-doped ceria
Aliovalent cation-doped ceria (CeO2) has received attention as a potential solid electrolyte because it exhibits higher ionic conductivity than YSZ over a range of high to intermediate temperatures. The ionic conductivity of ceria is considerably increased by aliovalent cation doping, which increases the oxygen vacancy concentration.Reference Yahiro, Eguchi, Eguchi and Arai40, Reference Eguchi, Setoguchi, Inoue and Arai41 The magnitude of electrical conductivity and the stability under reducing conditions for ceria-based oxides depend greatly on the kind and quantity of doping elements. Alkaline earth oxides (e.g., CaO and SrO) and rare earth oxides (e.g., Gd2O3 and Sm2O3) are highly soluble in the ceria sublattice. Among these, Sm3+- and Gd3+-doped ceria, which are close in ionic radii to Ce4+, show the highest electrical conductivity in ceria-based oxides with 10–20% dopant concentration.Reference Eguchi, Setoguchi, Inoue and Arai41 Moreover, SteeleReference Steele42 claimed that the ionic conductivity of Gd0.1Ce0.9O1.95 (10GDC) is the highest among various Gd and Sm dopant concentrations at a temperature range of 500–700 °C. Thus, 10GDC has gained attention as one of the most suitable candidates for SOFCs electrolytes at lower temperature ranges. At temperature below 800 °C, the ionic conductivity of doped ceria is approximately one to two orders of magnitude greater than that of stabilized zirconia, which is currently the most widely used electrolyte material. This is due in part because the Ce4+ (0.87 Å) ion has a larger ionic radius than Zr4+ (0.72 Å) resulting in easier oxygen ion migration through a more open structure.
In recent studies, we demonstrated even higher ionic conductivity for doped ceria at lower temperature using a codoping strategy.Reference Omar, Wachsman and Nino43–Reference Omar, Wachsman and Nino45 Previous computational studies using density functional theory by Andersson et al.Reference Andersson, Simak, Skorodumova, Abrikosov and Johansson46 predicted that, when Pm (atomic number 61) is selected as the dopant in ceria, the total interaction energy between oxygen vacancy and dopant cations is minimized rather than using other dopants such as Gd or Sm, thus maximizing oxygen ion conductivity. However, Pm is a radioactive element and an unrealistic selection for a SOFC electrolyte component. Therefore, to produce the effective atomic number of Pm3+ with ionic radius of 1.093 Å,Reference Shannon47 a codoping strategy was used based on our previous work of doubly doped bismuth oxides (DWSBs).Reference Jiang, Wachsman and Jung13 In this work, we chose a double dopant system with Sm3+ and Nd3+, expecting average dopant ionic radius of 1.094 Å in 1:1 mixing ratio. Through a systematic study for composition and temperature dependence on grain ionic conductivity of these materials, the optimum composition obtained was at Sm0.075Nd0.075Ce0.85O2−δ (SNDC).Reference Omar, Wachsman and Nino45 This codoped ceria electrolyte enhanced the grain ionic conductivity by 30% compared to that of 10GDC at 550 °C. Using this novel electrolyte, we recently demonstrated high power densities at lower temperature (500–650 °C) indicating SNDC as a promising electrolyte for LT-SOFC.Reference Ahn, Omar, Yoon, Nino and Wachsman48
However, ceria-based electrolytes also have a stability issue. When ceria-based oxides are reduced at low oxygen partial pressures (<10−14 atm), Ce4+ transfers into Ce3+ leading to significant n-type electronic conduction with a P(O2)−1/4 dependence.Reference Steele42 This mixed ionic and electronic conduction (MIEC) property of doped ceria electrolytes reduces the ionic transference number (t i) and the OCP, thereby making ceria less efficient for application as a SOFC electrolyte.
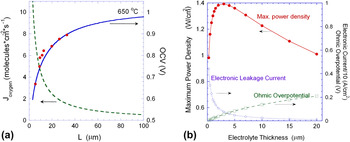
In fact, it is easy to find inconsistency in OCPs reported by different research groups using doped ceria electrolytes.Reference Steele3, Reference Duncan and Wachsman49–Reference Lee, Vito, Mattehw, Yoon and Wachsman51 This is caused not only by electrolyte quality but also by electronic leakage current through MIEC electrolytes.Reference Steele3, Reference Haile50, Reference Brett, Atkinson, Brandon and Skinner52, Reference Zhang, Robertson, Deces-Petit, Qu, Kesler, Maric and Ghosh53 To explain the behavior of MIEC electrolytes in actual SOFC operation conditions, we developed a continuum-level electrochemical model of mixed conducting materials.Reference Duncan and Wachsman49 The modeling results predicted the OCP dependence of SOFCs as a function of MIEC electrolyte thickness. Recent experimental results confirmed the model predictions that OCP decreases proportionally with electrolyte thickness due to increased leakage current, i.e., higher oxygen permeation flux [Fig. 4(a)].Reference Duncan, Lee and Wachsman54 Therefore, as shown in Fig. 4(b), the maximum power density (MPD) of a SOFC with MIEC electrolyte is produced at a certain optimal thickness as a result of the trade-off between decreasing OCP and reduced ohmic resistance with decreasing thickness. In contrast, for a pure ionic conductor such as a stabilized zirconia, thinner electrolytes produce higher performance due to lower ohmic polarization. This result indicates that different design strategies are required for SOFCs with MIEC electrolytes. On the other hand, increasing the electrolytic domain and preserving the ionic conductivity of the doped ceria by any means is important.
(a) Open circuit voltage (OCV) and oxygen permeation flux as a function of electrolyte thickness at 650 °C. (b) Projected MPD, electronic (leakage) current, and ohmic overpotential as a function of electrolyte thickness predicted from model at 600 °C for Ni–SDC/SDC/BSCF.Reference Duncan, Lee and Wachsman54

B. Ceria/bismuth oxide bilayered electrolyte
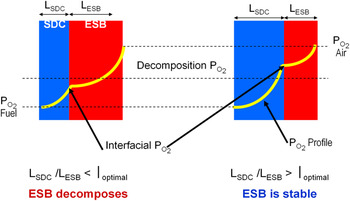
To overcome the inherent thermodynamic stability limitations of these two highly conductive oxides (stabilized bismuth oxide and doped ceria), we proposed a functionally graded bilayer electrolyte consisting of a layer of stabilized bismuth oxide on the oxidizing side and a layer of doped ceria on the reducing side.Reference Wachsman, Jayaweera, Jiang, Lowe and Pound18 In this arrangement, as shown in Fig. 5, the interfacial Po2 between the two electrolytes can be controlled by the thickness ratio of the constituent layers. Therefore, a sufficiently thick ceria layer would protect the bismuth oxide layer from decomposing, by shielding it from very low Po2, and the bismuth oxide layer would serve to block electronic flux inherent in MIEC ceria electrolytes. As a result, higher OCP can be obtained in the bilayered ceria/bismuth oxide electrolytes since a bismuth oxide electrolyte has been reported to have essentially pure ionic conduction down to Po2 = 10−20 atm.
Schematic diagram of ceria/bismuth oxide bilayered electrolyte concept.Reference Wachsman, Jayaweera, Jiang, Lowe and Pound18

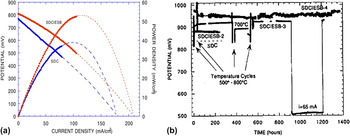
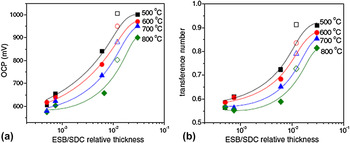
In early cell tests, a SOFC with an ESB/Sm-doped ceria (SDC) bilayered electrolyte using Pt and Au electrodes produced 35% greater power density than one with a SDC single electrolyte layer [Fig. 6(a)]. Moreover, the OCP of bismuth oxide/ceria bilayered electrolytes was stable up to 1400 h under open circuit and MPD condition [Fig. 6(b)]. The OCP and t i of ESB/SDC bilayered electrolytes in an electrolyte-supported SOFC configuration were further investigated as a function of thickness ratio and operation temperature with H2/H2O on the anode side and air on the cathode side.Reference Park and Wachsman55 As shown in Fig. 7, the OCP and t i of the bilayered electrolyte improved with increasing relative ESB/SDC thickness, due to greater electronic blocking effect, and decreasing temperature due to the extended ionic domain of the ceria electrolyte. The measured OCP at 500 °C was 1006 mV approaching near the theoretical value. However, in this early study, we tested only low relative thickness ratio (<∼0.03) and used Au electrodes with poor electrocatalytic reactivity. Thus, a greater relative ESB thickness and better cathode should result in even greater OCP and t i.
(a) Comparison of cell performance of SDC/ESB electrolytes; ∼1 mm electrolyte, Pt–H2/H2O anode, Au–O2 cathode, 800 °C. (b) Stability of bilayered SDC/ESB electrolytes, as demonstrated by open circuit and maximum power potentials as a function of time. All data taken at 650 °C except where indicated. Breaks in the curve indicated I–V data acquisition.Reference Wachsman, Jayaweera, Jiang, Lowe and Pound18

Effect of ESB/SDC relative thickness and cathode on (a) OCP and (b) t i (transference number) relation of bilayer electrolyte SOFC with air on the cathode side and H2/H2O on the anode side (open symbol Ag–ESB cathode and closed symbol Au cathode).Reference Park and Wachsman55

In addition to the effect of the bilayered electrolyte on OCP, the electrolyte ASR can be effectively reduced using this functionally graded electrolyte.Reference Wachsman56 For example, the total ohmic ASR of the ESB/GDC bilayered electrolyte can be estimated by a simple two series resistor model:

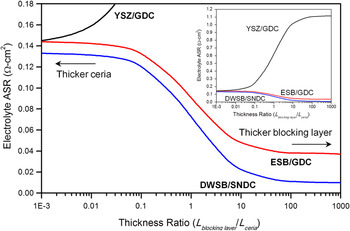
where L GDC is thickness of GDC electrolyte, τ is thickness ratio of ESB to GDC, and σESB and σGDC are the conductivities of ESB and GDC, respectively.Reference Ahn, Camaratta, Pergolesi, Lee, Yoon, Lee, Jung, Traversa and Wachsman21Figure 8 shows the calculated ASR for three ceria-based bilayered electrolytes at 500 °C with total thickness of 10 μm as a function of relative thickness. The ohmic ASR decreases dramatically with increasing relative thickness of the higher conductivity bismuth oxide layer. Moreover, actual measurements showed the effective conductance of ESB/SDC (20-μm/1.27-cm thick) was slightly higher than that of a 1.27-cm-thick SDC electrolyte. This result is due to the formation of a solid solution of bismuth/bismuth oxide in the ceria grain boundaries, forming paths with lower activation energy for oxygen ion transfer due to a scavenging effect on impurity phases.Reference Lee, Jung, Camaratta, Ahn and Wachsman57
Bulk electrolyte ASR at 500 °C as a function of relative (τ = L blocking layer/L ceria) for YSZ/GDC, ESB/GDC, and DWSB/SNDC bilayers. Total electrolyte thickness is fixed at 10 μm.

Figure 8 also shows that significantly lower electrolyte ASR’s are achievable with a bilayer of our recently discovered DWSB and SNDC electrolytes. Further discussion of this can be found in our previous publication.Reference Wachsman and Lee1 Moreover, it demonstrates the problem with using YSZ blocking layers as proposed by othersReference Liu, Khor, Chan and Chen58, Reference Lim and Virkar59 in that even ∼1-μm YSZ layer essentially doubles the ASR relative to GDC alone.
While these early results demonstrate bilayered electrolytes improve the power density and OCP, the initial MPD measured was only ∼53 mW/cm2 at 800 °C due to use of low electrocatalytic activity cathodes (Au) and high ohmic resistance from the thick (∼800 μm) electrolyte (Fig. 6).Reference Wachsman, Jayaweera, Jiang, Lowe and Pound18
III. DEVELOPMENT OF HIGH PERFORMANCE CATHODES FOR LT-SOFCs
A. Investigation into fundamental cathode mechanisms
Cathodic polarization is a major roadblock to achieving SOFC operation at lower temperatures. It is well known that the greatest portion of activation polarization originates from sluggish kinetics of the oxygen reduction reaction (ORR) at the cathode mainly due to the high bond strength of the oxygen molecule,Reference Xia, Rauch, Chen and Liu60−Reference Mogensen and Skaarup63 while the hydrogen oxidation process in the anode is several orders of magnitude faster than ORR at the cathode. For example, the dissociated chemisorption of hydrogen at the anode is much faster and independent of changing temperature,Reference Mogensen and Skaarup63, Reference Godickemeier, Sasaki, Gauckler and Riess64 while the cathode ORR is a thermally activated process. Therefore, as operational temperature decreases, increasing non-ohmic polarization in SOFCs is attributable primarily to cathodic polarization. Recent development of high performance cathodes for LT-SOFC has focused on increasing triple phase boundary (TPB) density by microstructural tailoring and/or using highly electrocatalytic materials. Two popular choices for cathode materials are La1−xSrxMnO3−δ (LSM) and La1−xSrxCo1−yFeyO3−δ (LSCF) with the perovskite (ABO3) crystal structures.
LSM-based materials are almost purely p-type electronic conductors with high thermal and chemical stability as well as reasonable catalytic activity for oxygen reduction at high temperature.Reference Minh65–Reference Jiang68 However, due to their negligible bulk ionic conduction and high activation energy, the electrochemical reaction sites (TPBs) are restricted to the electrolyte/cathode interface. Moreover, their sluggish ORRs significantly impact cell performance at lower temperatures.Reference Brandon, Skinner and Steele69 To deal with this issue, composite cathodes have been explored by adding an ionic conductor such as stabilized zirconia and doped ceria. These composites show higher performance at lower temperatures due to improved ionic conduction and enlarged TPB density in three dimensions (3D).Reference Tanner, Fung and Virkar70, Reference Murray and Barnett71
In contrast, LSCF is a MIEC resulting in an intrinsically extended TPB region. This plus LSCF’s significantly faster ORR kinetics result in much higher performance than that of LSM-based cathodes at lower temperatures.Reference Jiang72–Reference Kan, Kan, Van Assche, Armstrong and Wachsman74
In addition to material properties, cathode performance strongly depends on microstructure.Reference Adler75 Recently, significant effort has been undertaken to achieve high TPB density with a spatially well-percolated distribution of ionic and electronic phases in the cathode bulk and more importantly near cathode/electrolyte interfacial region. One of the successful approaches is infiltration of catalyst precursor solutions forming nanosized particles of electronic (or ionic) conductors on an ionic (or electronic) conducting skeleton structure resulting in significantly increased TPB lengths.Reference Vohs and Gorte76 Various nanostructured cathode materials have also been explored using synthesis techniques such as wet chemical combustion methods effectively leading to reduced cathodic polarization. In a recent report by Baque et al.,Reference Baque, Caneiro, Moreno and Serquis77 e.g., a nanostructured LSCF cathode prepared by a wet chemical route exhibited ASRs of 0.05 and 0.4 Ωcm2 at 600 and 450 °C, respectively.
While tailored cathode microstructures have improved cathode performance at lower temperatures, the relation between cathode structure and the oxygen reaction mechanisms in them has not been clearly explained yet. This is due to the complexity of the ORR mechanism and the high randomness of the cathode cermet structure. To deal with this issue, quantification of cathode microstructures has progressed from measuring impedance of well-defined microelectrodes to stereological techniques using analysis of two-dimensional (2D) micrographs.Reference Wilson and Barnett78–Reference Bieberle, Meier and Gauckler80 Despite some progress in these efforts, the accuracy of measuring practical cathode properties has been limited by overly simplified/unrealistic electrode design, or difficulties to quantify phase interconnectivity which are important to evaluate core microstructural factors linked to electrochemical performance in the cathode such as active TPB density and pore tortuosity.
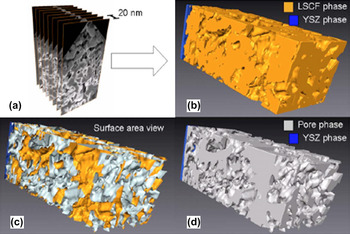
Recently, new analytical techniques have been used to scrutinize the SOFC cathode structure. Using a focused ion beam (FIB)/scanning electron microscope (SEM) dual beam system, an accurate and realistic cathode structure was successfully reconstructed in 3D and the critical structural properties quantified.Reference Wilson, Kobsiriphat, Mendoza, Chen, Hiller, Miller, Thornton, Voorhees, Adler and Barnett81–Reference Shikazono, Kanno, Matsuzaki, Teshima, Sumino and Kasagi87 For the last several years, we have investigated two popular perovskite cathodes: LSM and LSCF (and their composites) cathodes by this state-of-the-art technique. As shown in Fig. 9, we first reported a FIB/SEM 3D reconstruction of a porous LSFC cathode by automated sectioning, alignment, and segmentation of a series of 2D images.Reference Gostovic, Smith, Kundinger, Jones and Wachsman82 From this reconstruction, we successfully quantified the critical microstructural parameters including closed/graded porosity, surface area, tortuosity, and TPB length.
(a) SEM 2D images were stacked, aligned, and reconstructed into (b) a 3D triangular mesh representing actual LSCF/YSZ interfacial microstructure sintered at 950 °C. This allows for measurement of (c) surface area and (d) volume porosity.Reference Bieberle, Meier and Gauckler80

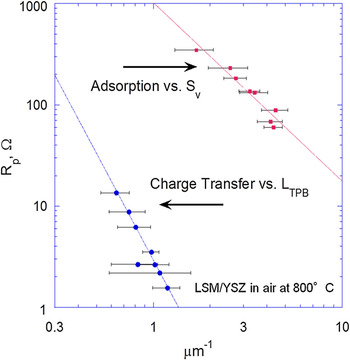
More recently, we demonstrated for the first time a direct relation between quantified microstructural features of “real” LSM porous cathodes and activation polarization mechanisms,Reference Smith, Chen, Gostovic, Hickey, Kundinger, Duncan, DeHoff, Jones and Wachsman83 using the 3D reconstruction technique combined with AC impedance spectroscopy. As shown in Fig. 10, charge transfer resistance and the adsorption polarization have a power law relationship with TPB density (L TPB) and surface area (S v), respectively, quantified using FIB/SEM 3D reconstruction. This quantification and deconvolution of the diverse polarization contributions to the cathodic polarization is an important step to the rational design of higher performance cathodes.
Effect of LSM microstructure on cathode polarization; dissociative adsorption as a function of pore surface area, and charge transfer polarization as a function of triple phase boundary length; at 800 °C in air.Reference Wilson, Kobsiriphat, Mendoza, Chen, Hiller, Miller, Thornton, Voorhees, Adler and Barnett81

Rational design further requires mechanistic understanding of oxygen reduction kinetics on SOFC cathode materials and the role it plays in apparent rate-limiting steps. To achieve this, we utilized heterogeneous catalysis techniques of temperature-programmed desorption, reaction, and isotope exchange, the later using oxygen isotope tracers (O218) (Fig. 11).Reference Jiang72, Reference Kan and Wachsman88, Reference Kan and Wachsman89 These studies revealed that the rate-limiting step for LSM is primarily the incorporation of adsorbed oxygen species into the lattice, while for LSCF, it is the dissociative adsorption of oxygen molecules. Moreover, these experiments demonstrated faster ORR kinetics for LSCF with both lower oxygen exchange onset temperature (200 versus 350 °C) and activation energy (0.10 eV versus 0.9 eV at 700 °C) than LSM. The fundamental reaction rate constants from these independent cathode material studies can be combined with the quantified microstructures and electrochemical measurements to provide a more foundational logically based framework for cathode development to further reduce cathode polarization and thus SOFC operation temperature.
Temperature-programmed isotope exchange for (a) LSM and (b) LSCF.Reference Jiang72

B. Development of novel cathode materials
For further improvement of cathode performance at lower temperatures, new cathode materials are continually being explored by many researchers. For example, Shao and HaileReference Shao and Haile90 reported a high performance cubic perovskite cathode—Ba0.5Sr0.5Co0.8Fe0.2O3−δ (BSCF) with low ASRs of ∼0.06 and ∼0.55 Ωcm2 at 600 and 500 °C, respectively. Thus, these perovskite cathodes (LSCF, BSCF) have been popular choices for LT-SOFCs. However, cobaltite-based materials are reactive with stabilized bismuth oxide, which is an essential component for our bismuth oxide/ceria bilayered electrolyte.
Therefore, we investigated a bismuth oxide compatible high performance low temperature cathode material—a pyrochlore structured bismuth ruthenate (Bi2Ru2O7, BRO7).Reference Jaiswal and Wachsman91, Reference Jaiswal and Wachsman92 Ruthenium oxide is known for its highly catalytic activity. Moreover, Lee et al.Reference Lee, Seo and Whangbo93 have reported that using an A-site dopant with sufficiently large ionic radius, such as Bi or Pb, ruthenium pyrochlores (A2Ru2O7) become metallic due to the altered energy band structure by increasing the Ru–O–Ru bond angle. Thus, when using these materials with Bi as the A-site dopant, high electronic conduction is expected at low temperatures. Our initial results demonstrated that BRO7 is compatible with both doped ceria and stabilized bismuth oxide and showed reasonably high performance at lower temperatures.Reference Jaiswal and Wachsman91 Based on this result, we developed a composite cathode consisting of BRO7 as an electronic conducting phase and ESB as ionic conducting phase working on an ESB electrolyte.Reference Jaiswal, Hu and Wachsman19 Previous results with Ag–ESB composite cathodes demonstrated the role of cathode microstructure on electrode polarization and long-term stability of Bi2O3 based cathodes.Reference Camaratta and Wachsman94, Reference Camaratta and Wachsman95 Thus, to reduce the electrode polarization of the BRO7–ESB cathode, the effects of two phase composition, microstructural optimization of particle size and distribution for each phase, and the electrode thickness were investigated (Fig. 12),Reference Camaratta and Wachsman20 resulting in electrode ASRs of BRO7–ESB composite cathodes on ESB electrolytes of only 0.03 and 0.73 Ωcm2 at 700 and 500 °C, respectively. This result is comparable to the performance of the state-of-the-art BSCF cathode, particularly at lower temperatures due to low activation energy of BRO7–ESB cathodes.
Mircrostructural optimization and performance of bismuth ruthenate–bismuth oxide (BRO7–ESB) composite cathode.Reference Camaratta and Wachsman20

IV. DEVELOPMENT OF HIGH PERFORMANCE ANODES FOR LT-SOFCs
A. Anode-supported design and anode functional layers for LT-SOFCs
To minimize ohmic resistance and promote higher power density at lower temperatures, the electrolyte thickness should be reduced. One of the most successful approaches has been to use an anode-supported cell architecture, which can accommodate very thin electrolytes (∼10 μm).Reference Will, Mitterdorfer, Kleinlogel, Perednis and Gauckler96, Reference Kim, Virkar, Fung, Mehta and Singhal97
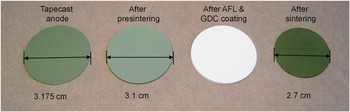
These are typically tape cast anode supports, which in our case are comprised of a mixture of large-sized (over several micrometers) NiO particles and submicron-sized GDC powders.Reference Lee, Vito, Mattehw, Yoon and Wachsman51, Reference Ahn, Yoon, Lee, Camaratta and Wachsman98 Under operating conditions, reduction of large NiO into Ni metal produces porosity. The measured value is around ∼30% porosity. Figure 13 shows the tape cast anode-supported cells, which we typically fabricate, from the green tape to the sintered body with a thin GDC electrolyte layer. The shrinkage rate of the diameter during sintering is about 15% (from 3.18 to 2.70 cm).
Fabrication of an anode-supported SOFC from a tape cast anode to a sintered button cell. After sintering, the lateral shrinkage rate is about 15%.

For high performance, anode supports should equip two main functionalities. First is a large pore microstructure to accommodate rapid gas transport, both fuel in and reaction by-products, such as water, out. Second is a high surface area triple phase boundary region to maximize anodic reactions. In many cases, a mixture of submicron-sized anode powder and pore former are used for the anode support.Reference Ai, Lu, Chen, Huang, Du and Su99, Reference Haslam, Pham, Chung, DiCarlo and Glass100 Therefore, there is a trade-off between the desired porosity and TPB density in anode structures. Moreover, high porosity anodes can cause insufficient mechanical stability and poor interfacial contact between the anode and electrolyte.Reference Ai, Lu, Chen, Huang, Du and Su99 Thus, to increase the number of anode reaction sites and reduce abrupt microstructural change at the anode/electrolyte interface, various anode functional layers (AFLs) with finer microstructure have been developed.Reference Haslam, Pham, Chung, DiCarlo and Glass100–Reference Wanzenberg, Tietz, Panjan and Stover104
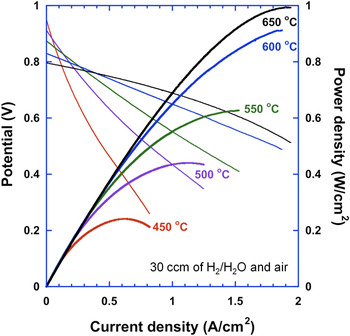
We use an AFL at the electrolyte/anode interface by dispersing very fine GDC particles using a precursor solution.Reference Ahn, Yoon, Lee, Camaratta and Wachsman98 After heat treatment, the nanosized GDC particles fill pores at the anode/electrolyte interface, improving the quality of electrolyte deposition resulting in higher OCP and lower ohmic ASR. In addition, fine particles penetrate into the anode bulk increasing TPB and a significant anodic polarization decrease. A SOFC with GDC–AFL was tested at temperature ranging from 650 °C down to 450 °C. The resultant total ASR was only 0.089 Ωcm2 at 650 °C, and the MPDs reached ∼1 W/cm2 at 650 °C and ∼0.24 W/cm2 at 450 °C (Fig. 14). However, impedance analysis revealed that the electrode ASR was still dominant at lower temperature, ∼73% of total cell resistance at 450 °C.
I–V characteristics of anode-supported GDC SOFC with AFL and LSCF/GDC cathode from 450 to 650 °C under 30 sccm of wet hydrogen and air.Reference Will, Mitterdorfer, Kleinlogel, Perednis and Gauckler96

For further improvement, we developed an AFL structure integrating different size particles with cost-effective fabrication processes, yielding power densities of ∼1.13 and 1.29 W/cm2 at 600 and 650 °C, respectively.Reference Lee, Yoon, Ahn and Wachsman105 Moreover, the effect of AFL composition on microstructure and electrochemical performance was investigated and we found the optimal composition range of Ni–GDC AFL as a ∼1:1 volume ratio.Reference Lee, Vito, Mattehw, Yoon and Wachsman51
B. Investigation of anodes for hydrocarbon fuels
In principle, the relatively high operating temperature (>∼600 °C) of SOFCs compared to other types of FCs enables internal reforming and the ability to operate on a variety of hydrocarbon fuels. However, as operating temperature decreases, the most widely used Ni–YSZ cermet anodes, under hydrocarbon fuel conditions, have shown carbon deposition and sulfur (a common impurity in most hydrocarbon fuels) poisoning on the surface of the Ni catalyst, leading to significant power output decay.Reference Sun and Stimming106
Various approaches have been developed for effective suppression of coking (carbon deposition) and sulfur poisoning. For example, Murray et al.Reference Murray, Tsai and Barnett107 reported the direct electrochemical oxidation of methane in SOFCs using a thin (Y2O3)0.15(CeO2)0.85 layer (∼0.5 μm) between the YSZ electrolyte and Ni–YSZ anode. With the aid of additional ceria catalysts, coking was suppressed at the Ni–YSZ anode, with a MPD of 0.37 W/cm2 at 650 °C. Similarly, Zhan and BarnettReference Zhan and Barnett108 utilized a thin Ru–CeO2 catalyst layer on top of the Ni–YSZ anode. Using this configuration, they demonstrated internal reforming of isooctane with greater coking resistance, generating stable power densities up to 0.6 W/cm2 at 770 °C. Recently, Yang et al.Reference Yang, Wang, Blinn, Liu, Liu, Cheng and Liu109 developed an enhanced coking and sulfur resistant anode comprised of BaZr0.1Ce0.7Y0.2−xYbxO3−δ (BZCYYb) as a replacement for the ionic conducting phase in Ni–YSZ cermet. They reported that the Ni–BZCYYb cermet anode had excellent hydrocarbon reforming and sulfur oxidation ability up to 50 ppm of H2S due to the mixed transport of both protons and oxide vacancies enhancing catalytic activity and water adsorption at low temperature, 500–700 °C. Using a SOFC with Ni–BZCYYb/BZCYYb/BZCYYb–LSCF, the MPD obtained reached ∼1.1 W/cm2 at 750 °C.
Another approach is to replace the Ni, which is susceptible to coking and sulfur poisoning with alternative electronic conducting phases. Park et al.,Reference Park, Vohs and Gorte110 e.g., developed composite anodes of Cu–CeO2 (or doped ceria)–YSZ. Due to the low melting temperature of copper (<∼1100 °C), the composite anode was fabricated by infiltrating a porous YSZ scaffold with precursor solutions containing the constituent ions.Reference Gorte and Vohs111 During SOFC operation, these composite anodes allowed the direct utilization of a variety of hydrocarbon fuels, ranging from methane to toluene, and exhibited very high coking resistance and sulfur tolerance (up to ∼400 ppm) without serious performance degradation. In this anode design, copper works mainly as an electronic conductor and ceria (or doped ceria) plays a catalytic role for fuel reforming and oxidation. Similarly, all ceramic anodes have been investigated, such as perovskites La0.75Sr0.25Cr0.5Mn0.5O3,Reference Pena-Martinez, Marrero-Lopez, Ruiz-Morales, Savaniu, Nunez and Irvine112 La0.4Sr0.6Ti1−xMnxO3,Reference Fu, Tietz and Stover113 and double perovskite Sr2Mg1−xMnxMoO6−δ.Reference Huang, Dass, Xing and Goodenough114 Despite progress on coking resistance and sulfur tolerance with hydrocarbon fuels, further improvement is necessary as these alternative anodes have relatively low performance compared to Ni-based cermet anodes due to lower conductivity and catalytic activity.
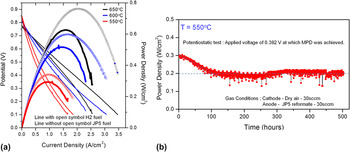
One thing appears clear in these studies that ceria-based anodes have greater coking resistance and sulfur tolerance than zirconia-based anodes. This is due to both greater ionic conductivity and more facile Ce3+/4+ redox behavior. Recently, we operated our micron-sized Ni–GDC anode-supported SOFC with submicron-sized Ni–GDC AFL cells on JP5 diesel reformate (1.1% CH4, 12.3% CO, 12.3% CO2, 40.5% H2, and 24.5% H2O balanced with N2) at 550–650 °C resulting in less than 30% decrease in power densities compared to pure hydrogen (3% humidified) fuel [Fig. 15(a)]. Moreover, during long-term stability tests with JP5 reformate at 550 °C, after an initial decay in first 100 h, there was no measurable degradation up to 500 h [Fig. 15(b)].Reference Lee, Gore and Wachsman115 This is important because ∼600 °C is considered as a lower temperature limit for internal reforming without coking for Ni anodes and demonstrates the beneficial effect of replacing YSZ with GDC in the active AFL region. However, further work is necessary with pure methane or higher hydrocarbons due to greater carbon deposition tendency by Boudouard reaction (disproportionation of carbon monoxide)Reference Murray, Tsai and Barnett107 and higher susceptibility to sulfur poisoning at lower temperatures. Moreover, for SOFC operation below 500 °C, it will be necessary to develop and integrate an external fuel processor to partially reform/oxidize the fuel prior to entering the anode.
(a) Current–voltage behavior of SOFCs with H2 and JP5 reformate fuel from 500 to 650 °C. (b) Long-term stability test of the SOFC on JP5 reformate at 550 °C for 500 h.113

V. HIGH PERFORMANCE LT-SOFC—INTEGRATING COMPONENTS
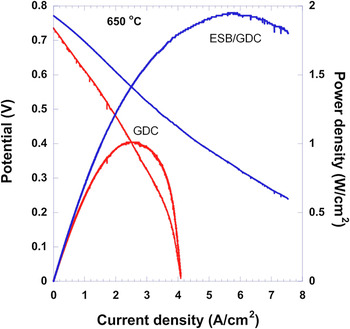
By integrating several of the innovations described above, we designed an anode-supported cell with an AFL, a thin ESB/GDC bilayered electrolyte, and a BRO7–ESB cathode.Reference Ahn, Camaratta, Pergolesi, Lee, Yoon, Lee, Jung, Traversa and Wachsman21 The different sintering temperatures between stabilized bismuth oxide (∼900 °C) and doped ceria (∼1500 °C) make it nontrivial to deposit a dense ESB layer on the GDC surface using conventional powder copressing or colloidal deposition processes. To solve this issue, we used pulsed laser deposition and successfully established a thin (∼4 μm) and dense ESB on 10-μm-thick anode-supported GDC electrolyte (Fig. 16). As explained above, utilization of the thin ESB/GDC bilayer not only increased OCP but also resulted in low ohmic ASR (∼0.046 Ωcm2) at 650 °C. In addition, coupling the enhanced surface oxygen exchange rate of stabilized bismuth oxide, with the highly electrocatalytic and conductive, BRO7–ESB cathode reduced electrode ASR by 48% compared to that of our similarly prepared cells with LSCF–GDC cathode on GDC electrolyte and a total cell ASR (0.079 Ωcm2) reduction of ∼40%. This dramatic electrode ASR reduction is attributed not only to the high performance bismuth ruthenate cathode but also to the enhanced oxygen incorporation rate of ESB at the cathode/electrolyte interface.Reference Lee, Jung, Yoon, Camaratta, Sexson and Wachsman116 Finally, as shown in Fig. 17, we obtained a power density of ∼2 W/cm2 at 650 °C, which is 93% increase in MPD compared to that of a GDC single-layer cell (∼1.03 W/cm2)Reference Ahn, Camaratta, Pergolesi, Lee, Yoon, Lee, Jung, Traversa and Wachsman21, Reference Ahn, Pergolesi, Camaratta, Yoon, Lee, Lee, Jung, Traversa and Wachsman22 and the highest power density achieved in this temperature range (<700 °C). Based on a ∼1.5-mm interconnect thickness per planar cell, this corresponds to a stack volumetric power density of ∼10 W/cm3. Further, by including the corresponding densities, we calculate a gravimetric power density for the stack of ∼3 kW/kg, greater than that of an IC engine.Reference Wachsman and Lee1
(a) SEM image of the cross section of the ESB/GDC bilayer electrolyte on Ni–GDC anode support. Pulsed laser deposition of ESB on GDC resulted in a 4-μm-thick film. (b) XRD pattern of the as-deposited bilayer sample.Reference Ahn, Pergolesi, Camaratta, Yoon, Lee, Lee, Jung, Traversa and Wachsman22

I–V characteristics of the FC samples with GDC single-layer and ESB/GDC bilayered electrolyte at 650 °C using 90 sccm of air and wet hydrogen.Reference Ahn, Pergolesi, Camaratta, Yoon, Lee, Lee, Jung, Traversa and Wachsman22

VI. CONCLUDING REMARKS
Based on the fundamental understanding of ionic transport of solid electrolytes and heterogeneous electrocatalysis, we have developed various compatible high performance SOFC components: functionally graded ceria/bismuth oxide bilayered electrolytes, bismuth ruthenate-based cathodes, and AFLs. These materials were integrated into an anode-supported cell achieving a power density of ∼2 W/cm2 at 650 °C. We expect to achieve even higher power density at lower temperatures by further reducing electrolyte polarization and by transitioning from the ESB/GDC bilayered electrolyte to the more conductive DWSB/SNDC electrolytes we recently developed. Moreover, with these exceptionally high power densities, we can readily accommodate a decrease in power associated with operating the SOFCs at temperatures of 300–500 °C, opening up the opportunity to use nanostructured electrodes, conventional stainless steel interconnects, and balance of plant (BOP), as well as simple elastomeric seals, reducing system cost and increasing reliability.Reference Wachsman and Lee1 In addition, the ability to operate on conventional fuels at lower temperatures precludes the requirements for a hydrogen infrastructure that have relegated FCs to a “future technology.” Thus, LT-SOFCs are a practical transformational energy conversion technology with the ability for “current market” penetration.