Introduction
In recent decades there has been a dramatic shift in the major causes of death from infectious diseases to non-communicable diseases (NCDs) as a result of processes such as modernization (Steyn & Damasceno, Reference Steyn and Damasceno2006; WHO, 2009). For example, in Ghana hypertension has been identified as one of the most common lifestyle diseases among young people aged 15–34 (Ghana Ministry of Health, 2007). The growing prevalence of lifestyle diseases has been attributed to inadequate fruit and vegetable consumption and the increase in consumption of processed foods (WHO, 2002, 2003, 2011, 2013; Ghana Ministry of Health, 2007).
The consumption of nutritious diets that include fruit and vegetables is affected by socio-demographic factors such as age, education, ethnicity, geographical location, region of residence and religion (Azagba & Sharaf, Reference Azagba and Sharaf2011; Yen et al., Reference Yen, Tan and Nayga2011; Li et al., Reference Li, Li, Ma, Liu, Hui-Ding, Wen and Peng2012; Abe et al., Reference Abe, Stickley, Roberts, Richardson, Abbott, Rotman and McKee2013; Amo-Adjei & Kumi-Kyereme, Reference Amo-Adjei and Kumi-Kyereme2014). Recent studies of dietary behaviour in Ghana have found that geographical location, education, ethnicity and gender are associated with fruit and vegetable consumption (Tagoe & Dake, Reference Tagoe and Dake2011; Doku et al., Reference Doku, Koivusilta, Raisamo and Rimpelä2013; Amo-Adjei & Kumi-Kyereme, Reference Amo-Adjei and Kumi-Kyereme2014).
Despite the importance of socio-demographic factors in the nutritious diet–lifestyle disease nexus, very few studies have examined their effects in Ghana. Doku et al. (Reference Doku, Koivusilta, Raisamo and Rimpelä2013) conducted a study on fruit and vegetable consumption in Ghana, but this was limited to adolescents in schools from three southern regions of the country. Moreover, while Amo-Adjei and Kumi-Kyereme’s (Reference Amo-Adjei and Kumi-Kyereme2014) study used a nationally representative sample to examine fruit and vegetable consumption in Ghana, their focus was on the entire adult population of the country.
The present study examines the relationship between socio-demographic factors and fruit and vegetable consumption among young Ghanaians aged 15–34 years using 2008 Ghana Demographic and Health Survey data. It departs from existing studies in two fundamental ways. Firstly, it focuses on the young people of the country, that is, persons aged 15–34 years (Ghana Ministry of Youth and Sports, 2010). Secondly, it underscores the importance of socio-demographic factors through the prism of the Health Belief Model (HBM).
Conceptual Framework: The Health Belief Model
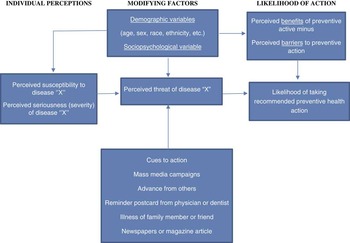
Since its formulation in the 1950s by Hochbaum (Baum, Reference Baum1997), the Health Belief Model has been used to explain various health behaviours (Rosenstock, Reference Rosenstock1974; Janz & Becker, Reference Janz and Becker1984; Becker & Janz; Reference Becker and Janz1985; Asare et al., Reference Asare, Sharma, Bernard, Rojas-Guyler and Wang2013). The model has three essential components, namely: (1) individual perceptions, (2) modifiers, including the socio-demographic characteristics of an individual, and (3) the likelihood of action (Fig. 1). The essence of the model is that human action is guided by beliefs about the impact of illness and its consequences (threat perception). Threat perception in turn depends on perceived susceptibility (the beliefs about how vulnerable a person considers him or herself to a certain illness or health problem). This component of the model suggests that individuals differ widely in their feelings of personal vulnerability to a condition. Beliefs and health motivation are conditioned by socio-demographic variables such as education, age, gender, religion, ethnicity, region of residence, geographical location, and by the psychological characteristics of the individual such as personality and peer group pressure (Sheeran & Abraham, Reference Sheeran and Abraham1995).
Basic elements of the Health Belief Model. Source: Janz & Becker (Reference Janz and Becker1984).

Several studies over the years have examined how beliefs and health motivation have been conditioned by socio-demographic factors. However, the existing literature is not consistent on the direction of influence of each of the factors. For example, as far as gender is concerned, many studies have found that females consume more fruit and vegetables than males (Azagba & Sharaf, Reference Azagba and Sharaf2011; Dehghan et al., Reference Dehghan, Akhtar-Danesh and Merchant2011; Yen et al., Reference Yen, Tan and Nayga2011; Amo-Adjei & Kumi-Kyereme, Reference Amo-Adjei and Kumi-Kyereme2014). However, Rieth et al. (Reference Rieth, Moreira, Fuchs, Moreira and Fuchs2012), in their study among Brazilian adolescents (12–19 years), observed no association between gender and fruit and vegetable consumption. In Ghana, like most agrarian societies in the region, women and children constitute the bulk of the agricultural labour force, so it is hypothesized that females will consume more fruit and vegetables than males.
While some studies have found a decline in fruit and vegetable consumption with age (Azagba & Sharaf, Reference Azagba and Sharaf2011; Li et al., Reference Li, Li, Ma, Liu, Hui-Ding, Wen and Peng2012), others have found a positive association (Dehghan et al., Reference Dehghan, Akhtar-Danesh and Merchant2011; Yen et al., Reference Yen, Tan and Nayga2011; Abe et al. Reference Abe, Stickley, Roberts, Richardson, Abbott, Rotman and McKee2013; Amo-Adjei & Kumi-Kyereme, Reference Amo-Adjei and Kumi-Kyereme2014). Because of young people’s relative advantage in having access to information through the internet and other modern sources, it is hypothesized that younger respondents will consume more fruit and vegetables. Many studies have revealed that a higher level of education leads to an increased consumption of fruit and vegetables (Azagba & Sharaf, Reference Azagba and Sharaf2011; Dehghan et al., Reference Dehghan, Akhtar-Danesh and Merchant2011; Hong et al., Reference Hong, Kim and Kim2012; Li et al., Reference Li, Li, Ma, Liu, Hui-Ding, Wen and Peng2012; Yen et al., Reference Yen, Tan and Nayga2011). However, other studies have found an inverse relationship (Abe et al., Reference Abe, Stickley, Roberts, Richardson, Abbott, Rotman and McKee2013), while still others have found no relationship at all (Rieth et al., Reference Rieth, Moreira, Fuchs, Moreira and Fuchs2012). Education not only empowers people through the acquisition of skills but, more importantly, arms them with information. Because educated people are much more likely to know about the health benefits of fruit and vegetables, in this study it is hypothesized that educated youths will consume more.
Religion has been found to be associated with fruit and vegetable consumption among respondents in contexts as diverse as the UK, Ghana, Mumbai, South Africa and India (McAloney et al., Reference McAloney, Graham, Hall, Law, Platt and Wardle2012; Amo-Adjei & Kumi-Kyereme, Reference Amo-Adjei and Kumi-Kyereme2014). However, while Amo-Adjei and Kumi-Kyereme (Reference Amo-Adjei and Kumi-Kyereme2014) found a lower intake of fruit and vegetables among traditionalist/spiritualist respondents in Ghana, other studies found no relationship (Sharma et al., Reference Sharma, Grover and Chaturvedi2011; Chopra et al., Reference Chopra, Chheda, Kehoe, Taskar, Brown, Shivashankaran and Fall2012; Peltzer & Phaswana-Mafuya, Reference Peltzer and Phaswana-Mafuya2012). Different religions have different teachings, doctrines, prescriptions and prohibitions that guide the behaviours of adherents. For instance, Muslims and Mormons proscribe alcoholic beverages while the latter proscribe beverages that contain caffeine. In this study, it is hypothesized that Muslim youths will consume more fruit and vegetables than Protestant youths. Studies carried out in various countries have shown that the consumption of fruit and vegetables is associated with ethnicity (Yen et al., Reference Yen, Tan and Nayga2011; McAloney et al., Reference McAloney, Graham, Hall, Law, Platt and Wardle2012). For instance, in the United States, Iannotti and Wang (Reference Iannotti and Wang2013) showed that Whites consumed more fruit and vegetables than other groups. However, Reynolds et al. (Reference Reynolds, Baranowski, Bishop, Farris, Binkley, Nicklas and Elmer1999) observed that African-Americans consumed more fruit and vegetables than European-Americans.
In Ghana, Amo-Adjei and Kumi-Kyereme (Reference Amo-Adjei and Kumi-Kyereme2014) found vegetable intake to be significantly higher among respondents of the Mole-Dagbani ethnic group than those of the majority Akan ethnic group. To the extent that ethnicity largely reflects the cultural traditions, beliefs and values of a people, including the food they eat, it is expected that there will be variations in the amount of fruit and vegetables consumed by members of different ethnic groups. The Akan ethnic group straddles the forest belt of the country where the bulk of fruit and vegetables are produced. Because of this geography, it is hypothesized that youth who belong to the Akan ethnic group will consume more fruit and vegetable than those who belong to ethnic groups that are located in the coastal and savannah areas of the country.
Geographical location or place of residence has been found to be associated with fruit and vegetable consumption in several studies (Satheannoppakao et al., Reference Satheannoppakao, Aekplakorn and Pradipasen2009; Katsarou et al., Reference Katsarou, Tyrovolas, Psaltopoulou, Zeimbekis, Tsakountakis, Bountziouka and Panagiotakos2010; Hoffmann et al., Reference Hoffman, Stout, Williams, Wells, Fragala and Magine2012; Abe et al., Reference Abe, Stickley, Roberts, Richardson, Abbott, Rotman and McKee2013; Grosso et al., Reference Grosso, Marventano, Buscemi, Scuderi, Matalone, Platania and Mistretta2013). Living in rural areas has been found to be associated with low fruit and vegetable consumption (Satheannoppakao et al., Reference Satheannoppakao, Aekplakorn and Pradipasen2009; El Rhazi et al., Reference El Rhazi, Nejjari, Romaguera, Feart, Obtel, Zidouh and Gateau2012; Abe et al., Reference Abe, Stickley, Roberts, Richardson, Abbott, Rotman and McKee2013). On the other hand, other studies (Katsarou et al., Reference Katsarou, Tyrovolas, Psaltopoulou, Zeimbekis, Tsakountakis, Bountziouka and Panagiotakos2010; Grosso et al., Reference Grosso, Marventano, Buscemi, Scuderi, Matalone, Platania and Mistretta2013) found that urban residents eat less fruit and vegetables than their rural counterparts. Yet, other studies found no difference in fruit and vegetable intake among urban or rural residents in Poland (Hoffmann et al., Reference Hoffman, Stout, Williams, Wells, Fragala and Magine2012), South Africa (Peltzer & Phaswana-Mafuya, Reference Peltzer and Phaswana-Mafuya2012) and Italy (Grosso et al., Reference Grosso, Marventano, Giorgianni, Raciti, Galvano and Mistretta2014). In Ghana, like most countries in sub-Saharan Africa, agriculture is largely subsistent and involves rural residents, a situation that provides easy access to fruit and vegetables, so it is hypothesized that rural residents will consume more fruit and vegetables than urban residents.
Region of residence has been found to influence the consumption of fruit and vegetables in many contexts, including Canada (Azagba & Sharaf, Reference Azagba and Sharaf2011), Thailand (Satheannoppakao et al., Reference Satheannoppakao, Aekplakorn and Pradipasen2009), Mexico (Jiménez-Aguilar et al., Reference Jiménez-Aguilar, Gaona-Pineda, Mejía-Rodríguez, Gómez-Acosta, Méndez-Gómez Humarán and Flores-Aldana2014), Malaysia (Yen et al., Reference Yen, Tan and Feisul2015) and Ghana (Amo-Adjei & Kumi-Kyereme, Reference Amo-Adjei and Kumi-Kyereme2014). However, in Brazil Jaime et al. (Reference Jaime, Figueiredo, de Moura and Malta2009) found no association between region of residence and fruit and vegetable consumption. In Ghana, like most developing countries, agriculture is seasonal and the production of fruit and vegetables takes place mainly in the forest belt in the middle of the country. Hence it is hypothesized that the youth residing in regions located in the forest belt (Ashanti, Brong/Ahafo and Eastern regions) will consume more fruit and vegetables than those resident in the coastal and northern regions.
Methods
Data were from the 2008 Ghana Demographic and Health Survey (DHS). The survey was based on a sample of 12,323 selected households nationwide and employed a two-stage sampling design. The first stage involved the selection of sample points or clusters from an updated master sampling frame constructed from the 2000 Ghana Population and Housing Census. A total of 412 clusters were selected using systematic sampling with probability proportional to size (PPS). The second stage involved the systematic sampling of 30 households from each cluster. Three questionnaires were used for data collection, namely: (1) a household questionnaire, (2) a women’s questionnaire, and (3) a men’s questionnaire. The men’s questionnaire was administered to those aged 15–59, and the women’s questionnaire to those aged 15–49.
Statistical analysis
Male and female data were analysed separately, and analysis was restricted to those aged 15–34. The Ghana Ministry of Youth and Sports (2010) defines ‘youth’ as persons aged between 15 and 35 years. The sample included 6139 respondents, of whom 3359 (55%) were female and 2780 (45%) were male. The data for females and males comprised independent samples. Making use of the weights associated with the responses, the analysis was done using SAS v9 (SAS Institute, 1976). Domain analysis was used to examine sub-groups, and the survey methods SURVEYMEANS and SURVEYREG were used. Since the primary concern was with the age group 15–34, subjects were classified as ‘youth’ (i.e. 15–34) or ‘not youth’ (35+ years old) and domain analysis was used with age group as a domain variable (ages 15–34→variable Youth=1; ages 35+→variable Youth=0). Using domain analysis allows valid inference to be done for each domain level, specifically for the youth classification.
The dependent variable was ‘fruit and vegetable consumption’, measured as the number of servings of fruit and vegetables consumed per week. Fruit consumption was measured using two sets of questions: ‘In a typical week, on how many days do you eat fruit?’ and ‘On a day when you eat fruit, how many servings do you eat on average?’ Vegetable consumption was also measured with two sets of questions: ‘In a typical week, on how many days do you eat vegetables?’ and ‘On a day when you eat vegetables, how many servings do you eat on average?’
‘Total servings’ was defined as the sum of ‘total fruit’ and ‘total vegetable’ servings per week. Total servings of fruit was found as the product of N1=number of days/week eating fruit and N2=number of servings of fruit/day. Likewise, total servings of vegetables was found as the product of N1=number of days/week eating vegetables and N2=number of servings of vegetables/day. Adjustment to the responses was made in the case of inconsistent responses (e.g. where N1>0 but N2=0 or where N1=0 but N2>0). Where the value of N2=8 (not sure of the number of servings), the median response for those who answered was used. This value was 1 for N1≤3 and 2 for N1≥4.
In line with the WHO guidelines, a person should have five servings of fruit and/or vegetables every day: that is, seven times in a week. This corresponds to 7×5=35 servings per week (Amo-Adjei & Kumi-Kyereme, Reference Amo-Adjei and Kumi-Kyereme2014). The variable MET_WHO is an indicator variable for meeting the WHO standard of the total servings of fruit and/or vegetables being 35 or more. The general pattern for the analysis was to obtain estimates for males and females separately and then to test for gender differences. Since the data for males and females were collected independently, the tests were based on calculating a Z-statistic that (due to the large sample sizes) could be assumed to be approximately standard normal. Specifically, the following was calculated:
 $$Z\,{\equals}\,({\rm Est}_{{\rm Male}}} \, {\minus}{\, \rm Est}_{{\rm Female}}} )\,/\,\sqrt {{\rm SE}_{{{\rm Male}}}^{2} {\plus}{\rm SE}_{{{\rm Female}}}^{2} } $$
where Est is the estimated parameter and SE is the associated standard error.
For the multivariate analysis, the approach was to assess the socio-demographic predictors of dietary behaviour (weekly servings of fruit and vegetables) two predictor variables at a time. This was because of the mathematical issues involved in considering three or more predictor variables and the difficulty in interpreting results with higher levels of interactions. It is significant to note, for example, that in Ghana, region and ethnicity are closely related so to simplify matters only one of these two variables (region) was used. For most factors (e.g. region, religion, education) there were a large number of levels and therefore the interpretation of the factor effects became rather complicated when interactions existed. Since there were a large number of pairwise comparisons, it became important to adjust for multiple testing. Because of this the False Discovery Rate (FDR) was controlled and looked only at differences where the adjusted p-value was <0.05 (the FDR method of adjustment is similar to a Bonferroni adjustment but not as conservative; Benjamini & Hochberg, Reference Benjamini and Hochberg1995).
Results
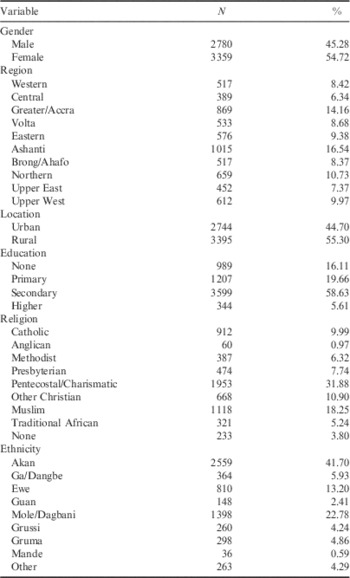
Table 1 shows the distribution of the respondent sample characteristics. Females constitute 55% of the sample and males 45%. The highest proportion come from the Upper East region. Fifty-five per cent reside in rural areas and 45% in urban areas. Almost six out of ten have attained secondary education, while one-fifth have primary education; only 6% have higher education. Nearly one-third professes the Pentecostal/Charismatic faith (32%), followed by Muslims (18.25%), while those of Anglican faith constitute only 0.97% of the sample. The majority are from the Akan ethnic group (42%), followed by Mole/Dagbani (23%), while only 6% belong to the Ga/Dangme ethnic group. The mean age of females is 23.43 years (SD=5.6), while that of males is 23.21 years (SD=5.6).
Distribution of sample by socio-demographic characteristics, 2008 Ghana DHS

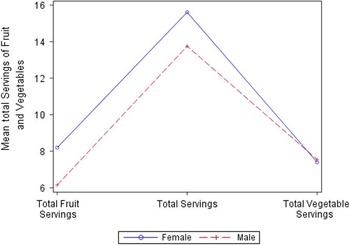
Figure 2 shows the estimated mean values for the total number of weekly servings of fruit and vegetables, and fruit and vegetables combined, for males and females. There is virtually no gender difference in mean total vegetable consumption (p=0.43). However, the mean for females is significantly higher than that for males for total fruit consumption and for overall total consumption of fruit and vegetables (p<0.0001 for both). The estimated mean number of fruit servings per week is 8.2 for females and 6.2 for males. While not shown in the graph, the proportions meeting the WHO standard of at least 35 servings per week of fruit and vegetables are 6.8% for females and 3.5% for males.
Mean values for weekly servings by gender.

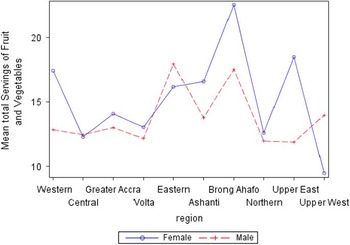
Figures 3–7 show the univariate analysis results for region, ethnicity, religion, education and location or residence (using Tukey’s method to adjust p-values for multiple comparisons, with adjusted p-values <0.05 considered significant). To make it easier to find pairs that differ significantly, only significant differences are reported. The outcome variable for all of these factors is ‘total servings’. Figure 3 shows the results by region. For females (solid line), the Brong/Ahafo region has the highest mean total servings (22.5), which is significantly higher than that for all other regions. The Upper West region has the lowest mean total servings (9.5), which is significantly lower than that for all other regions. For males (broken line), the Eastern region has the highest mean (17.9), which is significantly larger than that for all other regions except Brong/Ahafo (mean=17.5). The Upper East has the lowest mean total servings (11.8). Similarly, there are significant gender differences in the Western and Ashanti regions (for gender differences, the unadjusted p-value had to be <0.01).
Mean total servings by region and gender.

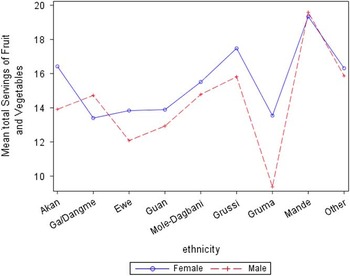
Mean total servings by ethnicity and gender.

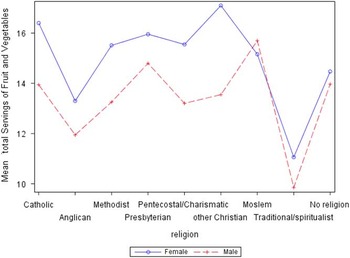
Mean total servings by religion and gender.

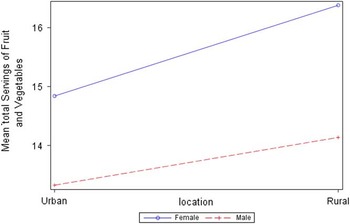
Mean total servings by location and gender.

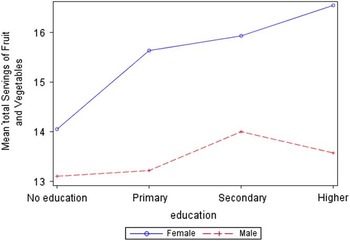
Mean total servings by education and gender.

Figure 4 shows mean total servings of fruit and vegetables by ethnicity. There are significant gender differences in fruit and vegetable consumption by ethnicity. For females, the Mande has the highest mean total servings (19.3), followed by the Grussi (17.4) and the Akan (16.4). The group with the lowest mean total servings is the Ga/Dangme (13.4). For males, again the Mande has the highest mean total servings (19.5), while the Gruma has the lowest (9.3).
Figure 5 shows the results for religion, which shows significant gender differences. For females, the ‘Other Christian’ group has the highest mean total servings (17.0), followed by Catholics (16.4), while the group with the lowest mean total servings is those with no religious affiliation (14.4). For males, Muslims have the highest mean total servings (15.7), followed by Presbyterians (14.8); the religious group with the lowest mean total servings is those who profess Traditionalist/Spiritualist faith (9.8).
Figure 6 shows the results for location or residence. Overall, females have higher mean total servings than males in both rural and urban areas (16.3 vs 14.1), although the difference between females and males in urban areas is statistically insignificant (14.8 vs 13.3 respectively).
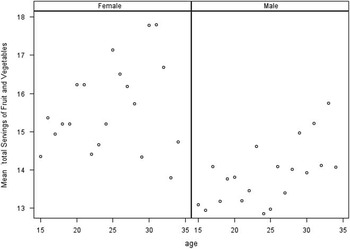
Figure 7 shows the results for education. The mean total servings for females is higher than for males at every level of education, although the difference between females and males is statistically significant only at the level of higher educational attainment (16.5 vs 13.1). Otherwise, within gender, education does not make any difference with regard to the consumption of fruit and vegetables. Figure 8 shows the results for the estimated mean total servings for each year of age plotted against age for each gender. Females generally have higher mean servings than males. There is a great deal of scatter (variability) for both genders, and a slight tendency for an increase in the mean total servings with age. The results of the analysis show that for males there is a weak and marginally significant relationship with total servings (p=0.0247). Further, the amount of variability explained as measured by R 2 is very small (0.0021). For females, the relationship is even weaker and not significant (p=0.092; R 2=0.0010).
Mean total servings by age and gender.

Results of the multivariate analysis
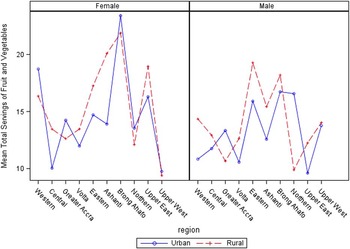
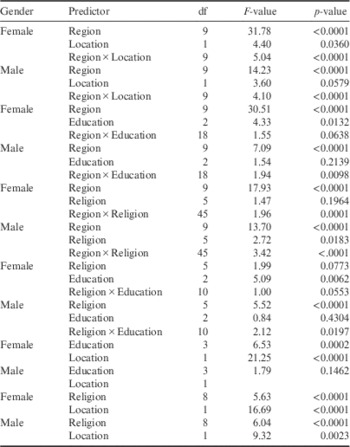
Table 2 shows the results of the analysis for the pairwise comparisons of the effects of the socio-demographic predictors of fruit and vegetable consumption. Region and location have main effects, and significant interaction effects, for both genders. The interaction term is highly significant for both males and females (p<0.0001). This is further illustrated in Fig. 9, which shows that the Ashanti, Central, Eastern and Upper East regions have large differences for females. For example, in the Ashanti region, females who reside in rural areas have higher mean total servings than their urban counterparts (20.1 vs 13.9). The Eastern region has a similar pattern of consumption of fruit and vegetables, as females in rural areas have a mean total servings of 13.4 as against 10.0 for their counterparts in urban areas. Among males the Ashanti, Eastern, Greater/Accra and Western regions have significant differences. For example, in the Ashanti region, rural males have a mean total servings of 15.4 as against 12.5 for urban males. With the exception of the Greater/Accra region, rural males are more likely than males in urban areas to consume more fruit and vegetables. It is also significant to note that the rural–urban difference in fruit and vegetable consumption for females is higher in the Ashanti region than in any other region. Further, Fig. 9 shows gender differences for each of the 10×2=20 region–location combinations. The Upper West region is the only region where males in rural areas have higher mean total servings than their female counterparts (14.0 vs 9.3; the last entry in the two panels).
Mean total servings by urban–rural location and region.

Results of analysis for pairwise comparisons of the effects of the socio-demographic predictors of fruit and vegetable consumption
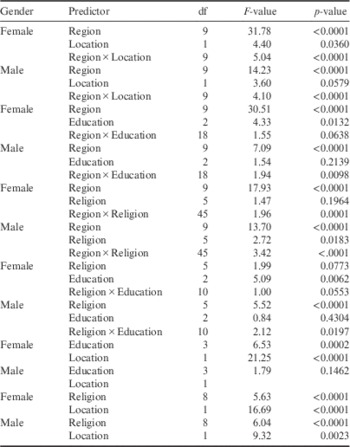
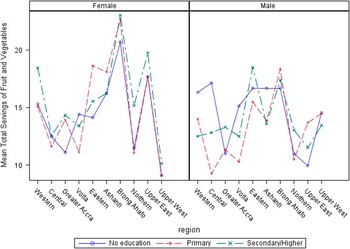
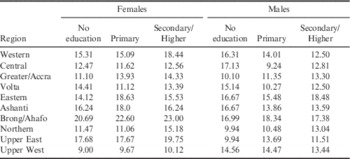
Table 2 and Fig. 10 also show the results for the region and education pairwise comparison. Education has a main effect for females but not for males. However, there are marginally significant interaction terms for education and region for both females and males. Even though there are no significant differences in education level within regions for either males or females (the main effect of education is not significant for males; p=0.1462), there are significant differences between the regions for education for both genders (Table 3). Further, Table 3 shows that for females, the Ashanti region differs from both the Northern and Upper West regions for those with no education. Specifically, females without education in the Ashanti region have a mean total servings of 16.24 compared with only 11.47 and 9.00 for the Northern and Upper West regions, respectively. For youth with primary education, the Ashanti region also differs from the Central, Northern, Upper West and Volta regions by 6.47, 7.0, 8.10 and 7.0 mean total servings, respectively. Finally, for females with secondary or higher education, the Ashanti region differs from the Central, Greater/Accra, Upper West, Upper East and Volta regions. Brong/Ahafo is the only region where females with higher educational attainment have higher mean total servings than those in the Ashanti region, while there are gender differences at all three education levels in the Upper East and Upper West regions.
Mean total servings by education and region.

Results for analysis of pairwise comparison of region and education, 15- to 34-year-olds, 2008 Ghana DHS, N=6139
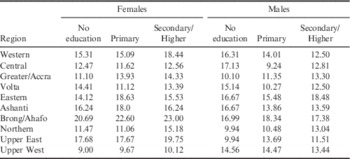
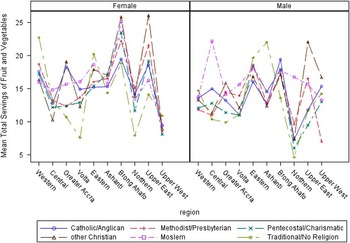
Figure 11 shows the region–religion pairwise comparison. Due to small numbers in some gender–region–religion categories, some religion groups with similar orientations were combined for the analysis, namely, ‘Traditional/Spiritualist’ and ‘No Religion’ and ‘Methodist/Presbyterian’ and ‘Catholic/Anglican’. The global analysis of variance model depicted in Table 2 shows that there are significant interaction terms for both males and females. For females, the differences are observed mostly in the Upper East and Volta regions, while for males they are observed in the Ashanti, Northern, Upper East and Upper West regions. For instance, among females, the mean total servings for Catholic/Anglican, Methodist/Presbyterian and Pentecostal/Charismatic groups in the Upper West region are 18.6, 21.5, 19.1 compared with 14.9, 13.6, and 12.9, respectively, for the Volta region.
Mean total servings by religion and region

For female Muslims the mean total servings differences are observed in fifteen pairs of regions but are most pronounced in the Brong/Ahafo and Upper West regions (25.1 vs 9.4 respectively). However, among male Muslims there are region differences among only two pairs of regions. For example, Muslim males in the Central region have a mean total servings of 22.1 compared with only 13.2 and 13.7 for the Upper West and Western regions, respectively. Moreover, Muslim males in the Brong/Ahafo region have a mean total servings of 17.7 compared with 13.2 and 13.7 for the Upper West and Western regions respectively. There were two pairs of factors with no significant interaction term, namely education and location as well as religion and location. For these factors, the analysis was run using the main-effects models using all levels of the factors adjusting for multiple testing (see last eight lines of Table 2). Since there were no significant interaction terms with these pairs of factors, the results for the main effects are similar to those discussed in the previous section.
Discussion
Education is a socio-demographic modifying factor that constitutes an important dimension in the Health Belief Model. Formal education is expected to make people more knowledgeable about the benefits of, and barriers to, good nutrition and healthy dietary behaviour, including the intake of fruit and vegetables. A positive relationship between education and the consumption of fruit and vegetables has been observed in different contexts around the globe (Azagba & Sharaf, Reference Azagba and Sharaf2011; Yen et al., Reference Yen, Tan and Nayga2011; Li et al., Reference Li, Li, Ma, Liu, Hui-Ding, Wen and Peng2012; Hong et al., Reference Hong, Kim and Kim2012). However, while many existing studies on healthy dietary behaviour found a higher consumption of fruit and vegetables in respondents who had attained a higher level of education, in Ghana Amo-Adjei and Kumi-Kyereme (Reference Amo-Adjei and Kumi-Kyereme2014) found an inverse association between education and fruit and vegetable consumption.
The current study found that education did not make any difference, by gender, to the consumption of fruit and vegetable consumption of young Ghanaians. The only significant association was at the higher education level, where females consumed more fruit and vegetables than males. The fact that there was no main effect for education, especially for males and to a large extent for females, supports Amo-Adjei and Kumi-Kyereme’s (Reference Amo-Adjei and Kumi-Kyereme2014) finding.
There was a main effect for religion and a marginally significant interaction effect for religion and education for males, while among females religion failed to reach statistical significance. Many religious doctrines and teachings entail prescriptions of healthy dietary behaviours, and proscribe unhealthy dietary behaviours such as drinking alcohol and coffee, and smoking. For instance, Muslims and Jews are known to prescribe healthy dietary behaviours, as evidenced by the compulsory fasting (Ramadan) among the former, during which they are encouraged to eat lots of fruit to break their fast (Qur’an, 2007). This practice may become habitual for adherents to the faith and thus ensure healthier dietary behaviours later in life. Moreover, members of the Church of Jesus Christ of Latter-Day Saints (Mormons) are encouraged to refrain from drinking coffee or any drink that contains caffeine (Bushman, Reference Bushman2008). These doctrinal differences and teachings probably explain why the current study found that Other Christian and Muslim males were more likely than their Traditionalist/Spiritualist counterparts to consume more fruit and vegetables.
After controlling for all the socio-demographic factors in the model, youth who belonged to the Mande ethnic group were more likely than those from other ethnic groups to consume more fruit and vegetables, while those who resided in the Brong/Ahafo, Ashanti and Eastern regions were more likely to consume more fruit and vegetables. To the extent that ethnicity reflects cultural preferences, including food, it does affect dietary behaviours of members of these groups. For example, in Ghana, different ethnic groups have different staple foods that include locally grown vegetables, which serve as an accompaniment to usually carbohydrate-based staples.
Region of residence had a main effect for both females and males, while it had a significant interaction effect with location for both genders. Moreover, region had a marginally significant interaction effect with education for males and a significant interaction with religion for females. The finding of a relationship between region of residence and the consumption of fruits and vegetables corroborates that of previous studies in other contexts. For example, Azagba and Sharaf (Reference Azagba and Sharaf2011) observed a significant relationship between respondent’s province of residence in Canada and the consumption of fruit and vegetables. Within the Ghanaian context, the low consumption of fruit and vegetables in the Volta and three Northern regions compared with the Brong/Ahafo region shows the differences in dietary behaviours in the different regions which are located in the ecological zones studied by Amo-Adjei and Kumi-Kyereme (Reference Amo-Adjei and Kumi-Kyereme2014). While, in general, like most developing countries, the production of fruit and vegetables in Ghana is seasonal, some regions are better off than others due to differences in ecological conditions. This perhaps explains the relatively low consumption of fruit and vegetable by Ghanaians in general, regardless of geographical location. The Brong/Ahafo, Ashanti and Eastern regions are predominantly agricultural regions located in the forest belt where the bulk of the country’s fruit and vegetables are produced. These regions therefore might not be affected much by the seasonality that characterizes agriculture in general in the country, and the three northern regions, the Volta and Greater/Accra regions, which lie in the arid and semi-arid ecological zones. Amo-Adjei and Kumi-Kyereme (Reference Amo-Adjei and Kumi-Kyereme2014) could not have put it better when they observed that, culturally, most Ghanaians eat fruit not because of its health benefits but rather as a means of filling their stomachs, while vegetable consumption is mostly seen as an exotic cultural practice.
In conclusion, this study has shown that fruit and vegetable consumption is low among young people in Ghana due to a combination of regional, residence, religious, educational and cultural (ethnic) factors. In the face of the growing prevalence of non-communicable diseases in Ghana, there is a clear need for intervention by policymakers to educate the population about the health benefits of eating fruit and vegetables.
Study limitations
A major limitation of this study is its inability to make causal inferences about the impact of the socio-demographic factors examined because of the cross-sectional nature of the survey. Second, and related to the above limitation, the findings were based on repondents’ self-reports, rather than a direct observation of their eating habits. Self-reports are, by nature, riddled with errors due to memory lapse and social desirability on the part of respondents. Thirdly, and this is not necessarily a limitation, even though the Health Belief Model was employed as a conceptual tool, the only dimension of the model that was operationalized in the study was the socio-demographic dimension. Data on the other components of the model are not available in the DHS and testing these will probably require collecting primary data.
Policy implications
The unpopularity of fruit and vegetables among young people in Ghana underscores the need for interventions to get them to understand the health benefits of good nutrition. The state has been proactive in health-promotion interventions to educate the entire population about the health benefits of good nutrition, but the observed variations in the socio-demographic factors affecting fruit and vegetable consumption suggest that inventions should not be ‘one-size-fits-all’, but rather be specific to the needs of men and women, regions and the ethnic groups. This study, like that of Amo-Adjei and Kumi-Kyereme (Reference Amo-Adjei and Kumi-Kyereme2014), has underscored the concentration and seasonality of the production of fruit and vegetables in particular regions of the country, particularly Brong/Ahafo. Thus interventions should seek to encourage an equitable distribution of fruit and vegetable to other regions of the country.
Acknowledgement
The authors are grateful to Dr Richard Madsen, Professor Emeritus of Biostatistics, Department of Statistics, University of Missouri, Columbia, USA, for statistical consultation.