Introduction
Heteroepitaxy is a synthesis method that grows a crystalline film on a crystalline substrate of a different material. It is one of the most widely used methods for depositing semiconductor and metallic materials to form thin films or multilayers. The most important type of defects in heteroepitaxial systems is misfit dislocation. In heteroepitaxial growth of films or multilayers with large lattice mismatch, misfit dislocations are generated in the heterostructures when the epilayer thickness exceeds a critical value. This critical thickness can range from a few nanometers to tens or hundreds of nanometers, depending on the lattice mismatch and the growth direction. Misfit dislocations play a significant role in influencing the functional performance of the systems, including electrical, optical, thermal and mechanical performances. Consequently, extensive experimental and theoretical research efforts have been dedicated to understanding the details of the misfit dislocations in epitaxial heterostructures.
There are two early theories for the interpretation of experimental observations and for the prediction of critical thickness. The first theory was proposed by Frank and van der Merwe (FM) in 1949 [Reference Frank and Van der Merwe1, Reference Ball, Van der Merwe and Nabarro2]. The FM theory is based on the concept of energy minimization by balancing the elastic strain energy in the system against the interface energy. The second theory proposed by Matthews and Blackeslee (MB) in 1974 [Reference Matthews and Blakeslee3, Reference Matthews4] is based on force balance between existing dislocations. Energetically, the MB model is “equivalent to saying that misfit dislocations form when their self-energy is less than the elastic energy they relax” [Reference Hull and Bean5] and hence it is also referred to as an energy criterion [Reference Ernst6]. Both FM and MB theories are equilibrium theories and have been experimentally verified for a wide range of systems. The discrepancy between experimental measurements and the energy criteria is found to decrease with increasing growth temperature [Reference Hull and Bean5].
These early experimental and theoretical studies have provided a basic understanding of the strain relaxation and misfit dislocation generation in heteroepitaxial systems. Reproducing the experimentally observed dislocation structures and formation processes in semiconductor materials, as well as the critical thickness, however, has been proved to be nontrivial for computational methods.
Among various computational efforts, the continuum mesoscale simulation tool Dislocation Dynamics (DD) is one of the earliest computational methods to have been used to quantify misfit dislocations in heteroepitaxial thin films [Reference Schwarz7, Reference Mooney and Chu8]. Recent related continuum modeling work [Reference Sangghaleh and Demkowicz9] pursues dislocation-based models of interface structure for cubic crystals, described analytically using the quantized Frank–Bilby equation. Mesoscale simulations of dislocations in strained layers using such continuum modeling methods have contributed to our understanding of the interaction and multiplications of dislocation in epitaxial films. However, it is challenging for these discrete dislocation methods to quantitatively predict the dislocation density, and dislocation core structure is not accessible. Moreover, the nucleation of dislocations during the growth processes cannot be fully captured using DD, which is only based on interface character and does not consider atomic-level restructuring that may contribute to the understanding of critical thickness or potential mobility of interface dislocations.
Atomically resolved molecular dynamics (MD) simulations have been used to study dislocation nucleation and strain relaxation in heteroepitaxy [Reference Schneider, Rahman and Schuller10, Reference Yu and Madhukar11, Reference Dong, Schnitker, Smith and Srolovitz12, Reference Gruber, Zhou, Jones, Lee and Tucker13]. By sequentially injecting atoms or clusters of atoms toward the surface of a substrate, a number of MD studies attempted to mimic the kinetics of the growth process [Reference Dong, Schnitker, Smith and Srolovitz12, Reference Gruber, Zhou, Jones, Lee and Tucker13, Reference Kubo, Miura, Yamauchi, Vetrivel and Miyamoto14, Reference Zhang, Liu, Shu and Fan15, Reference Meng, Sun, Wang and Ding16, Reference Cheng, Liang, Nie, Choudhary, Phillpot, Asthagiri and Sinnott17, Reference Hassani, Makan, Sbiaai, Tabyaoui and Hasnaoui18]. These MD simulations have shown the promise of the predictive power of atomic-interaction-based methods in simulating nucleation of dislocations, although existing MD simulations are limited in terms of both simulation time (∼1 ns) and simulation model size (<30 nm).
The Concurrent Atomistic Continuum (CAC) method has emerged as a coarse grained atomistic simulation method of dislocations and microstructures [Reference Xiong, Deng, Tucker, McDowell and Chen19, Reference Xiong, McDowell and Chen20, Reference Xiong, Tucker, McDowell and Chen21, Reference Xu, Xiong, Chen and McDowell22, Reference Xiong, Rigelesaiyin, Chen, Xu, McDowell and Chen23, Reference Xiong, Xu, McDowell and Chen24, Reference Chen, Li, Xiong, Li, Yang, Zheng, McDowell and Chen25, Reference Yang and Chen26, Reference Yang, Zhang and Chen27, Reference Chen, Zimmerman, Krivtsov and McDowell28]. The method is based on a unified atomistic–continuum formulation that links atomistic and continuum descriptions of physical quantities [Reference Chen and Lee29, Reference Chen30, Reference Chen and Diaz31, Reference Chen32, Reference Chen and Diaz33, Reference Chen34]. The theoretical formulation is an extension of Irving–Kirkwood statistical mechanical theory of transport processes for homogenized molecular systems [Reference Irving and Kirkwood35] to a concurrent two-level description of crystalline materials [Reference Chen and Lee29, Reference Chen30]. The formulation is numerically implemented using the finite element method. CAC thus reduces the DOFs of an atomistic model with coarse-grained description using the finite element method while maintaining accuracy in describing defect structure with atomic resolution. The method has been demonstrated to be effective in the modeling and simulation of dislocations [Reference Xiong, Xu, McDowell and Chen24, Reference Xu, Xiong, Chen and McDowell36, Reference Xu, Xiong, Chen and McDowell37].
In this work, CAC is employed to study the interface misfit dislocations in a PbTe/PbSe(001) heteroepitaxial system. The PbTe/PbSe system is one of the heteroepitaxial systems that have been experimentally investigated. Springholz and Wiesauer observed exceedingly regular square arrays of misfit dislocations at PbTe/PbSe(001) interfaces using scanning tunneling microscopy (STM); it was found that the lateral period of misfit dislocation network varies from 10 to 20 nm with increasing layer thickness of the PbTe layer during the growth process [Reference Springholz and Wiesauer38, Reference Wiesauer and Springholz39]. It is thus an ideal model system for this study.
It should be noted that the dislocation structure and density at the interfaces of heteroepitaxial thin films in general depend on the kinetics of growth processes and growth temperature. Nevertheless, there are many experimental observations [Reference Hull and Bean5] showing that misfit dislocations in heteroepitaxial thin films after post-growth annealing are consistent with an energy criterion [Reference Ernst6]. As the first step toward a comprehensive understanding of the formation processes and mechanisms of misfit dislocation in heteroepitaxy, the objective of this work is to investigate the equilibrium structure of misfit dislocation networks that minimize the system energy.
This paper is organized as follows. After the introduction, in section “Results and Discussion”, we present simulation results of the dislocation structure and comparisons of potential energy for bilayer models with different initial conditions; the effect of layer thickness on the spacing of misfit dislocations is discussed; in section “Conclusion”, we give a brief summary and conclusions; at the end of the paper, we introduce the computer models and simulation setups, including the interatomic potential we applied in the simulations.
Results and discussion
Sixty four bilayer models composed of PbSe substrate and PbTe epilayer are built with different initial conditions, including the initial distance, l, of adjacent unit cells in the PbTe layer along the X and Y directions and the relative positions of the PbTe layer with respect to the PbSe substrate along the X and Y directions (discussed below). These models are then relaxed at 300 K for 20 ps and cooled down to ∼10−3 K using CAC. The potential energy of the relaxed configuration of each model is computed. A global minimum energy configuration of the PbTe/PbSe(001) interface at different PbTe epilayer thicknesses is then obtained by comparing the total energies of the models.
It is found that variations in the relative positions of the epilayer with respect to the substrate in the lateral directions have negligible effect on the structure of interface after relaxation. The variation of potential energy of relaxed models is less than 0.001%. Therefore, we set the initial relative positions of the epilayer with respect to the substrate to zero in the lateral directions for all simulations.
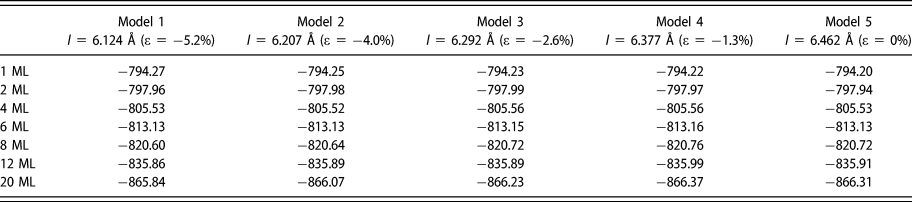
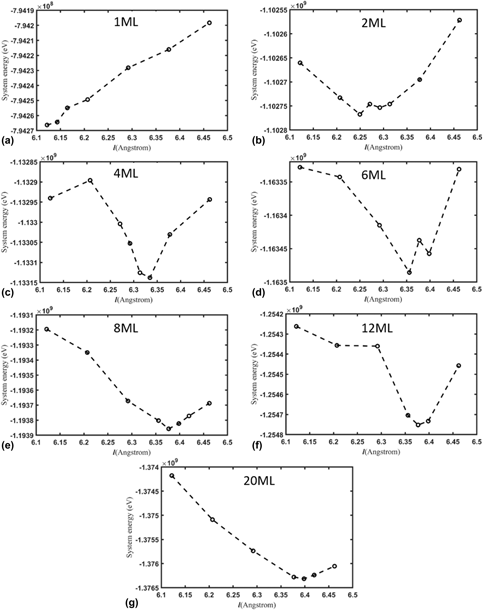
By contrast, various values of l, i.e., the initial distance between adjacent unit cells in the PbTe layer lead to different potential energies of the associated relaxed models, as shown in Table 1. In Fig. 1 we present the calculated potential energies as a function of l for various layer thicknesses. At each layer thickness of the relaxed models, we identify a minimum energy configuration among five values of l. For the model that leads to the minimum energy configuration, we perform additional simulations with 2–3 different values of l near that of the model so as to increase the probability to obtain the global minimum energy configuration at each layer thickness. The configurations with minimum energy are the energetically favorable structures at each specific layer thickness.
Potential energy (in MeV) after relaxation for various initial conditions of bilayer models, where l denotes the distance of adjacent unit cells in PbTe layer along the X and Y directions (see Fig. 6). Each value of l produces a distinct elastic strain (ε) of the PbTe layer.

Potential energy of relaxed bicrystal models versus distance, l, of adjacent unit cells in the PbTe layer along the X and Y directions in the initial bilayer models at the layer thicknesses of (a) 1 ML, (b) 2 ML, (c) 4 ML, (d) 6 ML, (e) 8 ML, (f) 12 ML and (g) 20 ML, respectively.

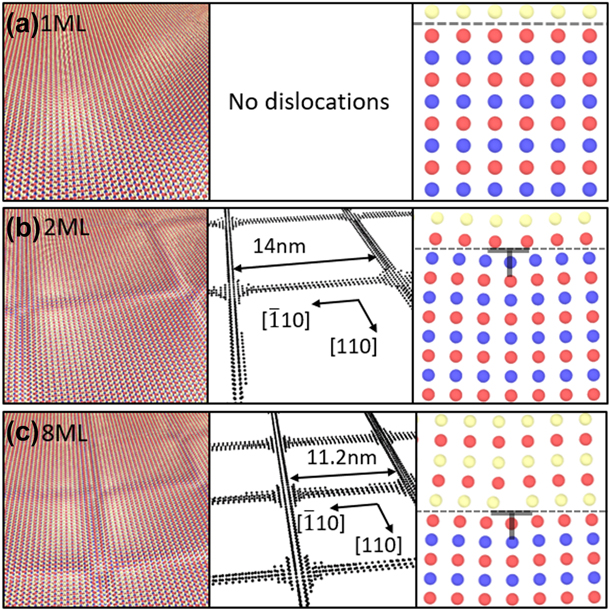
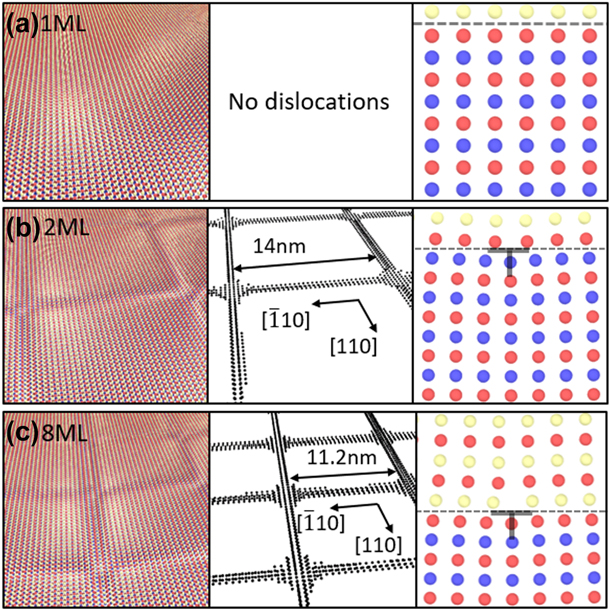
The images in the left column of Fig. 2 show the atomic structure of the interface corresponding to these minimum energy configurations at layer thicknesses of 1, 2, and 8 ML as examples. A dislocation extraction algorithm (DXA) developed by Stukowski et al. [Reference Stukowski and Albe40] is employed to analyze the interfacial structure. In the middle column of Fig. 2, atoms are colored in terms of their crystal structure. Atoms with rock salt crystal structure are not shown. Black atoms are not identified with any type of crystal structure. They indicate the positions of misfit dislocation cores. It is shown that square networks of misfit dislocations form on PbTe/PbSe interfaces with epilayer thicknesses of 2 and 8 ML. A detailed view of dislocation structure is shown in the right column of Fig. 2. The misfit dislocations are of pure edge character with Burgers vector b = (a/2)〈110〉, where a is the lattice parameter.
Figures on left column show the equilibrium atomic structures of the interface with minimum energy at PbTe layer thickness of (a) 1ML, (b) 2ML and (c) 8ML, respectively. Figures on the middle column show the misfit dislocation networks. There is no dislocation in (a). The average spacings of dislocation networks are 21.6nm and 11.2nm in (b) and (c), respectively. Figures on the right column show detailed view of the dislocation structures at layer thicknesses of 1ML, 2ML and 8ML, respectively. The dashed line shows the position of the interface.
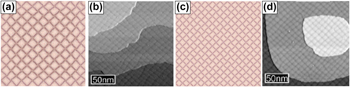
Figures 3(a) and 3(c) present the atomic configuration of the PbTa/PbSe interface with the PbTe layer thicknesses being 4 and 8 ML obtained by the CAC simulations. The average dislocation spacings at the interfaces are 13.1 nm and 11.2 nm, respectively. The STM images of PbTe epilayers on PbSe(001) with PbTe layer thickness being 4.5 and 9 ML [Reference Springholz and Wiesauer38] are presented in Figs. 3(b) and 3(d) for the comparison purpose. The average spacings of the misfit dislocations measured in the experiments are 10.7 ± 2.1 nm and 10.1 ± 1.2 nm, respectively. It is seen from Fig. 3 that the CAC simulation results of the highly periodic edge dislocation arrays at the PbTe/PbSe(001) interface are comparable with the experimental results.
Atomic configuration of the PbTe/PbSe interface, (a) and (c) CAC simulation results with the PbTe layer thickness being (a) 4ML and (c) 8ML, respectively; the image size is 180×180; (b) and (d), STM images of PbTe epilayers on PbSe (001) at coverages of (b) 4.5 ML and (d) 9ML, respectively. (b) and (d) reuse the STM images in Springholz and Wiesauer's paper in 2001 [Reference Springholz and Wiesauer38].
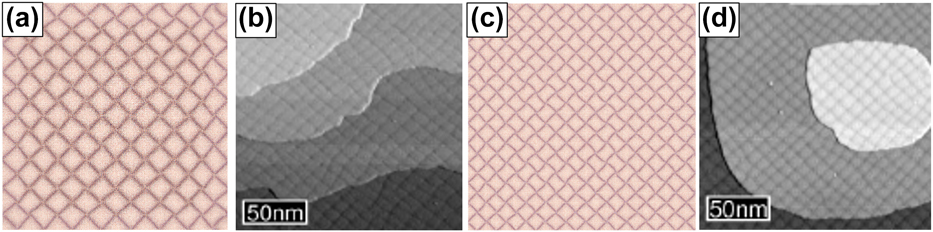
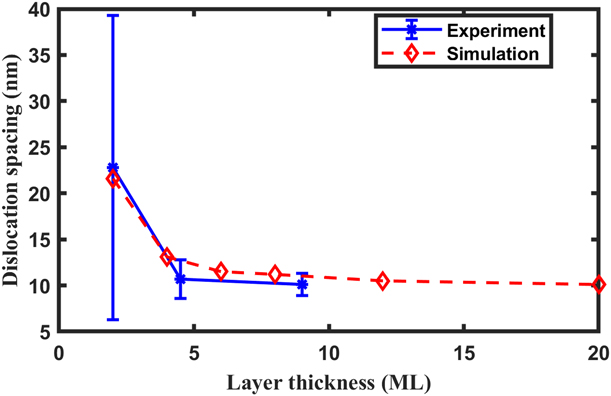
Figure 4 shows the dependence of the average dislocation spacing on the PbTe layer thickness. The 1 ML PbTe layer model with a coherent interface has the minimum potential energy among the thicknesses considered. For a 2 ML PbTe layer thickness, the semi-coherent interface with an average dislocation spacing of 21.6 nm is more energetically favorable. This indicates that the critical thickness of the system is 1 ML, beyond which misfit dislocations form. As the layer thickness increases from 4 to 20 ML, we find that the dislocation spacing at the semi-coherent interface that corresponds to each minimum energy configuration reduces from 13.1 to 10.1 nm.
The average-dislocation-spacing as a function of PbTe layer thickness. The experimental results [Reference Fan, Koster, Wang, Fang, Yalcin, Tichelaar, Zandbergen, van Huis and Vlugt41] are shown for comparison. For 1ML PbTe layer, no misfit dislocations are observed at interface in both CAC simulations and experiments.
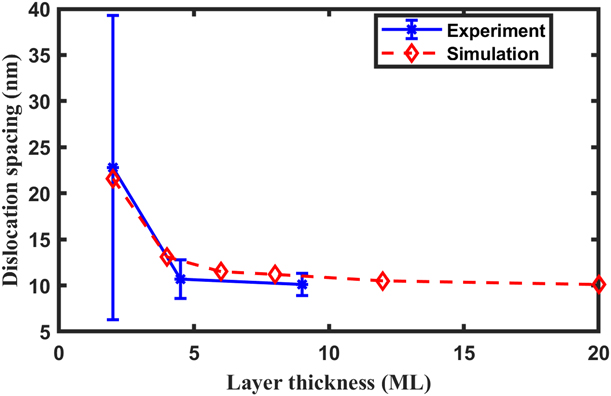
The dislocation-spacing dependence on layer thickness of the PbTe layer was observed in experiments by Springholz and Wiesauer [Reference Springholz and Wiesauer38, Reference Wiesauer and Springholz39]. They found that the dislocation spacings were 22.8 ± 16.5 nm at a layer thickness of 2 ML, 10.7 ± 2.1 nm at a layer thickness of 4.5 ML, and 10.1 ± 1.2 nm at a layer thickness of 9 ML. For comparison, the experimental results are shown in Fig. 4. As can be seen, simulation results show similar PbTe layer thickness dependence of average misfit dislocation spacing to experimental results. The critical layer thickness of 1 ML obtained in the simulations also agrees well with experimental results.
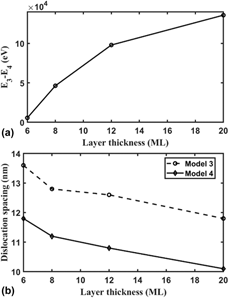
For PbTe layer thicknesses of 6, 8, 12, and 20 ML, we compute and compare the potential energy, E3, of the relaxed configuration from model 3 (l = 6.292 Å) and the potential energy, E4, of the equilibrium configuration relaxed from model 4 (l = 6.377 Å). The relaxed interface structure from model 4 is more energetically favorable due to its lower potential energy. The relative potential energy for model 3 with respect to model 4, (E3 − E4), as a function of layer thickness, is shown in Fig. 5(a). The dislocation spacing for the two models as a function of layer thickness is shown in Fig. 5(b). It is shown that the dislocation spacing in model 3 is always about 1.7 nm larger than that of model 4. However, the relative potential energy for model 3 with respect to model 4 increases with increasing layer thickness. Although the difference between the dislocation spacing in two system states is constant, the difference between the potential energy of two system states increases with layer thickness. This suggests that the system tends to be trapped in the minimum energy configuration and is unlikely to transition to other configurations at larger layer thicknesses. This appears to explain the experimental finding that the spread of the distribution of misfit dislocation spacing decreases as layer thickness increases.
(a) The relative potential energy of relaxed configuration of model 3 (E 3) with respect to that of model 4 (E 4); (b) average misfit dislocation spacings in the relaxed configurations of model 3 and model 4 as a function of layer thickness, respectively.

Conclusions
In summary, we have studied the misfit dislocation networks in the PbTe/PbSe(001) heteroepitaxial system using CAC simulations by considering the minimum potential energy of relaxed interface structures for various initial conditions and PbTe layer thicknesses. We investigated the minimum energy structure of the interface at different layer thicknesses.
CAC simulations yielded results of the critical layer thickness, dislocation type and dependence of average dislocation spacing dependence on the PbTe layer thickness in good agreement with the experimental measurements [Reference Springholz and Wiesauer38, Reference Wiesauer and Springholz39]. Specifically, CAC simulations successfully predicted the structures and average spacings of misfit dislocation networks at the PbTe/PbSe(001) interfaces for different layer thicknesses, with substantially reduced model degrees of freedom compared to fully atomistic simulations, while still retaining the ability to model details of dislocation nucleation and core reconstruction as a function of PbTe layer thickness. Simulation results also explain the reason for the decrease in the spread of the distribution of spacing of misfit dislocations at the interface observed experimentally as the PbTe layer thickness increases from the perspective of system energy.
In addition, the results of this work indicate that the CAC method can be used to gain insight into misfit dislocation structures and large-scale misfit dislocation network in heteroepitaxy. The work serves as the first step toward building a more comprehensive understanding of formation processes and mechanisms of misfit dislocation in heteroepitaxy.
Methodology
For the CAC simulation of the heteroepitaxial PbSe–PbTe system, a pair potential model is first developed based on a transferable model for PbS–PbSe solid systems [Reference Fan, Koster, Wang, Fang, Yalcin, Tichelaar, Zandbergen, van Huis and Vlugt41]. This potential model contains long-range Coulombic interaction and short-range Buckingham potential, which can be written as:
 $$U\left( r \right) = {{{q_i}{q_j}} \over r} + A{{\rm{e}}^{ - Br}} - {C \over {{r^6}}}\quad ,$$
where q are partial charges and A, B, and C are parameters in the Buckingham potential. Interaction between two cations is purely a Coulombic interaction so that the short-ranged Buckingham potential is neglected.
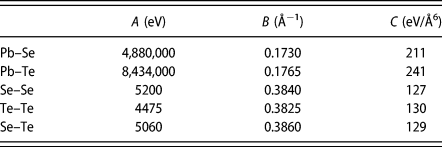
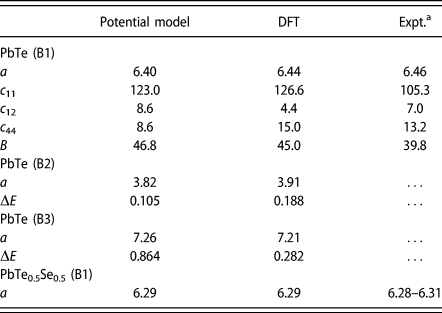
For the PbSe–PbTe system, the partial charges for cation (Pb) and anions (Se and Te) were ±0.8 e, respectively. The parameters for PbSe were kept the same as those in the original model, and thus only the parameters of the Buckingham potential for Te–Te and Se–Te interactions are needed to include PbTe to the PbSe–PbTe system. We used the same fitting methodology as described in Ref. Reference Fan, Koster, Wang, Fang, Yalcin, Tichelaar, Zandbergen, van Huis and Vlugt41 to parameterize the potential model. The Buckingham potential parameters were obtained by fitting to several physical properties of the PbTe–PbSe system, including the lattice parameter, elastic constants, and bulk modulus of PbTe in B1 phase, the lattice parameters and phase stability of PbTe in B2 and B3 phases, as well as the lattice parameter of PbSe0.5Te0.5 alloy. The parameters of the potential model and the physical properties calculated by the model are provided in Table II and Table III, respectively.
Parameters of the potential model for the PbSe–PbTe system. Partial charges for cation and anions are ±0.8 e, respectively.

Physical properties of PbTe and PbSe0.5Te0.5 obtained by the potential model and DFT calculations, together with available experimental measurements. a is lattice parameter in Å; c ij and B are elastic constant and bulk modulus, respectively (in GPa); ΔE is relative energy with respect to the B1 phase (in eV/atom).

a Experimental measurements from Refs. Reference Dalven42, Reference Miller, Saunders and Yogurtcu43, and Reference Rawat, Paul and Banerji44.
Heteroepitaxial thin films PbTe and PbSe have lattice constants of 6.462 Å and 6.124 Å, respectively. The lattice mismatch is therefore ∼5.2%. A series of bilayer models with different thicknesses of the PbTe epilayer, each with different initial conditions by systematically varying the relative positions of the PbTe and PbSe atoms in the initial configurations, are constructed. The systems are then relaxed using CAC simulations. The relaxation procedure is described as follows: systems with the initial conditions are first dynamically relaxed for 10 ps; they are then heated to a kinetic temperature of 300 K by rescaling the velocities of finite element nodes and atoms; thereafter the systems are relaxed for 20 ps again, followed by a dynamic simulation with a small viscous damping force applied on nodes and atoms until the kinetic energy of the final systems are decreased to ∼10−3 K. The potential energy of the final equilibrium models is then calculated and compared, with the purpose of finding the global minimum energy configuration of the bilayer models as a function of the PbTe epilayer thickness [Reference Rittner and Seidman45].
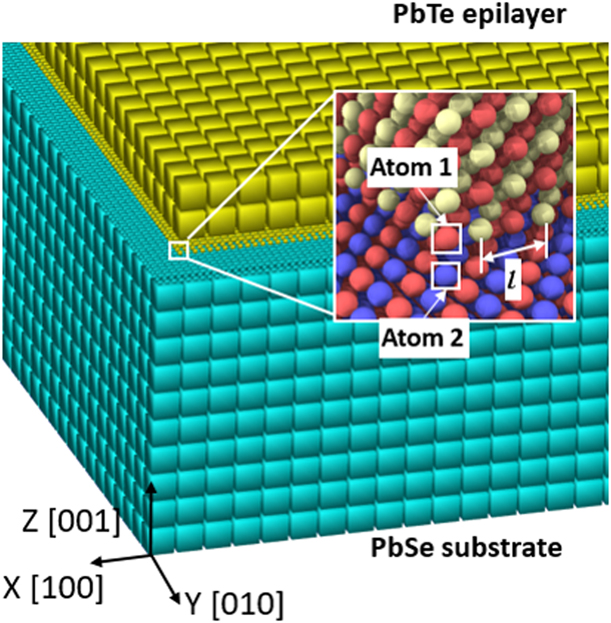
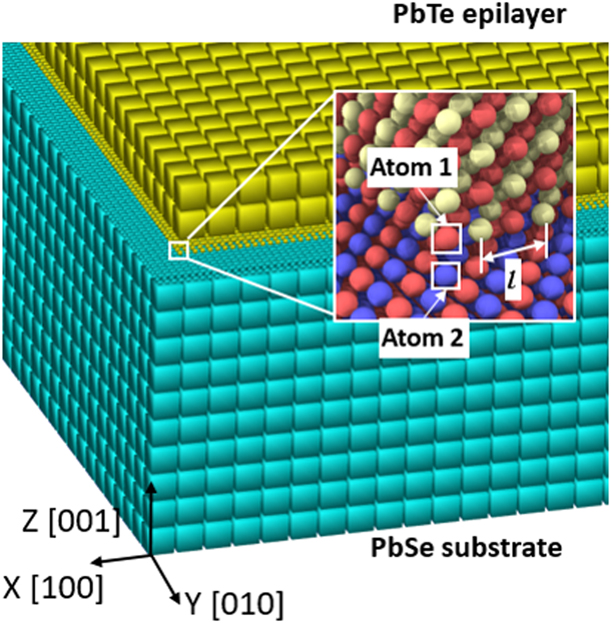
Figure 6 shows one of the initial bilayer models in CAC simulations. In order to accurately reproduce the atomic-level structure of the interface misfit dislocations, the PbSe–PbTe interface region is modeled with full atomic resolution. Simulation results show that increasing the size of the interface region modeled with the atomic resolution from 8 ML (monolayers) to 16 ML has no appreciable effect on the misfit dislocation structure and spacing. Therefore, in this study, the thickness of the interface region modeled with atomic resolution is 8 ML. Other parts of the model are coarse-grained (CG), with each element containing 4096 atoms. The PbSe substrate contains 78 × 78 × 10 coarse elements and 12.5 million discrete atoms. The PbTe layer contains 576 unit cells along the X and Y directions, respectively. The thickness of the PbTe epilayer varies from 1 to 20 ML to enable study of film growth effects on interface dislocations. The simulation cell dimensions are about 380 × 380 × 60 nm3. An equivalent atomistic model of the system would contain 0.26–0.31 billion atoms.
Schematic diagram of the bilayer simulation model. The X, Y, and Z directions are along [100], [010], and [001] lattice directions, respectively. The inset shows an exploded view of the atomic structure at the corner of the PbTe layer. Red spheres denote Pb atoms, blue spheres denote Se atoms, and yellow spheres denote Te atoms. The relative position of the epilayer with respect to the substrate is defined as the relative position of atom 1 with respect to atom 2. In this figure, the relative position of atom 1 with respect to atom 2 is 0 along the X and Y directions. l denotes the distance of adjacent unit cells in PbTe layer along the X and Y directions in initial bilayer models.
In experiments, the surface of the PbSe substrate was observed to be flat at the beginning of the growth, and a flat 2D surface was observed on the PbTe layer even during strained-layer heteroepitaxial growth [Reference Wiesauer and Springholz39]. It indicates that the PbSe substrate should be under almost zero strain along the directions parallel to the interface during the growth process; otherwise the strained substrate would make the surface of the PbTe layer uneven. To simulate the PbSe substrate with negligible strain along in-plane directions, periodic boundary conditions are applied along the X and Y directions and the bottom of the substrate is fixed. A net traction free boundary condition is applied in the Z direction to best represent the growth process.
According to experimental result [Reference Wiesauer and Springholz39], during the growth process, the in-plane lattice parameter of the PbTe layer is not constant. For the 1 ML thin PbTe layer, the coherent PbTe layer is under compressive strain and the in-plane lattice parameter equals the lattice parameter of bulk PbSe. As growth proceeds, the elastic strain energy is relieved by the formation of misfit dislocations and the in-plane lattice parameter of the PbTe layer increases rapidly, approaching that of bulk PbTe. In this research, when building the initial bilayer models prior to relaxation, we employ a range of values for the initial distance, l, of adjacent unit cells in the PbTe layer along the X and Y directions from 6.124 Å to 6.462 Å with an interval of 0.08 Å.
In addition to l, we also consider the relative position between the substrate and the epilayer when building the initial models prior to relaxation and associated energy reduction. This relative position is defined as the relative position of atom 1 with respect to atom 2 in Fig. 6 along the X and Y directions. The relative position in the initial bilayer models is varied from 0 to 3.062 Å with an interval of 0.6 Å; 3.062 Å is half of the bulk lattice parameter of PbSe.
Under applied boundary conditions during relaxation, the deformation of the PbTe layer and rigid-body translation between the PbTe layer and the PbSe substrate are free to occur if they are energetically favorable.
Acknowledgments
This material is based upon research supported by the National Science Foundation with award numbers CMMI 1761553 and 1761512. The work of Y.L. and W.L. is supported by the U.S. Department of Energy, Office of Science, Basic Energy Sciences, Division of Materials Sciences and Engineering under Award # DE-SC0006539. The computer simulations are funded by the Extreme Science and Engineering Discovery Environment (XSEDE allocations TG-MSS180017 and TG-DMR190008)