I. INTRODUCTION
Two dimensional (2D) materials possess a unique combination of electronic and mechanical properties enabling the next generation of electronic devices such as wearable sensors and electronics. Reference Akinwande, Petrone and Hone1 Molecularly thin molybdenum disulfide (MoS2) is a promising 2D semiconductor due to its relatively high charge mobility Reference Fivaz and Mooser2 and a direct band gap of 1.8 eV (Refs. Reference Böker, Severin, Müller, Janowitz, Manzke, Voß, Krüger, Mazur and Pollmann3 and Reference Mak, Lee, Hone, Shan and Heinz4) coupled with optical transparency and extreme mechanical flexibility. Reference Lee, Yu, Cui, Petrone, Lee, Choi, Lee, Lee, Yoo and Watanabe5 Heterostructures of 2D transition metal dichalcogenide (TMD) materials allow for band gap tuning and other desirable tailoring of properties. Until recently, the ability to grow high quality continuous TMD films on flexible substrates has remained elusive and thus has hindered the realization of commercial scale flexible devices based on MoS2 and other 2D materials Reference Geim and Grigorieva6 The majority of electronic device studies involving high quality MoS2 crystals use chemically or mechanically exfoliated 2D sheets. Reference Wang, Kalantar-Zadeh, Kis, Coleman and Strano7,Reference Coleman, Lotya, O'Neill, Bergin, King, Khan, Young, Gaucher, De and Smith8 At present, only relatively small samples (approximately 100 μm2) of these high quality 2D materials can be generated in this manner. While chemical exfoliation has proven to be quite scalable, several pervasive issues prevent commercial viability of this approach, including poor layer thickness uniformity, contamination between layers, and the presence of structural defects, such as domain boundaries and wrinkles. Reference Coleman, Lotya, O'Neill, Bergin, King, Khan, Young, Gaucher, De and Smith8–Reference Smith, King, Lotya, Wirtz, Khan, De, O’Neill, Duesberg, Grunlan and Moriarty10 Chemical vapor deposition (CVD) is a common approach for generating high quality, large area 2D thin films. Reference Yu, Li, Liu, Su, Zhang and Cao11–Reference Zhan, Liu, Najmaei, Ajayan and Lou13 Unfortunately, CVD is not amenable to stretchable polymeric substrates due to high deposition temperatures (approximately 700–900 °C) required for decomposition of TMD precursor gases and molecular assembly into crystalline materials. Film lift off methods Reference Yu, Li, Liu, Su, Zhang and Cao11,Reference Lee, Yu, Wang, Fang, Ling, Shi, Lin, Huang, Chang and Chang14–Reference Wang, Feng, Wu and Jiao16 can be used to transfer either exfoliated or CVD grown materials to soft substrates at low temperatures, but these methods are far from ideal, as they often introduce interfacial contamination or wrinkle defects, and are difficult to scale for continuous manufacturing. Most recently magnetron sputtering from TMD targets has been demonstrated to directly grow large area uniform films. Reference Muratore, Hu, Wang, Haque, Bultman, Jespersen, Shamberger, McConney, Naguy and Voevodin17,Reference Tao, Chai, Lu, Wong, Wong, Pan, Xiong, Chi and Wang18 The sputtering approach is scalable to very large areas (>1 m2) and is easily integrated into wafer scale manufacturing processes and roll to roll processing of large polymer sheets. Unfortunately, sputtered TMD films processed at low temperatures (<250 °C) lack the crystallinity required for semiconductor electronic characteristics.
II. APPROACH
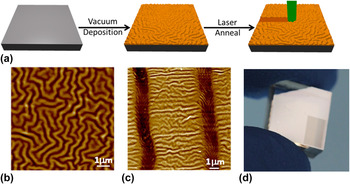
Here, we present the first ever report on an approach to growing crystalline MoS2 directly on a polymer. Specifically, we present a laser annealing process that converts amorphous MoS2 prepared by room temperature magnetron sputtering on elastomeric substrates into crystalline hexagonal MoS2 films of few monolayer thicknesses over large areas. The process also results in crystallization of ultra-thin TMD heterostructures, such as MoS2/WS2 described here. The processing steps for direct synthesis of the crystalline 2D MoS2 films on flexible substrates are presented schematically in Fig. 1(a). The poly dimethyl siloxane (PDMS) is loaded into the ultra-high vacuum chamber. Then the amorphous precursor films are deposited via magnetron sputtering from polycrystalline TMD targets. These films are prepared with mid-frequency pulsed (65 kHz) magnetron sputtering Reference Muratore, Hu, Wang, Haque, Bultman, Jespersen, Shamberger, McConney, Naguy and Voevodin17,Reference Alam, Wang, Pulavarthy, Haque, Muratore, Glavin, Roy and Voevodin19 at room temperature with a growth rate of approximately 0.5 Å s−1 for both MoS2 and WS2. Auxiliary magnetic fields are applied to steer ions away from the substrate and the background argon pressure of 15 mTorr, results in a low energy deposition flux to the polymer substrate which is approximately 7 cm from the sputter target. The films have compressive residual stress indicated by the isotropic buckling morphology of the substrate. An atomic force microscopy (AFM) image of the amorphous MoS2 as deposited onto the elastomer with magnetron sputtering is shown in Fig. 1(b) to illustrate the typical buckled morphology. This morphology is a common feature of thin stiff films intimately bound to elastomers with isotropic compressive residual stress and is a result of strain accommodation through out-of-plane deformations. Reference Bowden, Brittain, Evans, Hutchinson and Whitesides20–Reference Lacour, Wagner, Huang and Suo23 This morphology is distinctly different from delaminated buckling common in thicker films with residual stress and poor substrate adhesion. Reference Yu, Kim and Sanday24 This isotropic buckled morphology enhances the maximum strain without fracture, breaking, or delamination, enabling stretchable, and wearable electronics. Reference Lacour, Wagner, Huang and Suo23,Reference Rogers, Someya and Huang25 Referring back to Fig. 1(a), the as-deposited amorphous MoS2 precursor films are exposed to 514 nm continuous wave (CW) laser radiation for up to 1 s with an irradiance of 5.5 mW/μm2. Upon laser annealing the continuous thin amorphous precursor film is converted to hexagonal 2D MoS2.
Laser induced crystallization of MoS2. (a) Simple schematic of the laser annealing process (b) An AFM micrograph of amorphous MoS2 as deposited on PDMS. The maximum value on the Z-scale is 290 nm (c) An AFM micrograph of a sample after laser annealing 2 lines from amorphous to crystalline MoS2, Z-scale: 52 nm. (d) A large area (3 × 5 mm) of laser annealed MoS2 (shown as the dark region on bottom right hand corner of sample) on a piece of PDMS.

III. RESULTS
An AFM micrograph of a sample with two laser annealed lines is shown in Fig. 1(c). The laser spot diameter is approximately 1.5 μm and the writing speed is approximately 25 μm/s. To make larger areas [>cm2 as shown in Fig. 1(d)] the beam can be rastered across the surface. There is a significant change in the buckled morphology upon laser annealing, which is apparent when comparing Figs. 1(b) and 1(c). There is a pronounced depression in the regions that were directly laser annealed. The depth of the depression is roughly 10× the film thickness and thus likely results from residual stress relaxation rather than surface ablation by the laser. In the area surrounding the laser annealed regions there is a significant decrease in the amplitude of the buckled morphology (notice the z-range difference between the images), thereby indicating a decrease in the residual compressive stress of the localized surrounding areas. It is also notable that the orientation of the buckled morphology alignment after treatment is ordered in contrast to the initial random and isotropic morphology. In the laser annealed regions the buckles are parallel to the direction of the laser movement, whereas, in the regions without laser annealing, the long axis of the buckled morphology is perpendicular to the laser drawn lines.
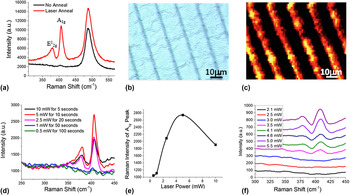
The transition from the amorphous to crystalline TMD material associated with laser annealing is confirmed with Raman spectroscopy. The Raman spectrum of the amorphous MoS2 precursor film, as shown in Fig. 2(a), shows neither the characteristic
 $E_{2{\rm{g}}}^1$
peak associated with in-plane stretching around 383 cm−1 nor the characteristic A1g peak expected for out-of-plane stretching around 407 cm−1. After laser annealing by illuminating the surface with 5.5 mW/μm2 of green radiation, both peaks prominently appear in the Raman spectra as shown in Fig. 2(a). Based on analysis of the central peak positions the film thickness is greater than 5 layers thick.
Reference Lee, Yan, Brus, Heinz, Hone and Ryu26
It should be noted that the peak at 488 cm−1 is associated with the PDMS substrate. Figure 2(b) presents an optical microscopy image of a sample that has lines of crystalline MoS2 created by moving the sample with respect to the laser to ‘draw’ the lines. Figure 2(c) shows a Raman map of the intensity of the A
1g peak of the sample shown in Fig. 2(b).
Raman analysis of laser treatment. (a) Raman spectra of the MoS2 with and without laser annealing (b) optical microscopy image of a sample with laser annealed lines of crystalline MoS2 (c) A Raman map of the sample shown in (b) where the color corresponds to the intensity of the A 1g peak. (d) Raman spectra of from regions with exposures at identical fluence of 50 mJ over 1.5 μm diameter spot, but different laser powers and the corresponding exposures times. (e) Raman intensity from the A 1g peak for the various exposures shown in (a). (f) Raman spectra from different exposure intensities for 1 s. The spectra were offset along the y-axis for clarity. Exposures examined in (d) and (f) were over a 1.5 μm circular spot.

Figure 2(d) presents Raman spectra of amorphous sputtered MoS2 samples exposed to the same total fluence (50 mJ in a 1.5 μm diameter spot) but with different combinations of laser irradiance and exposure times. The Fig. 2(e) is a plot of the A 1g peak intensity versus the laser power for the fluence equivalent exposures plotted in Fig. 2(d). A fluence dependent photo-chemical process would result in the same structural change at different irradiance-time combinations that are fluence equivalent, and thus a horizontal line in the Fig. 2(e) would be expected for such. Figure 2(f) presents Raman spectra from spots exposed to different laser irradiance. The threshold laser irradiance is 3.5 mW over a 1.5 μm diameter spot size, or 2 mW/μm2. From the data in Fig. 2 it is quite evident that the laser annealing mechanisms of hexagonal structure formation in MoS2 is not a fluence dependent process, but instead is highly dependent on the irradiance. The amorphous sample appears undisturbed at or below an irradiance of 1.7 mW/μm2 over a 1 s exposure, whereas when the irradiance is too high, e.g., above 20 mW/μm2, the films become damaged. At these higher radiation power densities there is enough photo-thermal energy coupled to the surface to cause localized ablation and damage to both the amorphous Mo-S film and the underlying PDMS. It is not surprising that this intense 514 nm radiation can ablate the MoS2 film; such behavior has been reported by Steele and co-workers as a method to pattern MoS2 and generate single-layer MoS2 from multi-layer exfoliated sheets. Reference Castellanos-Gomez, Barkelid, Goossens, Calado, van der Zant and Steele27 It is worth noting that PDMS is transparent to the optical laser radiation (λ = 514 nm) used here, thus the sample surface is unaffected by the radiation when the PDMS substrate is uncoated.
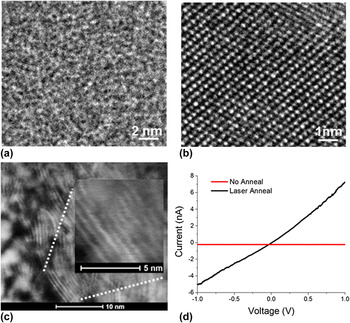
Samples were also prepared by depositing amorphous MoS2 precursor films on silicon transmission electron microscope (TEM) grids covered by a thin freely suspended amorphous carbon layer. These were laser annealed in an identical manner to the MoS2 samples on the PDMS. Plan-view TEM images of the as-grown precursor film [Fig. 3(a)] is indicative of the entire sample, which was of uniform thickness over the entire TEM grid. The laser annealed regions on the grid showed strongly oriented MoS2 material with variability in the orientation of the crystallized hexagonal MoS2 grains. Figure 3(b) was taken from a region where the MoS2 crystallized with basal planes parallel to the substrate and the hexagonal crystal structure is clearly seen. A cross-sectional view of the laser annealed MoS2 on PDMS [Fig. 3(c)] shows the orientation of the MoS2 basal planes parallel to the PDMS surface; however the substrate is rather wavy as expected from AFM imaging shown in Fig. 1. The inset shows a zoomed in region of 9 stacked MoS2 layers, where a single layer thickness was directly measured as 0.65 nm, in good agreement with the accepted basal plane spacing. Reference Dickinson and Pauling28
Electron microscopy imaging. (a) & (b) A transmission electron microscopy image of a film prepared on a TEM grid without (a) and with (b) laser annealing. (c) cross-sectional TEM of the laser annealed MoS2 film on PDMS. Inset: zoomed in region showing a stack of MoS2 layers. (d) I–V curve from a region before (red) and after (black) laser annealing.

To probe the electrical properties of the material, multiple localized IV-curves were acquired from regions with and without laser annealing, using conductive force microscopy. Figure 3(d) indicates that the laser treatment converts the MoS2 precursor film from insulating to semiconductive. To further investigate the semiconducting nature of the MoS2, large area samples were made by exposing the sample to a focused 830 nm CW laser in a rastering pattern and subsequently aerosol jet printing (Optomec, Albuquerque, New Mexico) electrodes. I–V curves were then acquired from this sample at various temperatures as shown in Fig. 3(d). The resistance decreased with increasing temperature indicating semiconducting behavior.
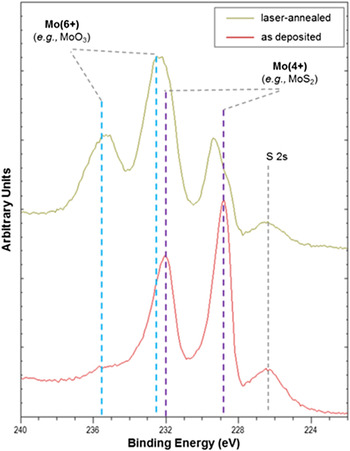
X-ray photon spectroscopy (XPS) was performed to investigate the chemical aspects of the laser annealing process. High resolution spectra of the Mo 3d region from MoS2 films with and without laser treatment were measured as this region provides information about the nature of relevant chemical bonds in MoS2. Figure 4 shows the S 2 s photoelectron peak was observed at 226.4 eV, which is typical for MoS2. The Mo 3d region consists of three distinct sets of doublet peaks (Mo 3d 5/2 and Mo 3d 3/2). The doublet component with Mo 3d 5/2 at 229.3 eV indicates the presence of amorphous MoS2, while Mo–Mo bonds are characterized by a lower energy peak at 228.5 eV. Reference Papageorgopoulos and Jaegermann29,Reference Eda, Yamaguchi, Voiry, Fujita, Chen and Chhowalla30 Oxidized MoS2 and other Mo(6+) species (e.g., MoO3) exhibit a doublet at higher binding energy, with Mo 3d 5/2 and Mo 3d 3/2 at 232.1 and 235.5 eV, respectively. The relative intensities of the Mo 3d component peaks give useful information about film composition and crystallinity. The as-deposited film shows the presence of amorphous MoS2, with a very low concentration of Mo(6+). After laser annealing, the Mo 3d 5/2 peak at 229.3 eV becomes narrower and more intense relative to the Mo–Mo peak at 228.5 eV, another indication that the amorphous MoS2 phase undergoes crystallization to the thermodynamically stable 2H phase following laser annealing. Following laser annealing in air, the peak associated with Mo(6+) becomes more prominent, suggesting some oxidation of the MoS2 film. We observed that annealing in an argon atmosphere eliminates oxidation.
High resolution XPS showing changes in chemical bonding for Mo in as-deposited and laser annealed MoS2.

IV. HETEROSTRUCTURES
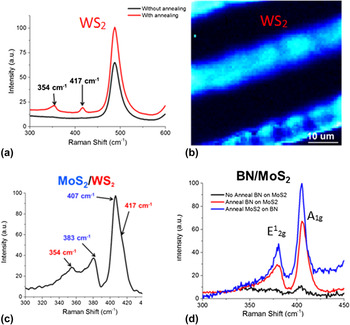
Challenges with heterostructure assembly on the laboratory scale include (i) difficulty of fabrication, where only a small fraction of attempts to produce heterostructures are successful and (ii) contamination between layers, especially for mechanically and chemically exfoliated materials, where transfer processes result in significant alteration of surface chemistry, and therefore properties. Vapor phase synthesis in ultra-high vacuum environments result in pristine interfaces between precursor layers, which can subsequently be annealed. Figures 5(a) and 5(b) show Raman spectroscopy results for a monolithic amorphous WS2 precursor film before and after laser annealing. The results are very similar to those observed for MoS2. Laser annealing of multiple layers of approximately 5 nm thick amorphous WS2 over a layer of amorphous MoS2 with the same thickness results in crystallization of both materials as shown by Raman spectroscopy [Fig. 5(c)]. The order in which the materials is grown can be reversed and similar results are observed. Additionally, a layer of amorphous boron nitride applied via pulsed laser deposition as described elsewhere, Reference Alam, Wang, Pulavarthy, Haque, Muratore, Glavin, Roy and Voevodin19 was applied to the amorphous MoS2 precursor material. Raman spectroscopy shows crystallization of the material though the transparent boron nitride [Fig. 5(d)]. These results demonstrate the potential for synthesis of diverse 2D hetrostructures on flexible substrates.
Raman spectroscopy highlighting laser annealing induced structural changes of: (a and b) monolithic WS2 Raman spectrum before and after annealing, with a map showing laser annealed regions with contrast from the A 1g peak. Heterostructures of (c) WS2 on MoS2 and (d) BN on MoS2 were also synthesized by applying multiple amorphous layers and subsequent laser annealing. In both cases, the initially amorphous TMD layers were crystalized.

V. CRYSTALLIZATION MECHANISMS
The mechanistic details of the observed laser-induced phase transition are the subject of ongoing investigations, but the main underlying process appears to be a thermally driven, kinetically controlled transformation. Essentially the thin films under laser irradiation are quickly heated by laser absorption to a temperature high enough to induce the transition from amorphous films to crystalline MoS2. The photo-thermal nature of the mechanism is supported by several critical observations. Firstly, the laser induced phase transformation is not directly dependent on the fluence (i.e., dosage or time-integrated irradiance), but instead is highly dependent on the laser irradiance. These results refute a photo-electronic process, but support a photo-thermal process. Secondly, the assertion that the mechanism is a kinetically controlled photo-thermal effect is supported by the fact that we were able to achieve the same results with different laser wavelengths, including 660, 785, and 830 nm. The absorption spectrum of MoS2 shows an absorption peak in the UV with a long tail into the NIR. When exposing the precursor films to other wavelengths we observed that a larger irradiance was needed to convert the precursor films at longer wavelengths. This trend also supports a photo-thermal mechanism because the absorption of the precursor film decreases with increasing wave length. Presumably, the PDMS is protected from thermal damage by the combination of the transient nature of the heating by the laser rastered on the surface and the strong thermal anisotropy in crystalline TMD where ultra-low inter-layer thermal conduction is coupled to moderate in plane conduction of the rapidly formed MoS2. Reference Muratore, Varshney, Gengler, Hu, Roy, Farmer and Voevodin31,Reference Muratore, Varshney, Gengler, Bultman, Hu, Smith, Shamberger, Qiu, Ruan, Roy and Voevodin32 In addition, the results from XPS and TEM provide a combined support for a mechanism of chemical rearrangement as opposed to a chemical reaction.
VI. CONCLUSIONS
In summary, we have presented a method of preparing large scale semiconducting 2D TMD films (MoS2 and WS2) on flexible PDMS through laser annealing of PVD films grown at room temperature. The composition and crystalline nature of the few monolayer thick hexagonal laser annealed MoS2 films was confirmed with Raman spectroscopy, XPS and both plan-view and cross-sectional TEM. Experiments to determine the mechanism behind the structural change from amorphous to hexagonal revealed a photo-thermal origin. The electrical properties of the MoS2 annealed regions were characterized with C-AFM and variable temperature conductivity measurements, which confirm their semiconducting behavior, while surrounding amorphous MoS2 film remains an insulator. Heterostructures were synthesized by applying multiple amorphous films with subsequent annealing. Laser annealing of amorphous films on polymer substrates is a simple and scalable approach to complexly pattern semiconducting MoS2 film in an insulating matrix or generating large areas of semiconducting material for fabrication of 2D based flexible/stretchable electronics.
VII. METHODS
The PDMS substrates were prepared from a Sylgard 184 kit (Dow Corning, Midland, Michigan) by mixing the hardener and prepolymer mixture in the typical 1:10 ratio. After 5 min of mixing the mixture was cast onto a smooth silicon wafer in a dish. Then low vacuum was applied to the mixture (approximately 10−3 Torr) to remove air bubbles. After removing the bubbles the mixture was heated to 80 °C for 30 min. Then the substrates were harvested from the dishes and cut up into smaller pieces (approximately 2 × 2 cm). The surface that was cast onto the silicon is the surface that is used for all subsequent experiments. The pieces of PDMS substrates were introduced via a vacuum load-lock and mounted on an electrically grounded fixture. Substrates were rotated at a rate of approximately 100 rpm while positioned 7 cm from the MoS2 target. The synthesis chamber was pumped to a base pressure of <10−9 Torr and was then filled with ultra-high purity argon gas at a constant flow rate of 25 sccm to a pressure of 15 mTorr (2 Pa). All MoS2 films were grown at room temperature via magnetron sputtering using a solid 3.3 cm diameter MoS2 target of 99.95% purity. Pulsed dc power (60W at 65 kHz) was applied to the MoS2 target to initiate the sputtering process. The samples were laser annealed with a Renishaw in Via Raman Microscope equipped with a Modulaser Argon laser with a wave length of 514.5 nm and a maximum power output of 50 mW. The Raman microscope is equipped with a Prior Scientific Proscan II programmable motorized stage. All exposures were performed with a 50x objective in the Raman microscope. Unless noted, spot exposures were performed at 5.5 mW/μm2 for 1 s and writing speeds were up to 25 μm/s. Some initial wave length dependent studies were done with a custom laser treatment system.
The Raman spectra and mapping were acquired with the same Renishaw in Via Raman Microscope and Argon laser that the laser annealing was performed with. The laser intensities of the Raman studies were kept to less than 10% of the minimum threshold power. There was no evidence of surface treatment at these powers even after more than an hour of exposure. To assess film composition, x-ray photoelectron spectroscopic analysis was carried out using a Kratos AXIS Ultra spectrometer (Manchester, United Kingdom) with a monochromatic Al Kα x-ray source (1486.6 eV) operated at 120 W (12 kV, 10 mA) and at approximately 4 × 10⁻⁹ torr. In this system, the analyzer is oriented at 90° relative to the sample surface. High resolution spectra of the Mo 3d region were acquired using an energy step size of 0.1 eV, a dwell time of 500 ms, and analyzer pass energy of 20 eV. XPS spectra were analyzed using the CasaXPS software.
The absorption spectra were obtained with a Carl Ziess Axio transmission microscope (Oberkochen, Germany) equipped with a micro-spectrometer (CRAIC MSP 121, San Dimad, California). AFM images were obtained on a Multimode AFM (Bruker) equipped with a Nanoscope V controller operated in ScanAsyst mode. Conductive-AFM IV curve measurements were obtained with an Asylum MFP-3D (Santa Barbara, California). The thermal-resistance measurements were taken with a Keithley 4200 semiconductor characterization system (Keithley Instruments, Beaverton, Oregon). The silver electrodes for the thermal-resistance measurements were deposited using an Optomec aerosol jet printer. A FEI Nova focused ion beam (FIB) microscope associated with an Omniprobe manipulator (Dallas, Texas) was used to prepare lift-out TEM specimens for showing the cross-sectional microstructure of the film. It was operated using 5 keV electron beams and 30 keV Ga+ ion beams. High-resolution microstructure and chemistries of the films were measured using a FEI Talos scanning/transmission electron microscope (S/TEM; FEI Company, Hillsboro, Oregon), associated with an x-ray energy dispersive spectrometer for elemental mapping and a high-angle annular dark-field detector for Z-contrast imaging.
ACKNOWLEDGMENTS
Financial support from Air Force Office of Scientific Research, Complex Materials and Devices program (15RXCOR184) is gratefully acknowledged. CM gratefully acknowledges support from Air Force Research Laboratory funded DAGSI program and AFRL Materials and Manufacturing Directorate Laboratory Director's Funds to sponsor this work. CM would also like to acknowledge Advanced Energy Industries Incorporated for use of a Pinnacle Plus pulsed power supply for thin film growth. All authors thank Art Safriet for his assistance in development and fabrication of equipment used in this work.