Introduction
Flow disruption of stratigraphic continuity in ice cores is a serious concern for paleoclimatic reconstructions (Reference Grootes, Stuiver, White, Johnsen and JouzelGrootes and others, 1993; Reference TaylorTaylor and others, 1993). Duplicate cores allow identification of such disturbances, but are quite expensive and time-consuming to collect and process. Analyses of trapped gases can reveal disturbances (e.g. Reference BenderBender and others, 1994), as can physical studies of the ice (e.g. Reference Alley, Gow, Johnsen, Kipfstuhl, Meese and ThorsteinssonAlley and others, 1995; Reference Thorsteinsson, Kipfstuhl and MillerThorsteinsson and others, 1997). Such disturbances may be evident in characteristics of grains (size, shape, c axis fabric), of solid inclusions (folding of cloudy or dusty layers) or of bubbles (folding of elongated bubbles or of unusual concentrations of bubbles) (e.g. Reference Hudleston, Saxena and BhattacharjiHudleston, 1977; Reference Hooke and HudlestonHooke and Hudleston, 1978; Reference Alley, Gow, Meese, Fitzpatrick, Waddington and BolzanAlley and others, 1997).
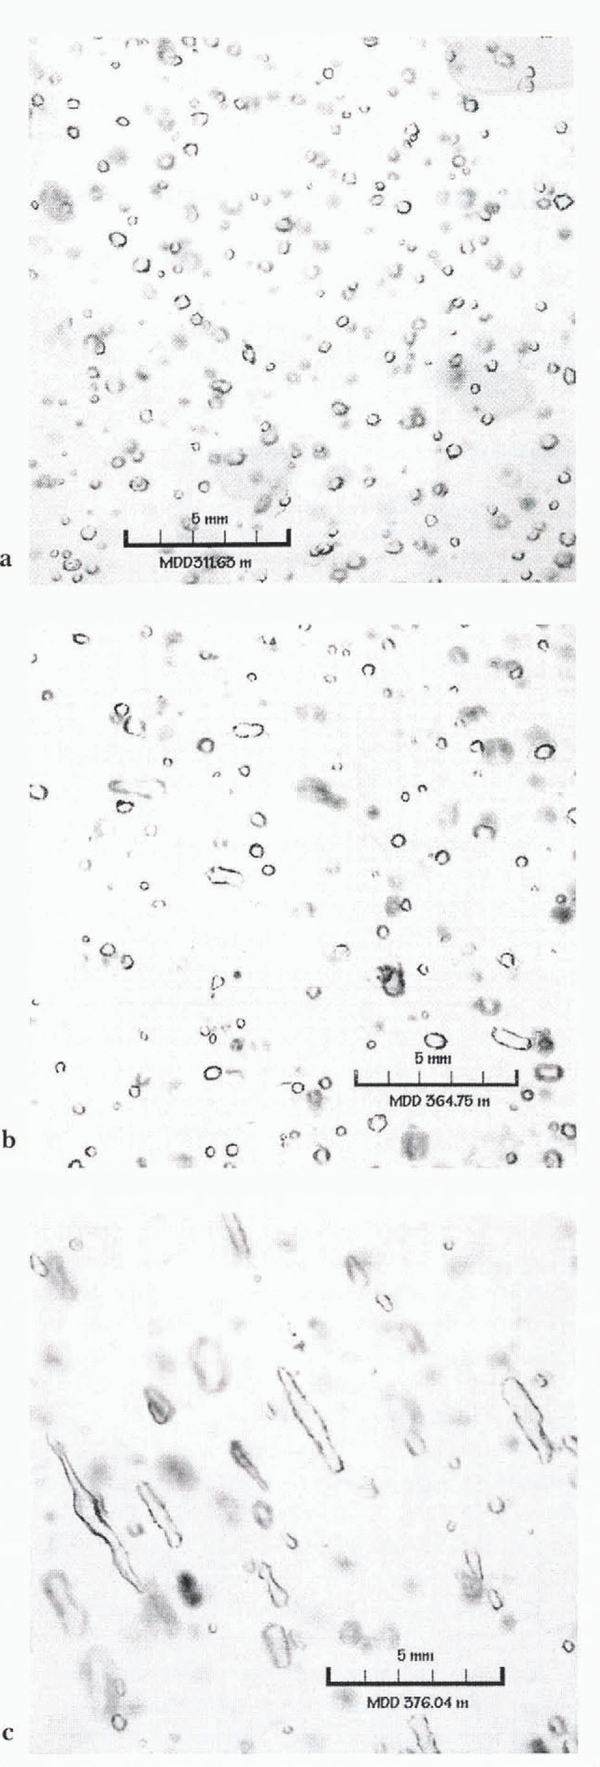
Highly elongated bubbles are frequently observed in highly deformed ice (e.g. Reference Kamb, H. C., Borg, Carter and RaleighKamb, 1972; Reference Hudleston, Saxena and BhattacharjiHudleston, 1977; Reference Hooke and HudlestonHooke and Hudleston, 1978; Nakawo, 1979). Here, we focus on the occurrence of highly elongated bubbles in non-temperate ice-sheet ice. Such elongated bubbles have been found in some cores (e.g. Reference Russell-Head and BuddRussell-Head and Budd, 1979; Reference Alley and BentleyAlley and Bentley, 1988; Fitzpatrick, 1991; Reference Voigt, Alley, Spencer and CreytsVoigt and others, 1997), but other parts of those cores and many other cores lacked strongly elongated bubbles (Fig. 1). We estimate the conditions under which bubbles may become significantly elongated, and whether this provides any clues to stratigraphic disturbance. Our conclusion, that significant elongation is achieved at a strain-rate threshold without any “odd” deformation, should be somewhat reassuring to ice-core stratigraphers. However, increased local strain associated with “odd” deformation may make elongation of bubbles more likely.
Approach
The basic problem is outlined, and a sketch solution given, by Reference Hooke and HudlestonHooke and Hudleston (1978). Ice deformation causes bubbles in the ice to deform somewhat more rapidly than the bulk sample. Diffusional processes tend to restore non-spherical bubbles toward spherical, with the rate of restoration increasing with the deviation front spherical. The balance between deformational and diffusive processes over bubble history will determine bow elongated a bubble becomes.
To make this more quantitative, we follow the standard approach for model development in sintering theory (e.g. Reference KuczynskiKuczynski, 1949; Reference Hobbs and MasonHobbs and Mason, 1964; Reference Maeno and EbinumaMaeno and Ebinuma, 1983; Reference WilkinsonWilkinson, 1988). One first identifies the many processes that are likely to contribute to observed material changes. Next, geometric simplifications are made so that a rate equation can be written in closed form for each of these processes. Using standard material parameters and physical constants, the rate equations are then evaluated to identify those processes that contribute significantly, the functional dependence of the material changes on controlling variables, and the approximate rates of material changes.
Errors in this approach arise from the geometric simplifications, and from assumptions about the active processes. The geometric simplifications typically are accurate to much better than an order of magnitude. Errors in other assumptions are difficult to assess. If, for example, one assumes that the equilibrium vapor pressure over glacier ice is equal to that obtained in laboratory experiments with ice grown from highly purified water, one implicitly assumes that impurity effects are insignificant. Because we know so little about the distribution of impurities in ice, this assumption is not easily tested. And because of the geometric simplifications used, one cannot tell whether deviations between model and observed behavior are linked to errors in geometric or other assumptions.
Experience with these techniques shows nonetheless that they are quite useful, and are a logical first step in understanding active processes (e.g. Reference Maeno and EbinumaMaeno and Ebinuma, 1983; Reference WilkinsonWilkinson, 1988). Analogy might be drawn with the Nye–Kamb generalization of the Weertman sliding theory (Reference WeertmanWeertman, 1957; Reference NyeNye, 1969; Reference KambKamb, 1970). The original geometry assumed by Weertman for the glacier bed was obviously not accurate, but the subsequent generalizations found the same functional dependence on controlling variables and only required adjustment of geometric constants (Reference PatersonPaterson, 1994, ch. 7).
Photographs of bubbles in thick sections from the Taylor Dome, Antarctica, ice core (Reference FitzpatrickFitzpatrick, 1994). Depths and scale are indicated. The transition from nearly spherical bubbles (a), to somewhat elongated bubbles (b), to highly elongated bubbles (c) is striking. Statistical analysis of the bubble populations, and interpretation in terms of the model developed here and other data, is ongoing.

Model
A bubble in ice is assumed to begin as a sphere. Deformation of the ice matrix causes deformation of the bubble. Because the bubble does not transmit deviatoric stresses, near-bubble stresses are perturbed from far-field values, and bubble deformation is not a passive indicator of strain. However, the bubble strain rate is expected to be related to the mean ice strain rate. Once the bubble becomes elongated, curvature and surface tension cause diffusive fluxes that tend to minimize the surface energy by returning the bubble to a spherical shape. The diffusive “strain rate” can be calculated, and compared to the deformational strain rate. If the diffusive strain rate balances the deformational strain rate for bubbles only slightly deformed from a sphere, then one would not observe significantly elongated bubbles. However, if the diffusive strain rate is relatively small, highly elongated bubbles will develop.
Bubble deformation
Proper treatment of bubble deformation is likely to prove quite difficult. We take the simplest possible approach, and use a published solution (Reference GayGay, 1968) for elongation of linear-viscous inclusions (bubbles) in a linear-viscous matrix. Probable implications of this assumption are treated in the Discussion section below.
Reference GayGay (1968) showed that for sparse inclusions, and taking the limit of the inclusion viscosity approaching zero, initially spherical inclusions in a uniaxially extensional stress state deform into prolate spheroids with an instantaneous strain rate equal to 5/3 of the bulk strain rate. Gay (1968, appendix) showed further that for irrotational general strains, the instantaneous strain rate of the low-viscosity inclusion is 5/3 of the bulk strain rate. For highly elongated bubbles, Reference SmithSmith (1975) suggested that the factor 5/3 drops towards 1; given the other geometrical uncertainties in our subsequent treatment, this change is not large.
If a bubble elongated in some direction is subjected to uniaxial extension in a different direction, Reference GayGay (1968) argued that a numerical solution is required. The result is that the bubble rotates so that the direction of greatest bubble elongation approaches the bulk elongation direction, and the elongation rate approaches 5/3 of the bulk strain rate (Reference GayGay, 1968).
This solution allows consideration of simple shear, which is pure shear (extension in one direction, compression normal to it, with neutral deformation normal to the plane of the extension and compression) combined with a rigid-body rotation in the extension–compression plane. An initially spherical inclusion is not affected by the rotation until it becomes elongated. Elongation then is initially at 45° to the shear plane, followed by continued elongation and rotation toward the shear plane. For small strains (less than a factor of a few), the inclusions will remain at an angle to the shear plane; with increasingly large strains, the long axes will approach the shear plane. Elongation is calculated numerically (Reference GayGay, 1968), but scales roughly with the same 5/3 factor as previously.
Based on these results, we approximate bubble strain rates as simply being 5/3 the ice strain rate. The direction of greatest bubble elongation is taken to be the same as the direction of most rapid bulk elongation for irrotational deformations, and to approach the shear plane in simple shear.
Diffusion in non-spherical bubbles
We treat a bubble as a prolate spheroid with longer semi-axis a along the x axis and shorter semi-axes b along the y and z axes (Fig. 2). The bubble volume is

where r is the radius of the spherical bubble with equivalent volume.
Coordinate system used. A prolate spheroid has major semi-axis a along the x axis and minor semi-axes b along the y and z axes.

Owing to curvature and surface tension, diffusion will tend to return the bubble to spherical. With reference to Figure 2, the concentration of vacancies in the ice, C vy, will be higher, and the concentration of vapor molecules in air, C a, will be lower, near (x, y, z) = (a, 0, 0) than near the bubble surface near x = 0. (The notation would be different, but would reach the same results, if we made the probably more accurate assumption that diffusion in ice is by interstitials rather than vacancies; Reference Hondoh, Azuma and HigashiHondoh and others, 1987.) From the usual Kelvin relation (e.g. Reference Hobbs and MasonHobbs and Mason, 1964; one obtains

for ΔC = C x=a – C x=0 , where Ω is the molecular volume, k is Boltzmann’s constant, T is absolute temperature, ρ v and C vyo are the equilibrium vapor density and the equilibrium vacancy concentration over a planar surface, respectively, ρ i is the density of ice, and γ is the ice–air surface tension. The curvature term, κ, is the difference between the sums of the inverses of the principal radii of curvature of the ice–air surfaces at x = a (both principal radii b 2/a) and x = 0 (principal radii a 2/b and b). Equations (2) were calculated assuming that the curvature causes only small concentration deviations from equilibrium with a planar surface; this appears accurate for curvatures typical of natural ice.
We next make geometric approximations: (i) diffusion distance = a/2; and for A, the diffusive cross-sectional area, (ii) A = πb 2 for vapor, (iii) A = 2πbδ s for surface diffusion, where δ s is the thickness of the disordered surface region, and (iv) A = 2πb 2 for lattice diffusion, assuming most flow occurs through a region of approximate thickness b around the bubble circumference of 2πb. The molecular or vacancy transfer rates, J, for lattice, surface and vapor diffusion, respectively, then are:

Measured self-diffusion coefficients D 1 and D s are obtained from the vacancy diffusion coefficients (shown primed in Equation (3)) by

and similarly for D s, with C vyoΩ being the fraction of molecules adjacent to a vacancy and thus capable of moving at any time. This allows us to calculate mass transfer to x = a rather than vacancy transfer from x = a. We also approximate

where the volume transfer JΩ is taken to accrete to area πb 2, t is time, and J s and J 1 are subtracted to give mass-rather than vacancy-transfer rates.
Combining Equations (2)–(5), and dividing by a to obtain a “strain rate”, we obtain

The collection of terms containing diffusivities is the standard result for mass transfer in a diffusive system, obtained by Reference ShewmonShewmon (1964). Substitution of physical constants into this allows one to estimate the relative importance of lattice, surface and vapor diffusion in mass transfer. In this case, using the constants in Table 1, vapor diffusivity for 105 Pa (1 atmosphere), and b = 10-4 m, and setting the vapor-diffusivity term to unity, we obtain lattice:surface: vapor terms of approximately 10-5: 10-5:1 at T = 213 K, 10-4: 10-5:1 at T = 243 K, and 10-4: 10-6:1 at T = 273 K. Compression of bubbles can reduce vapor diffusivity about two orders of magnitude before formation of solid clathrate–hydrate inclusions (e.g. Reference Gow and WilliamsonGow and Williamson, 1976; Reference Shoji and LangwayShoji and Langway, 1987). Thus, vapor diffusion dominates in all cases here, cf. Reference Whillans and GrootesWhillans and Grootes, 1985).
We note that as temperatures approach the melting point, activation energies may change, so care is required in applying these results to warm ice (significantly warmer than –10°C, or 263 K). In particular, the thickness of the pseudo-liquid layer contributing to enhanced diffusion along the ice surface increases with temperature and becomes unbounded as the temperature reaches the bulk melting point (Reference Dash, Fu and WettlauferDash and others, 1995). Also, increased impurity concentration might thicken the pseudo-liquid layer. And very small bubbles may be less than the b = 0.1 mm assumed here. In the calculations above, decreasing vapor diffusivity by two orders of magnitude, and b by one order of magnitude, and increasing the thickness of the disordered surface layer by 2–3 orders of magnitude would allow surface diffusion to be as important as vapor diffusion. We thus consider it possible that in very warm and perhaps impure ice both surface diffusion and vapor diffusion are significant; for other ice, only vapor diffusion appears significant.

Vapor diffusion also dominates neck growth between grains in low-density firn. Reference Hobbs and MasonHobbs and Mason (1964) argued that in neck growth, diffusion is slowed relative to the rate given in their equivalent of Equation (6) because of the effects of latent-heat deposition. If the site of condensation is warmed by the latent heat, its vapor pressure will be raised, reducing the gradient causing diffusion and so the diffusion rate. In the case of bubbles, however, we can show that the latent heat is not significant because of heat conduction through the surrounding ice. (In comparison to bubbles, a narrow neck between spherical ice grains has greater insulation by air combined with stronger curvature differences between source and sink, causing latent-heat effects to be larger.)
We approximate the equilibrium vapor pressure as an exponential in temperature with activation energy Q v, following Whillans and Grootes (1985; see Table 1). If the latent-heat flow produces a small temperature deviation ΔT from the temperature T, a Taylor expansion for the vapor pressure yields

Using the perfect gas law, this reduces the concern ration difference of Equation (2) by

where m is the mass of a water molecule.
We estimate ΔT from the heat flow H deposited by the diffusive vapor transfer,

where L is the volumetric latent heat. Heat flow can occur through the vapor, along the surface or through the lattice from bubble-surface regions where condensation dominates to where sublimation dominates. The small volume of disordered ice–air surface, and the small thermal conductivity of air (roughly two orders of magnitude lower than for ice; Reference Whillans and GrootesWhillans and Grootes, 1985) cause the heat flow to occur primarily through the ice lattice. Setting the temperature gradient over distance a and through cross-sectional area 2πb 2 proportional to the heat flow and conductivity (Fourier’s law) yields

Substituting Equation (10) into Equation (8), subtracting this from Equation (2) assuming that only vapor diffusion is significant, and then solving for the strain rate restoring a bubble toward spherical yields a more accurate version of Equation (6):

Using values from Table 1 for T = 243 K, we find that this differs from the no-latent-heat case by less than 0.1%. Bubble compression will reduce D v, and hence the effect of the latent heat. We thus ignore latent-heat effects in further calculations and use Equation (6) with vapor diffusion only.
Pore close-off to form bubbles occurs at near-surface air pressure P s which may differ from the nominal air pressure P a = 105 Pa for which vapor diffusivity is tabulated. Subsequent compression of bubbles from initial radius r 0 to some equivalent radius r also affects diffusivity. To good approximation, vapor diffusivity is inversely proportional to the air pressure in a bubble owing to its effect on the mean free path of diffusing water molecules (e.g. Reference Whillans and GrootesWhillans and Grootes, 1985). For simplicity, we rewrite Equation (6), using the perfect gas law to eliminate the vapor density and using this inverse dependence of vapor diffusivity on air pressure in a bubble, to obtain

Site conditions affect the vapor diffusivity D va and equilibrium vapor pressure P vo through temperature T, and also affect P a/P s, r 0, and r. These and material constants (Table 1) allow calculation of the diffusive strain rate returning bubbles towards spherical. Differentiation of Equation (12) with respect to a shows that for specified r, the diffusive strain rate is a monotonically increasing function of a and so of bubble elongation.
For nearly spherical bubbles, we can approximate a = r(1 + ε) and b = r(l – ε/2), with ε small. Substituting these into the geometric terms in Equation (12) and assuming that all terms of order ε 2 are insignificant yields

The diffusive strain rate of nearly spherical bubbles thus increases linearly with the bubble elongation.
Without assuming small elongation, we can use Equation (1) to replace b in Equation (12) to obtain


using the values in Table 1. For significant elongation (a ≫ r), the terms involving r/a are insignificant, and the diffusive strain rate is independent of geometry. For smaller elongation, the diffusive strain rate does depend on bubble shape through r/a, but not directly on the equivalent bubble radius r.
We thus reach the simple result that for typical conditions in cold ice, the diffusive strain rate restoring elongated bubbles toward spherical depends on the initial bubble size (large bubbles become elongated more easily; Reference Hooke and HudlestonHooke and Hudleston, 1978; Reference Nakawo and WakahamaNakawo and Wakahama, 1981), but is independent of compression of those initial bubbles because of compensating effects of compression on vapor diffusion and on geometric factors. The diffusive restoration increases linearly with elongation initially, but approaches a constant value for large elongations.
Sensitivity of the diffusive strain rate to initial bubble size, bubble elongation, temperature and surface air pressure is shown in Figure 3. For comparison, the bulk vertical strain rate in central Greenland (GISP2) where bubbles are nearly spherical, with an accumulation rate of just less than 0.3 m a-1 and an ice thickness of about 3000 m, is about 0.3/3000 = 10-4 a-1. A typical Siple Coast (West Antarctica) ice stream increases in velocity by a few hundred m a-1 in a few hundred km along flow, giving a longitudinal stretching rate of 10-3 a-1, which is sufficient to develop elongated bubbles.
Discussion of Assumptions
We made several assumptions in this derivation, related to material properties, geometric approximations, etc. The effect of these is certainly to east doubts on the exact numerical values for bubble behavior. However, we trust the functional forms.
Most experiments and field analyses indicate that ice is not a linear-viscous material at high stresses and strain rates, but exhibits a strain rate proportional to the cube of the stress (e.g. Reference PatersonPaterson, 1994). We used a linear-viscous solution for the simple reason that it exists; we could not find an analytical solution for power-law deformation, and we did not wish to use numerical approximations.
Restoring strain rate from vapor diffusion, per year, as a function of bubble elongation a/r, temperature, the ratio of site vapor diffusivity to sea-level diffusivity for a given temperature (taken as the inverse of the site pressure in bars), and the initial bubble radius. For each parameter, the arrow shows the value used in calculations for which other parameters are varied (a/r = 1.5; T = –30° C; = Ps = 2/3 bar; r = 1 mm).

It is almost certain that the strain rate for bubble elongation increases monotonically with the strain rate for bulk deformation, that bubbles elongate somewhat more rapidly than the bulk ice around them, and that any accurate solution for the bubble deformation will be qualitatively similar to the one used here. We also note that, given the ability of a bubble surface to serve as a sink for dislocations and perhaps also as a source (e.g. Reference Duval and L.Duval and Lliboutry, 1985), we cannot with confidence assume that the ice theology in the region very close to the bubble is identical to that in the bulk. Furthermore, one set of experiments on rapid laboratory elongation of bubbles found that the viscous model matched observations rather closely (Reference Nakawo and WakahamaNakawo and Wakahama, 1981). We thus believe that it is acceptable to use a linear-viscous approximation, although a power-law rheology should be explored in the future.
We assumed that bubbles are sparse so that the bubble-induced perturbations of the stress field do not overlap or interact. Air content, initially approximately 10% by volume at pore close-off, is reduced to typically <1% within a few tens of meters of depth increase in an ice sheet as the bubble pressure rises to the ice-overburden pressure (Reference GowGow, 1975). Reference GayGay (1968) estimated that for inclusions occupying 10% by volume of a material, the bulk viscosity is perturbed from the zero-inclusion state by only about 10–20%. Creep experiments of ice support this result, with as much as about 10% air by volume having little effect on bulk flow of the ice (e.g. Reference HookeHooke, 1981).
As noted in the Introduction, the obvious inaccuracies associated with use of geometric approximations usually prove to be inconsequential in assessing magnitudes, controlling variables, etc., although they certainly affect detailed calculations. We believe that physical uncertainties, related to such factors as the zone of enhanced diffusivity near bubbles in response to pseudo-liquid layers or regions of changed dislocation density, or to anisotropy in surface tension and its dependence on temperature and impurity-loadings, are more important.
We treated ice deformation as a homogeneous process, which it certainly is not. Ice deforms primarily by glide on the basal plane (e.g. Reference Budd and JackaBudd and Jacka, 1989), and to the extent that neighboring grains have differently oriented basal planes, bubbles in adjacent grains will be deformed in different ways. Where bubbles cross from one grain to another, there should be some tendency of the differently oriented glide planes to cause bubbles to bend or even to split (such behavior may be evident in Figure 1c). Groups of bubbles may deviate in orientation from neighboring groups of bubbles in response to organized deformation across many grains (Reference Alley, Gow, Meese, Fitzpatrick, Waddington and BolzanAlley and others, 1997), grains that include many bubbles, or similarly large regions formed by grain growth even if subdivided by polygonization into multiple grains with similar orientations. This may explain the observations of Reference Voigt, Alley, Spencer and CreytsVoigt and others (1997) in a core from Upstream C on the Siple Coast.
Implications
The simple, and intuitively obvious, result of our analyses is that high strain rates of ice cause bubbles to become significantly elongated, but low ice strain rates allow diffusive processes to maintain nearly spherical bubbles. Bubble elongation is favored by high surface air pressure (low elevation), large initial bubble sizes, rapid ice deformation and low temperatures.
Diffusional restoration of nearly spherical bubbles increases linearly with elongation, but with increasing elongation the diffusive restoration asymptotically approaches a maximum rate independent of the elongation. Bubbles subjected to bulk strain causing elongation at less than this maximum restoration rate will reach a steady form under steady conditions; however, bulk strain faster than this will cause continuing elongation. We speculate that sufficient elongation would allow splitting of bubbles, owing to the differing deformation in neighboring grains or subgrains, to the effects of only some of the many possible slip planes being active in grains, or to other “accidents” of deformation in real ice.
For specified bulk strain rate of ice, lower temperature favors bubble elongation by lowering the vapor pressure, with an activation energy of approximately 51 kJ mol-1. (The very weak additional dependence on T in Equation (15) has little effect.) For typical ice-sheet temperatures, a 7°C cooling roughly halves the diffusive strain rate restoring a bubble to spherical. Note, however, that for specified stress, lower temperature reduces the strain rate elongating bubbles, with a larger activation energy of about 60 kJ mol-1 (Reference Weertman, Whalley, Jones and GoldWeertman, 1973). This means that lower temperatures weakly favor spherical bubbles under constant stress: a temperature change of approximately 40°C is required for a two-fold change in the ratio of the elongation and diffusive-restoration strain rates.
The dependence on initial bubble volume is interesting. From Gow (1968a), one expects that about one bubble forms for each grain at pore close-off. Pore close-off occurs at about 10% air by volume, with much less variation than in grain-size, so bubble size (or number density) is primarily controlled by grain-size at pore close-off. This in turn depends on the relative rates of grain growth and firn densification. We are working on a time-dependent, coupled, grain-growth/firn-densification model, but we present some qualitative considerations here.
Firn densification involves a stabilizing feedback that causes differences between depth–density profiles at different sites to be small. For example, an increase in temperature causes faster densification. However, faster densification causes a given density to be reached with a lower load. Because densification rate increases with load as well as with temperature, the lower load provides a negative feedback, and densification is not accelerated as much as one would expect from the temperature increase and an appropriate activation energy. Assuming a similar activation energy for grain growth and firn densification (Reference GowGow, 1975; Reference AlleyAlley, 1987), warming would then be expected to increase grain-size, hence bubble size, hence likelihood of bubble elongation.
Countering this, an accumulation-rate increase would decrease the time required for transformation of snow to ice, and thus the grain-size, bubble size and degree of bubble elongation. Relative magnitudes can be compared using “Gow’s rule” (Reference GowGow, 1968b), in which the effect on a depth–density profile of a 4°C temperature increase is approximately offset by a doubling of accumulation rate. At a site subjected to a 4°C warming and an accumulation-rate doubling, grain-growth rate would increase about 40% (Reference GowGow, 1975), but the time for grain growth before pore close-off would be halved, producing smaller grains at pore close-off, smaller bubbles and less likelihood of bubble elongation. We are studying these considerations relative to the bubble elongation observed in the Taylor Dome, Antarctica, ice core and illustrated in Figure 1. We also note that if these considerations are accurate, initial bubble size should be controlled by accumulation and temperature at a site. Bubble size (or number density) in ice cores thus might be used to check proposed temperature and accumulation-rate histories reconstructed from other ice-core data.
The dependence of diffusion on the initial bubble size in our model may have implications for bubbles that split owing to inhomogeneous deformation during extreme elongation. Splitting of a bubble is equivalent to reducing the initial bubble size, because splitting decreases the diffusion distance without affecting the vapor diffusivity. Depending on the relation between the maximum diffusive strain rate and the imposed strain rate, splitting of a bubble may allow neither or one part or both parts to return to nearly spherical forms. A small bubble formed by uneven splitting of a large one would be especially likely to return to a nearly spherical shape.
Conclusions
Bubbles are elongated by strain in ice, but returned towards spherical by diffusive processes. Strongly elongated bubbles will develop when the elongating strain rate exceeds the restoring strain rate. The elongating strain rate of bubbles will typically be slightly faster than the bulk ice strain rate (by a factor of about 5/3) but will be directly related to the ice strain rate (Reference GayGay, 1968).
Using simple geometrical arguments and generally accepted material constants, we estimate that diffusion restores an elongated bubble towards spherical primarily through vapor diffusion with latent-heat effects insignificant, but that surface diffusion may be significant in especially warm or impure ice. Where vapor diffusion is dominant, the restoring strain rate increases with temperature. bubble elongation, the inverse of atmospheric pressure at pore close-off, and the inverse of bubble volume at pore close-off, but is independent of bubble compression after formation. If surface diffusion is important, then bubble compression increases the restoring strain rate.
Bubble elongation will reach a steady state in which the long axis is less than twice the equivalent-sphere radius, provided the ice strain rate is smaller than some critical value that can be estimated from the equations here. For higher ice strain rate, bubble elongation will increase monotonically over time. Exceptionally elongated bubbles may split owing to “accidents” of ice deformation. Bubble splitting makes it more likely that the smaller bubbles produced will be able to maintain a nearly spherical form; small bubbles split off the ends of larger ones are likely to return to nearly spherical while the larger ones become more elongated.
In non-basal ice of ice sheets, highly elongated bubbles are favored by high strain rate at low temperature (hence high deviatoric stress), by low surface elevation, and by large bubbles at pore close-off. Large bubbles in turn are favored by large grains at pore close-off, and thus by conditions that speed grain growth relative to densification. The mere presence of elongated bubbles provides no information on possible flow disturbances that would perturb stratigraphic continuity in ice cores; it only shows that deformation is rapid compared to diffusive restoration. In addition, because of local perturbations to ice flow caused by the anisotropy of ice crystals, elongated bubbles with varying orientations in an ice core are possible without stratigraphic disturbances at paleoclimatically significant scales.
Acknowledgements
We thank K. Cuffey, L. Wilen, A. T. Anderson, Jr, two anonymous reviewers and other colleagues for helpful discussions and suggestions. This research was supported in part by the U.S. National Science Foundation.