

Semantic context exerts a powerful influence on the ease of lexical access (Meyer & Schvaneveldt, Reference Meyer and Schvaneveldt1971). During speech production, words are accessed in the context of other words that have just been heard, read, or spoken (Levelt, Roelofs, & Meyer, Reference Levelt, Roelofs and Meyer1999). Children's success in retrieving context-appropriate words seems to be strongly influenced by the depth of their semantic knowledge (McGregor, Friedman, Reilly, & Newman, Reference McGregor, Friedman, Reilly and Newman2002; McGregor, Newman, Reilly, & Capone, Reference McGregor, Newman, Reilly and Capone2002), and recently researchers (Jerger, Martin, & Damian, Reference Jerger, Martin and Damian2002; Seiger-Gardner & Schwartz, Reference Seiger-Gardner and Schwartz2008) have begun to focus on how context might differentially impact spoken word production in children with varying language abilities. From early on in childhood, two distinct types of semantic relationships emerge that influence the organization of the developing lexicon: thematic (associative) relationships (e.g., dog-bone, green-grass) and taxonomic (superordinate, coordinate, subordinate) relationships (e.g., dog-animal, dog-monkey, dog-beagle; Bauer & Mandler, Reference Bauer and Mandler1989; Dunham & Dunham, Reference Dunham and Dunham1995; Fenson, Vella, & Kennedy, Reference Fenson, Vella and Kennedy1989; Markman & Hutchinson, Reference Markman and Hutchinson1984; Nelson, Reference Nelson1977; Waxman & Namy, Reference Waxman and Namy1997). Despite the interest in how semantic context impacts spoken word production in children (Jerger et al., Reference Jerger, Martin and Damian2002; Seiger-Gardner & Schwartz, Reference Seiger-Gardner and Schwartz2008), the differential impact of thematic and taxonomic relationships on word retrieval has yet to be explored. Our research examines how thematic and taxonomic relationships influence the time course of lexical access in speech production in children with and without language impairments.
LEXICAL–SEMANTIC DEFICITS IN CHILDREN WITH LANGUAGE IMPAIRMENTS
Children with specific language impairment (SLI) exhibit a slower rate of word learning (Leonard, Reference Leonard1998; Rice, Buhr, & Nemeth, Reference Rice, Buhr and Nemeth1990; Windfuhr, Faragher, & Conti-Ramsden, Reference Windfuhr, Faragher and Conti-Ramsden2002) and have less diverse receptive and expressive vocabularies than their peers with typical language development (TLD; Watkins, Kelly, Harbers, & Hollis, Reference Watkins, Kelly, Harbers and Hollis1995). Many children with SLI exhibit word-finding difficulties (German, Reference German1984, Reference German1987; Leonard, Nippold, Kail, & Hale, Reference Leonard, Nippold, Kail and Hale1983; McGregor & Leonard, Reference McGregor and Leonard1989; Nippold, Reference Nippold1992), both in single-word naming tasks as well as in conversational discourse (German & Simon, Reference German and Simon1991). Their language is characterized by repetitions, substitutions, reformulations, pauses, and use of nonspecific words (e.g., stuff, thing; Faust, Dimitrovsky, & Davidi, Reference Faust, Dimitrovsky and Davidi1997; German, Reference German1987; McGregor, Reference McGregor1997; McGregor & Leonard, Reference McGregor and Leonard1989). Children with SLI name pictures more slowly (Lahey & Edwards, Reference Lahey and Edwards1996; Seiger-Gardner & Brooks, Reference Seiger-Gardner and Brooks2008; Seiger-Gardner & Schwartz, Reference Seiger-Gardner and Schwartz2008), and they produce a greater number of semantic errors (Lahey & Edwards, Reference Lahey and Edwards1999; McGregor, Reference McGregor1997). For example, the child might produce a word that encapsulates some features of the picture to be named (e.g., bird for penguin) or a coordinate (e.g., mouse for kangaroo). These errors are thought to be the result of either lexical gaps, in which representations in the mental lexicon are missing, sparse representations, that is, lexical representations lacking semantic or conceptual detail, or retrieval failures (McGregor, Reference McGregor1997; McGregor, Newman, et al. Reference McGregor, Newman, Reilly and Capone2002; Messer & Dockrell, Reference Messer and Dockrell2006).
To examine the organization of their semantic system, McGregor and Waxman (Reference McGregor and Waxman1998) prompted children with word-finding difficulties to retrieve nouns at superordinate, basic, and subordinate levels. Children were shown a picture (e.g., a rose) and asked, for example, Is this a dandelion? (additional probe questions were Is this a tree? or Is this an animal?). Children with word-finding difficulties tended to answer the questions at the appropriate level of the category hierarchy (e.g., No, it's a flower that's red and thorny), but were much less successful in retrieving the correct superordinate or subordinate noun than their typically developing peers. These results suggest an intact hierarchical organization of semantic memory in children with language impairment but less breadth and depth of lexical–semantic knowledge.
Children with word-finding difficulties exhibit semantic difficulties across different tasks, domains (receptive and expressive), and modalities (visual and auditory; McGregor & Windsor, Reference McGregor and Windsor1996; McGregor, Reference McGregor1997). When asked to provide definitions for words, these children produce fewer and less accurate definitions than their typically developing peers (Dockrell, Messer, George, & Ralli, Reference Dockrell, Messer, George and Ralli2003; McGregor, Newman, et al., Reference McGregor, Newman, Reilly and Capone2002). McGregor, Newman, et al. (Reference McGregor, Newman, Reilly and Capone2002), using a drawing and definition task, found a close relationship between children's ability to correctly name objects and their ability to provide appropriate semantic features (McGregor, Newman, et al., Reference McGregor, Newman, Reilly and Capone2002). That is, for objects they could not name, the children were less able to provide appropriate semantic features, such as the object's function, physical attributes, or superordinate category. Hence, McGregor and colleagues concluded that children's limited semantic knowledge directly contributes to their word-finding difficulties.
Seiger-Gardner, Brooks, and Cadavid (Reference Seiger-Gardner, Brooks and Cadavid2007) used a repeated free-association task (Elbers & van Loon-Vervoorn, Reference Elbers, van Loon-Vervoorn, Gillis and De Houwer1998) to explore associative relationships among words in children with SLI. For each of 24 nouns, children were asked over four rounds to state the first word that came to mind. They were explicitly told not to repeat any previous responses to that noun; and if they did repeat a response, they were prompted to provide another answer. The children with SLI produced fewer associates as responses, and they produced more unrelated and perseverative responses (i.e., repeating an answer given in response to a different noun) than their typically developing peers. The group differences tended to become greater with each successive round of the task, which suggests that the developing networks of word association may be relatively impoverished in children with SLI.
Two recent studies (Hennessey, Leitão, & Mucciarone, Reference Hennessey, Leitão and Mucciarone2010; Velez & Schwartz, Reference Velez and Schwartz2010) explored semantic priming effects in children with SLI and reported that they failed to benefit from semantic context to the same extent as their typically developing peers. Hennessey et al. (Reference Hennessey, Leitão and Mucciarone2010) presented prime-target pairs such as medicine-cure and quiet-whisper in a primed verbal repetition task. They found that children with SLI, unlike their peers, were no faster in repeating the target words when they were primed. Velez and Schwartz (Reference Velez and Schwartz2010) used strongly associated prime-target word pairs (e.g., cat-dog, moon-sun) in a word recognition task, which required children to make an animacy judgment about each word. Like Hennessey et al., they obtained significant semantic priming in typically developing children and no effect in children with SLI. Thus, the failure to find a semantic priming effect in children with SLI has been demonstrated in two tasks with different sorts of stimuli.
INFORMATION PROCESSING DEFICITS IN CHILDREN WITH LANGUAGE IMPAIRMENTS
In addition to the proposed semantic deficits in SLI, difficulties in word learning have been linked to more global deficits in information processing. Children with SLI are slower to process spoken language than their typically developing peers, and show generalized slowing across a diverse range of tasks, including nonverbal measures (e.g., Kail, Reference Kail1994; Miller, Kail, Leonard, & Tomblin, Reference Miller, Kail, Leonard and Tomblin2001; Miller et al., Reference Miller, Leonard, Kail, Zhang, Tomblin and Francis2006). Across these studies, children with SLI showed processing speeds that were 14%–33% slower than their typical peers. It is important that, among children with SLI, speed of information processing has been shown to predict individual differences in language assessment test scores over and above the effects of verbal working memory capacity (Leonard et al., Reference Leonard, Ellis Weismer, Miller, Francis, Tomblin and Kail2007). Thus, even though processing speed affects the amount of information that can be maintained in working memory, the construct of generalized slowing in SLI is not reducible to limitations in storage and processing capacity.
Other research suggests that children with SLI have a faster rate of information decay in phonological short-term memory, which adversely impacts lexical development and processing (Gillam, Cowan, & Marler, Reference Gillam, Cowan and Marler1998; McMurray, Samelson, Lee, & Tomblin, Reference McMurray, Samelson, Lee and Tomblin2010). To measure phonological short-term memory capacity, researchers often use a nonword repetition task in which children are instructed to repeat meaningless sequences of speech sounds such as zabble or zitrocaymus (cf. Gathercole, Willis, Baddeley, & Emslie, Reference Gathercole, Willis, Baddeley and Emslie1994). Individual differences among children in vocabulary acquisition have been linked to their accuracy in nonword repetition (Baddeley, Gathercole, & Papagno, Reference Baddeley, Gathercole and Papagno1998; Gathercole, Hitch, Service, & Martin, Reference Gathercole, Hitch, Service and Martin1997). Children with SLI show significant deficits in nonword repetition, especially for nonwords over three syllables in length (Botting & Conti-Ramsden, Reference Botting and Conti-Ramsden2001; Dollaghan & Campbell, Reference Dollaghan and Campbell1998; Ellis Weismer et al., Reference Ellis Weismer, Tomblin, Zhang, Buckwalter, Chynoweth and Jones2000; Munson, Edwards, & Beckman, Reference Munson, Edwards and Beckman2005). Consequently, with a faster decay rate of information in phonological short-term memory, it becomes more difficult for a child with SLI to establish a new lexical entry after brief exposure to a novel word form. Similarly, a faster decay rate might contribute to deficits in spoken word recognition if there is insufficient time for a word form to access its lexical entry (McMurray et al., Reference McMurray, Samelson, Lee and Tomblin2010).
THE PICTURE–WORD INTERFERENCE (PWI) TASK: ADULT STUDIES
A considerable body of research has used the PWI task to explore the effect of semantic context on spoken word production (e.g., Alario, Segui, & Ferrand, Reference Alario, Segui and Ferrand2000; Bajo, Reference Bajo1988; Caramazza & Costa, Reference Caramazza and Costa2000, Reference Caramazza and Costa2001; Cutting & Ferreira, Reference Cutting and Ferreira1999; Damian & Bowers, Reference Damian and Bowers2003; Damian & Martin, Reference Damian and Martin1999; Glaser & Düngelhoff, Reference Glaser and Düngelhoff1984; La Heij, Dirkx, & Kramer, Reference La Heij, Dirkx and Kramer1990; Lupker, Reference Lupker1979; Mahon, Costa, Peterson, Vargas, & Caramazza, Reference Mahon, Costa, Peterson, Vargas and Caramazza2007; Sailor, Brooks, Bruening, Seiger-Gardner, & Guterman, Reference Brooks and MacWhinney2009; Schriefers, Meyer, & Levelt, Reference Schriefers, Meyer and Levelt1990; Starreveld & La Heij, Reference Starreveld and La Heij1996; Underwood, Reference Underwood1976). In the PWI task, participants name a series of pictures paired with interfering words (IWs): in the standard “visual” version of the task, the IWs are superimposed over the pictures, and in the cross-modal “auditory” version, the IWs are presented over headphones. Most studies to date have explored the semantic interference effect that occurs when a coordinate (i.e., a word that is a member of the same superordinate category as the name of the pictured concept, such as the word mouse paired with a picture of a rabbit) slows naming latencies relative to an unrelated IW. The semantic interference effect is observed reliably with either visual or auditory presentation of the IW; coordinate IWs seem to produce maximal interference when the IW occurs slightly before or at the same time as the picture to be named, that is, at stimulus onset asynchronies (SOAs) of −150 or 0. See Levelt et al. (Reference Levelt, Roelofs and Meyer1999) and Abdel Rahman and Melinger (Reference Abdel Rahman and Melinger2009) for reviews of the adult literature.
A much smaller number of PWI studies have explored the effect of an IW that is associatively related to the pictured concept, for example, sleep paired with a picture of a bed (Alario et al., Reference Alario, Segui and Ferrand2000; Lupker, Reference Lupker1979; Mahon et al., Reference Mahon, Costa, Peterson, Vargas and Caramazza2007; Sailor et al., Reference Sailor, Brooks, Bruening, Seiger-Gardner and Guterman2009). These studies used visual presentation of the IWs and have generally observed facilitation (faster latencies) when pictures were paired with associates. Because most studies of the semantic interference effect have failed to control for the degree of association between targets and IWs (e.g., a picture of a dog might be paired with cat, which is both a coordinate and strong associate of the target), Sailor et al. (Reference Sailor, Brooks, Bruening, Seiger-Gardner and Guterman2009) selected coordinate IWs that were not associates of the targets (e.g., monkey paired with a picture of a dog) and associate IWs that were not coordinates of the targets (e.g., bone paired with a dog) and specifically compared the time course of the two semantic effects over SOAs ranging from −450 to +300. Although the time course of associative priming overlapped with coordinate interference, the strongest effect of association occurred at SOAs of −450 and −300, whereas the strongest effect of the coordinates was at SOAs of −150 and 0. This difference in the timing of the associate and coordinate effects matches the previous findings of Alario et al. (Reference Alario, Segui and Ferrand2000), and supports the hypothesis that semantic context might influence more than one stage of picture naming.
DEVELOPMENTAL STUDIES OF PICTURE NAMING USING THE PWI TASK
The PWI task was first adapted for use with children in the 1970s (Rosinski, Golinkoff, & Kukish, Reference Rosinski, Golinkoff and Kukish1975; Rosinski, Reference Rosinski1977). Since then, there have been numerous demonstrations of Stroop-like interference from semantically related IWs presented with pictures to be named (Hanauer & Brooks, Reference Hanauer and Brooks2003, Reference Hanauer and Brooks2005; Jerger et al., Reference Jerger, Martin and Damian2002; Seiger-Gardner & Schwartz, Reference Seiger-Gardner and Schwartz2008). Two of these studies (Jerger et al., Reference Jerger, Martin and Damian2002; Seiger-Gardner & Schwartz, Reference Seiger-Gardner and Schwartz2008) used a cross-modal PWI procedure based on Schriefers et al. (Reference Schriefers, Meyer and Levelt1990) and compared the effects of phonologically related and semantically related IWs. Both Jerger et al. (Reference Jerger, Martin and Damian2002) and Seiger-Gardner and Schwartz (Reference Seiger-Gardner and Schwartz2008) reported semantic interference effects in children when the onset of the IW preceded the onset of the picture that was to be named and phonological priming when the onset of the IW followed the onset of the picture. These results confirm the time course of phonological and semantic activation in lexical access documented in the adult literature (Damian & Martin, Reference Damian and Martin1999; Schriefers et al., Reference Schriefers, Meyer and Levelt1990).
In the present study, we attempt to disentangle the influence of taxonomic and thematic relationships on lexical access in children with SLI, utilizing the approach of Sailor et al. (Reference Sailor, Brooks, Bruening, Seiger-Gardner and Guterman2009): IWs were selected so that their degree of association with the target picture name and their status as coordinates were orthogonal factors. Experiment 1 provides a replication of Sailor et al. with a new set of stimulus materials, and compares the effects of IWs presented in the visual versus auditory modality. Across modalities, we expect to replicate the findings of Sailor et al. (Reference Sailor, Brooks, Bruening, Seiger-Gardner and Guterman2009), with associate IWs producing facilitation (i.e., faster reaction times [RTs]) relative to unrelated IWs and coordinate IWs producing interference (i.e., slower RTs).
In Experiment 2, we proceed to test children with SLI and age-matched children with TLD using auditory presentation of the IWs. As previous research using the PWI task demonstrates a similar time course of lexical access in children and adults (e.g., Brooks & MacWhinney, Reference Brooks and MacWhinney2000; Jerger et al., Reference Jerger, Martin and Damian2002), we expect typically developing children to show patterns of associative priming and coordinate interference similar to the adults in Experiment 1. However, given that children with SLI have smaller vocabularies and impoverished semantic representations relative to their typically developing peers, semantic context is expected to exert less of an effect on lexical access in these children (cf. Hennessey et al., Reference Hennessey, Leitão and Mucciarone2010; Velez & Schwartz, Reference Velez and Schwartz2010). In particular, if children with SLI have fewer associative links within their lexical network (e.g., due to lesser knowledge of how words co-occur in different semantic contexts), they should show less facilitation in speech production when pictures are paired with their associates. Weak associative priming would contribute to the word-finding difficulties experienced by these children.
In addition, we will evaluate children's performance in the PWI task in the context of information processing accounts of SLI. In accordance with the generalized slowing hypothesis (Kail, Reference Kail1994), as task difficulty increases, larger differences in task performance will be observed between children with SLI and their typical peers because the effect of slower processing speed will be magnified in conditions that require more processing. That is, if IWs change the amount of processing required to name a target picture in the PWI task, then slower processing speed should magnify these differences for children with SLI, resulting in greater interference. In contrast, the decay-rate hypothesis (McMurray, Samelson, Lee, & Tomblin, Reference McMurray, Samelson, Lee and Tomblin2010) suggests that children with SLI experience very rapid decay of spoken word forms, which impacts their speech recognition abilities. If children with SLI suffer from faster decay rates of auditory traces then increasing the delay between the IW and the target picture at negative SOAs (i.e., where the IW precedes the picture) should substantially reduce the influence of the IW on target processing for these children relative to their typical peers.
EXPERIMENT 1
Method
Participants
Forty-four young adults were recruited from introductory psychology courses at the College of Staten Island, City University of New York, and received extra credit for their participation. All of the participants were native speakers of English, as determined using a foreign-language background questionnaire. Half of the participants (15 women, 7 men; mean age = 23 years, range = 18–33 years) were assigned to the auditory condition, and half (16 women, 6 men; mean age = 22 years, range = 18–34 years) were assigned to the visual condition.
Materials
The PWI task utilized 24 black-and-white line drawings of common objects as pictures to be named (Cycowicz, Friedman, Rothstein, & Snodgrass, Reference Cycowicz, Friedman, Rothstein and Snodgrass1997). Each target picture was paired with five different auditory IWs: (a) an associate, which is a word that is associated with the pictured concept but is not a member of the same superordinate category (e.g., carrot paired with a picture of a rabbit); (b) an unrelated control for associates, which is one of the associate words paired with an unrelated picture (e.g., carrot paired with a picture of a ring); (c) a coordinate, which is a word that is a member of the same superordinate category as the name of the pictured concept but not associated with it (e.g., mouse paired with a picture of a rabbit); (d) an unrelated control for coordinates, which is one of the coordinate words paired with an unrelated picture (e.g., mouse paired with a picture of a ring); and (e) a neutral baseline condition (i.e., the word good paired with each of the pictures).
The IWs were selected based on established category production norms and word association norms (Nelson, McEvoy, & Schreiber, Reference Nelson, McEvoy and Schreiber2004), and on ratings of semantic similarity made by 50 undergraduate participants. For the associate IWs, the average probability of an IW eliciting the target picture name was 0.50 (SD = 0.23) in the Nelson et al. (Reference Nelson, McEvoy and Schreiber2004) word association norms, whereas for the coordinate IWs, the average probability of an IW eliciting the target picture name was 0.002 (SD = 0.006).
For the auditory condition, the IWs were recorded by a female adult native speaker of English and were digitized and normalized to control for intensity. The auditory IWs ranged in length from 479 to 698 ms (M = 603 ms, SD = 63). IWs were presented to the participants at 70 dB through headphones.
For the visual condition, the IW was printed in 20-point bold uppercase Arial font in maroon to maximize contrast with the black-and-white line drawing. The IW was superimposed over the line drawing and remained in the center of the screen for 300 ms.
A list of the stimulus materials is presented in Appendix A. Four additional pictures (butterfly, car, jar, pickle) were used as practice pictures, in combination with eight additional IWs.
Design
A PWI paradigm was used in which participants were instructed to name the pictures as quickly and accurately as possible while ignoring the IWs (auditory or visual); the presentation of the IWs was manipulated in time relative to the presentation of the pictures, that is, SOA. The experimental design included two within-subject factors of IW condition (associate, unrelated control for associate, coordinate, unrelated control for coordinate, and neutral) and SOA (−300, −150, 0, and +150 ms). The onset of the IWs occurred either before the presentation of the picture (−300 and −150 ms), simultaneous with the presentation of the picture (0 ms), or after the presentation of the picture (+150 ms). The experiment was blocked by SOA, with the order of presentation of the four SOA conditions counterbalanced across subjects. The 120 experimental trials (24 pictures × 5 IW conditions) at each SOA were further divided into six 20-trial lists (i.e., four target pictures were withheld from each list, and each picture occurred in 5 out of 6 lists). This was done to ensure that pictures and IWs were never repeated within a list, and IW conditions were counterbalanced across lists (i.e., there were four trials for each IW condition within each list). Order of presentation of the trials within each list was randomized, as was the order of lists at each SOA.
Procedure
Participants were tested in a single ~45-min session. E-Prime 1.1 software (Schneider, Eschman, & Zuccolotto, Reference Schneider, Eschman and Zuccolotto2002) was used to deliver the experimental task and measure RTs for picture naming. A PC computer with a CRT monitor was used to present the pictures.
The experimental task had three training parts and one test part. First, participants were given practice naming the experimental pictures with no time limit. In the event that a participant used a word other than the target picture name, the examiner corrected the participant and made sure that the participant was familiar with the target name. The examiner instructed the participants to avoid using articles (e.g., “a fork,” or “the cat”) when naming the pictures. Second, the participants were shown the experimental pictures once more, but this time they were instructed to name the pictures as fast as they could. Third, the participants were trained on the PWI paradigm using four practice pictures (coupled with eight IWs). Each picture was presented on the screen, one at a time, and participants were instructed to name the picture as quickly as possible while ignoring the word presented over the headphones (auditory condition) or superimposed over the picture (visual condition). The experimenter emphasized in the instructions to name the picture and not the word. Following this practice, the experimental trials were administered using the same PWI procedure. The participant's response triggered the picture to disappear from the screen, with a pause of 2 s separating one trial from another. During the pause, participants saw a black screen with a fixation cross in the center. At each SOA, experimental trials were presented in 6 lists of 21 items: the first item was always a practice item to ensure attention to the task, followed by 20 experimental items (20 items × 6 lists = 120 trials per SOA). Each picture was presented on the computer screen for a maximum of 4 s. That is, if no answer was produced or the voice key failed to activate, a new trial was initiated after 4 s.
All of the trials were recorded using a digital CD recorder. Any trials where the RT was not registered by the E-Prime program due to voice key error were later analyzed for RT calculation using Sound Forge 7.0 software. This occurred in cases where the participant triggered the voice key prior to giving a response (e.g., by breathing too close to the microphone) or the voice key failed to activate to a response (e.g., due to the participant speaking too quietly, or too far away from the microphone). Direct measurement of RTs was accomplished using a custom-made tone generator coupled with a light detector. The light detector responded to the appearance of the picture on the screen (i.e., each picture was preceded by a black screen) and produced a tone in response to the onset of the picture. The tone generator fed directly into the digital CD recorder and was inaudible to the participant. On a second track, the participant's naming response was recorded. RTs were measured directly by calibrating the time between the onset of the picture (as indicated by the tone on track 1) and the onset of the participant's response (as indicated by the speech waveform on track 2). This procedure drastically minimized the loss of trials and ensured accurate naming latencies.
Data analysis
As the experiments focus on the contrasting effects of associates and coordinates in the PWI task, we conducted repeated-measures analyses of variance (ANOVAs) for each participant group that incorporated planned comparisons at each SOA. Two sets of planned comparisons were conducted with the first comparing the associate IW type with the unrelated control for associate IW type and the second comparing the coordinate IW condition with the unrelated control for coordinate IW type. Participant groups are compared with respect to effect sizes for associative priming and coordinate interference effects.
For the RT analyses, following Hanauer and Brooks (Reference Hanauer and Brooks2003), we utilized median RTs for correct trials as the dependent variable, as opposed to mean RTs, to facilitate comparison with children (Experiment 2) who produce a highly (positively) skewed distribution of RTs in this task. The results for the adults do not change qualitatively if we use mean RTs as the dependent variable. As is conventional in psycholinguistic research, two sets of analyses were conducted, with subjects as the random factor (F1) and with items as the random factor (F2).
For the error analyses, all proportions were arcsine transformed as is the convention for proportional data (Cohen & Cohen, Reference Cohen and Cohen1983).
Results
Auditory condition
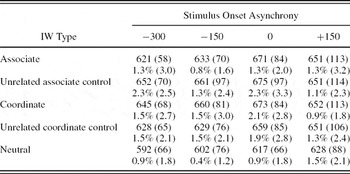
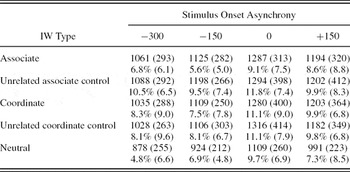
Table 1 presents the mean error rates and the averages of participants’ individual median RTs for each SOA and IW type in the auditory condition.
Median (standard deviation) reaction times (ms) and error rates (%) for adults (N = 22) in the auditory condition of Experiment 1 as a function of stimulus onset asynchrony and interfering word (IW) type

ERRORS
Our adult participants performed the task with a very high level of accuracy, averaging only 1.4% errors across trials. Repeated-measures ANOVA with SOA and IW type as within-subjects variables showed no significant effects.
RTS
The repeated-measures ANOVA conducted on RTs yielded significant main effects of SOA, F1 (3, 63) = 2.85, p = .045, mean square error (MSE) = 7,026, partial η2 = 0.12, F2 (3, 69) = 32.43, p = .0001, MSE = 849, partial η2 = 0.59; and IW type, F1 (4, 84) = 49.69, p = .0001, MSE = 714, partial η2 = 0.70; F2 (4, 92) = 19.65, p = .0001, MSE = 1,498, partial η2 = 0.46, as well as a significant interaction of SOA and IW type, F1 (12, 252) = 4.27, p = .0001, MSE = 448, partial η2 = 0.17; F2 (12, 276) = 3.19, p = .0003, MSE = 863, partial η2 = 0.12.
Planned comparisons showed significantly faster latencies for pictures paired with associate IWs than for pictures paired with unrelated control for associate IWs at SOA −300, F1 (1, 252) = 23.82, p = .0001, MSE = 448, F2 (1, 276) = 9.81, p = .002, MSE = 863; and at SOA −150, F1 (1, 252) = 19.73, p = .0001, MSE = 448, F2 (1, 276) = 8.70, p = .003, MSE = 863. Adults produced significantly slower latencies for pictures paired with a coordinate IW than for pictures paired with an unrelated control for coordinate IW at SOA −300, F1 (1, 252) = 7.42, p < .007, MSE = 448, F2 (1, 276) = 10.04, p = .002, MSE = 863; at SOA −150, F1 (1, 252) = 22.75, p = .0001, MSE = 448, F2 (1, 276) = 6.41, p = .012, MSE = 863; and at SOA 0, F1 (1, 252) = 4.83, p = .029, MSE = 448, F2 (1, 276) < 1, ns.
Visual condition
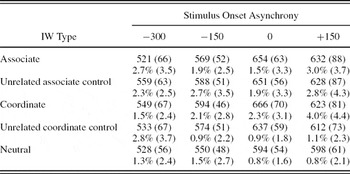
Table 2 presents the mean error rates and the averages of participants’ individual median RTs for each SOA and IW type in the visual condition.
Median (standard deviation) reaction times (ms) and error rates (%) for adults (N = 22) in the visual condition of Experiment 1 as a function of stimulus onset asynchrony and interfering word (IW) type

ERRORS
Adults performed the task with a high level of accuracy, averaging only 1.9% errors across trials. Repeated-measures ANOVA with SOA and IW type as within-subjects variables yielded a significant effect of IW type, F1 (4, 84) = 4.52, p = .002, MSE = 0.045, partial η2 = 0.18, F2 (4, 92) = 4.23, p = .003, MSE = 0.048, partial η2 = 0.16. Comparison of associate and unrelated control for associate IW types showed no significant differences in error rates across SOAs. Comparison of coordinate and unrelated control for coordinate IW types showed higher error rates for pictures paired with coordinate IWs. The effect was marginal at SOA −150, F1 (1, 252) = 2.87, p = .092, MSE = 0.039, F2 (1, 276) = 4.75, p = .030, MSE = 0.035; and SOA 0, F1 (1, 252) = 2.71, p = .101, MSE = 0.039, F2 (1, 276) = 3.65, p = .057, MSE = 0.035; but was reliable at SOA +150, F1 (1, 252) = 11.53, p = .001, MSE = 0.039, F2 (1, 276) = 8.94, p = .003, MSE = 0.035.
RTS
The repeated-measures ANOVA conducted on RTs yielded significant main effects of SOA, F1 (3, 63) = 39.57, p = .0001, partial η2 = 0.65, MSE = 5,811; F2 (3, 69) = 150.61, p = .0001, MSE = 1,700, partial η2 = 0.87, and IW type, F1 (4, 84) = 37.10, p = .0001, MSE = 648, partial η2 = 0.64; F2 (4, 92) = 12.67, p = .0001, MSE = 2,081, partial η2 = 0.36, and a significant interaction of SOA and IW type; F1 (12, 252) = 5.75, p = .0001, MSE = 563, partial η2 = 0.22, F2 (12, 276) = 4.55, p = .0001, MSE = 655, partial η2 = 0.17.
Planned comparisons showed significant faster latencies for pictures paired with an associate IW than for pictures paired with an unrelated control for associate IW at SOA −300, F1 (1, 252) = 29.62, p = .0001, MSE = 563; F2 (1, 276) = 21.35, p = .0001, MSE = 655; and at SOA −150, F1 (1, 252) = 7.29, p = .007, MSE = 563; F2 (1, 276) = 7.40, p = .007, MSE = 655. Adults produced significantly slower latencies for pictures paired with a coordinate IW than for pictures paired with an unrelated control for coordinate IW across SOA conditions: SOA −300, F1 (1, 252) = 4.91, p = .028, MSE = 563, F2 (1, 276) = 6.01, p = .015, MSE = 655; SOA −150, F1 (1, 252) = 7.23, p = .008, MSE = 563; F2 (1, 276) = 3.96, p = .048, MSE = 655; SOA 0, F1 (1, 252) = 16.62, p = .0001, MSE = 563; F2 (1, 276) = 4.60, p = .033, MSE = 655; and SOA +150, F1 (1, 252) = 2.54, p = .112, MSE = 563; F2 (1, 276) = 21.40, p = .0001, MSE = 655.
Comparison of auditory and visual conditions
To compare error rates and RTs across auditory and visual conditions, we conducted additional mixed-design ANOVA with Modality as a between-subjects factor in the ANOVA with subjects as the random factor (F1), and a within-items factor in the ANOVA with items as the random factor (F2). In summarizing these analyses, we do not report main effects and interactions that do not involve Modality, as these are redundant with the results described previously.
ERRORS
The error analyses showed no significant main effect or interactions involving modality.
RTS
The mixed-design ANOVA comparing RTs yielded a main effect of Modality, F1 (1, 42) = 6.24, p = .016, MSE = 86,377, partial η2 = 0.13; F2 (1, 23) = 62.37, p = .0001, MSE = 8,709, partial η2 = 0.73, with participants responding faster overall in the visual condition (593 ms) than in the auditory condition (643 ms). Modality interacted significantly with SOA, F1 (3, 126) = 9.11, p = .0001, partial η2 = 0.18, MSE = 6,419, F2 (3, 69) = 69.03, p = .0001, MSE = 999, partial η2 = 0.75. The effect of SOA was stronger in the visual condition; that is the increase in RTs at SOAs of 0 and +150 was exaggerated in the visual condition relative to the auditory condition. This interaction of modality and SOA is easiest to see in the pattern of RTs for the neutral baseline condition in Tables 1 and 2.
The two-way interaction of IW type and modality was not significant, but there was a significant three-way interaction of SOA, IW type, and modality, F1 (12, 504) = 2.33, p = .007, partial η2 = 0.05, MSE = 505; F2 (12, 276) = 2.41, p = .006, MSE = 774, partial η2 = 0.09. Although the overall time course of associative priming and coordinate interference was similar across modalities, the magnitude of the coordinate interference seemed to peak somewhat later in the visual condition than in the auditory condition.
Discussion
The auditory and visual conditions both yielded an associative priming effect as well as a coordinate interference effect in word retrieval. Across both modalities, the time course of the two semantic effects overlapped. The pattern of results for the visual condition replicated Sailor et al. (Reference Sailor, Brooks, Bruening, Seiger-Gardner and Guterman2009), albeit with a somewhat longer time course for the coordinate interference effect in the present study (significant at an SOA of −300 here, but not in Sailor et al.), and a somewhat shorter time course for the associative priming effect (significant at an SOA of 0 in Sailor et al., but not here). Nonetheless, the overall pattern of results of Sailor et al. (Reference Sailor, Brooks, Bruening, Seiger-Gardner and Guterman2009), which showed an associative priming effect peaking at an earlier SOA than the coordinate interference effect, was replicated in the visual condition, and to a lesser extent, in the auditory condition. These results confirm that two independent semantic context effects influence adult picture naming, and that the two semantic effects have overlapping, but not identical, temporal characteristics.
Note that the SOA manipulation seemed to have a stronger effect overall in the visual condition than in the auditory condition. This is clearly seen in the dramatic increase in RTs for the neutral condition at an SOA of 0 for the visual condition relative to the auditory condition.
EXPERIMENT 2
Given the overall similarity in the results across IW modality conditions, in Experiment 2 we tested children in the auditory condition only. Half of the children tested had a diagnosis of SLI, and half had TLD. Use of auditory IWs allowed us to avoid presentation of written words to children with language impairments who often have co-accompanying reading difficulties. It also allowed us to include children as young as 7 years of age who were still at the early stages of learning to read. Given previous findings of a semantic interference effect in children with SLI (Seiger-Gardner & Schwartz, Reference Seiger-Gardner and Schwartz2008), we expected to find a coordinate interference effect in both groups of children. In contrast, based on evidence of weak semantic priming in children with SLI (Hennessey et al., Reference Hennessey, Leitão and Mucciarone2010; Velez & Schwartz, Reference Velez and Schwartz2010), we anticipated that children with TLD, but not children with SLI, would show an associative priming effect.
Method
Participants
Forty-four school-aged children (mean age = 8 years, 11 months [8;11], range = 6;10–11;0) were recruited through advertisements and private schools in New York City. All of the children were monolingual speakers of English. All of the children passed a hearing screening (at 20 dB HL at 500, 1000, 2000, and 4000 Hz) and exhibited nonverbal intelligence within normal limits defined by a score of 85 or above on the Test of Nonverbal Intelligence—Second Edition (TONI-2; Brown, Sherbenou, & Johnson, Reference Brown, Sherbenou and Johnson1997).
Half of the children had a SLI, and the other half had TLD. Each child in the TLD group was age matched with a child in the SLI group ± 4 months. The SLI group (15 boys, 7 girls) ranged in age from 7;1 to 11;0 (M = 8;11), and the TLD group (14 boys, 8 girls) ranged in age from 6;10 to 10;8 (M = 8;11). In the SLI group, the presence of a language impairment was determined using the following criteria: (a) a speech–language pathologist diagnosis of language impairment or the child's enrollment in speech and language therapy, and/or (b) a composite score of 81 or lower (corresponds to 1.3 SD below the mean) on the Clinical Evaluation of Language Fundamentals (CELF 3 or CELF 4; Semel, Wiig, & Secord, Reference Semel, Wiig and Secord1995, Reference Semel, Wiig and Secord2003). All children with SLI, except for four who had been receiving language therapy services for several years, had a failing composite score on the CELF. Two additional children with SLI were tested but dropped from the study: one child because of excessively high error rates on the experimental task (more than 50% of trials were coded as errors or no response) and the other child because of a low nonverbal intelligence score (below 80).
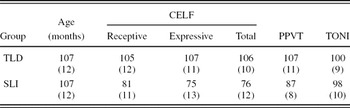
None of the children in the TLD group had any speech impairments, as documented in the parent questionnaire. In addition, they all had age-appropriate lexical comprehension skills defined by a score of 85 or above (SD > −1) on the Peabody Picture Vocabulary Test—Revised (PPVT-R; Dunn & Dunn, Reference Dunn and Dunn1997) and scores of 85 or more on the CELF 3 or CELF 4. The SLI group scored significantly below the TLD groups on all language measures: CELF receptive, F (1, 42) = 50.35, p = .0001, MSE = 133, partial η2 = 0.55; CELF expressive, F (1, 42) = 73.81 p = .0001, MSE = 147, partial η2 = 0.64; CELF total, F (1, 42) = 84.48, p = .0001, MSE = 115, partial η2 = 0.69; and PPVT, F (1, 42) = 47.29, p = .0001, MSE = 89, partial η2 = 0.53. The SLI and TLD groups did not differ in their performance on the TONI, F (1, 42) < 1. A summary of the test results is presented in Table 3.
Mean (standard deviation) standardized scores for assessment tests for children with TLD and SLI in Experiment 2 (n = 22 in each group)

Note: CELF, Clinical Evaluation of Language Fundamentals; PPVT, Peabody Picture Vocabulary Test; TONI, Test of Nonverbal Intelligence; TLD, typical language development; SLI, specific language impairment.
Materials
The materials were identical to Experiment 1.
Design
The design was identical to Experiment 1.
Procedure
Children were tested individually in a quiet room of the developmental language center at the City University of New York. The children attended two 1-hr sessions. The sessions were scheduled approximately 1 week apart. The children's first session was devoted to the speech, language, and hearing evaluation. The remaining session was devoted to the experimental task. The procedure for the experimental task was identical to the auditory condition of Experiment 1.
Results
Children with TLD
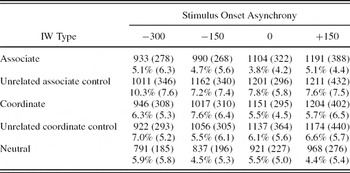
Table 4 presents the mean error rates and the averages of median RTs for each SOA and IW type for children with TLD.
Median (standard deviation) reaction times (ms) and error rates (%) for children with typical language development (N = 22) in Experiment 2 as a function of stimulus onset asynchrony and interfering word (IW) type

ERRORS
Children with TLD were highly successful in performing the task and averaged only 6.1% errors across trials. Repeated-measures ANOVA with SOA and IW type as within-subjects variables yielded a significant effect of IW type, F1 (4, 84) = 6.16, p = .0001, MSE = 0.059, partial η2 = 0.23; F2 (4, 92) = 5.29, p = .001, MSE = 0.087, partial η2 = 0.19. Comparison of associate and unrelated control for associate IW types showed lower error rates for pictures paired with associate IWs. This associative priming effect was statistically significant at SOA −300, F1 (1, 252) = 15.14, p = .0001, MSE = 0.044; F2 (1, 276) = 8.10, p = .005, MSE = 0.059; at SOA −150, F1 (1, 252) = 4.23, p = .041, MSE = 0.044, F2 (1, 276) = 6.30, p = .013, MSE = 0.059, and at SOA 0, F1 (1, 252) = 11.38, p = .001, MSE = 0.044, F2 (1, 276) = 14.06, p = .0002, MSE = 0.059. Comparison of coordinate and unrelated control for coordinate IW types showed no significant differences in error rates.
RTS
The repeated-measures ANOVA conducted on RTs yielded significant main effects of SOA, F1 (3, 63) = 11.45, p = .0001, MSE = 98,551, partial η2 = 0.35, F2 (3, 69) = 112.69, p = .0001, MSE = 10,347, partial η2 = 0.83; and IW type, F1 (4, 84) = 34.26, p = .0001, MSE = 25,502, partial η2 = 0.62; F2 (4, 92) = 20.33, p = .0001, MSE = 38,871, partial η2 = 0.47. The interaction of SOA and IW type was significant only with items as the random factor, F1 (12, 252) = 1.70, p = .066, MSE = 11,477, partial η2 = 0.08; F2 (12, 276) = 2.52, p = .004, MSE = 12,080, partial η2 = 0.10.
Planned comparisons indicated that children were significantly faster at naming pictures paired with an associate IW than pictures paired with an unrelated control for associate IW at SOA −300, F1 (1, 252) = 5.76, p = .017, MSE = 11,477, F2 (1, 276) = 6.22, p = .013, MSE = 12,080; at SOA −150, F1 (1, 252) = 28.42, p = .0001, MSE = 11,477; F2 (1, 276) = 20.62, p = .0001, MSE = 12,080; and at SOA 0, F1 (1, 252) = 8.99, p = .003, MSE = 11,477, F2 (1, 276) = 24.22, p = .0001, MSE = 12,080. There were no reliable differences in RTs for pictures paired with a coordinate IW in comparison to pictures paired with an unrelated control for coordinate IW.
Children with SLI
Table 5 presents the mean error rates and the averages of median RTs for each SOA and IW type for children with SLI.
Median (standard deviation) reaction times (ms) and error rates (%) for children with specific language impairment (N = 22) in Experiment 2 as a function of stimulus onset asynchrony and interfering word (IW) type

ERRORS
The children with SLI were successful in performing the task, averaging 8.8% errors across trials. Repeated-measures ANOVA with SOA and IW type as within-subjects variables yielded a significant effect of SOA, F1 (3, 60) = 2.88, p = .043, MSE = 0.100, partial η2 = 0.12; F2 (3, 69) = 6.52, p = .001, MSE = 0.069, partial η2 = 0.22, and a significant effect of IW type; F1 (4, 84) = 9.86, p = .0001, MSE = 0.042, partial η2 = 0.32, F2 (4, 92) = 2.79, p = .031, MSE = 0.097, partial η2 = 0.11. The effect of SOA, not present in any of the other groups, was due to the significantly higher error rate for the SOA 0 condition (i.e., where the IW onset was simultaneous with the onset of the picture that was to be named) in comparison to the SOA −300, F1 (1, 60) = 6.56, p = .013, MSE = 0.100; F2 (1, 69) = 13.96, p = .0004, MSE = 0.069; and SOA −150 conditions, F1 (1, 60) = 6.26, p = .015, MSE = 0.100; F2 (1, 69) = 14.74, p = .0003, MSE = 0.069. That is, the children with SLI were more vulnerable to the IW when it was timed to coincide with the onset of the picture than when the IW occurred 300 or 150 ms before the picture. No other pairwise comparisons of SOA conditions showed reliably different error rates.
Comparison of associate and unrelated control for associate IW types showed lower error rates for pictures paired with associate IWs. The associative priming effect was statistically reliable at SOAs of −300, F1 (1, 252) = 7.68, p = .006, MSE = .048; F2 (1, 276) = 5.21, p = .023, MSE = 0.065; −150, F1 (1, 252) = 5.71, p = .018, MSE = 0.048; F2 (1, 276) = 5.67, p = .018, MSE = 0.065; and 0, F1 (1, 252) = 4.34, p = .038, MSE = 0.048; F2 (1, 276) = 1.59, p = .209, MSE = 0.065. Comparison of coordinate and unrelated control for coordinate IW types yielded no significant differences in error rates.
RTS
The repeated-measures ANOVA conducted on RTs yielded significant main effects of SOA, F1 (3, 63) = 8.55, p = .0001, MSE = 132,028, partial η2 = 0.29; F2 (3, 69) = 105.58, p = .0001, MSE = 10,347, partial η2 = 0 .82; and IW type, F1 (4, 84) = 16.28, p = .0001, MSE = 41904, partial η2 = 0.44; F2 (4, 92) = 20.80, p = .0001, MSE = 37,958, partial η2 = 0.47. The interaction of SOA and IW type was not significant, F1 and F2 < 1.
Planned comparisons of the associate and unrelated control for associate IW types yielded no significant effects. Only at SOA −150 did the associative priming effect approach statistical significance, F1 (1, 252) = 3.29, p = .071, MSE = 17,756; F2 (1, 276) = 1.47, p = .226, MSE = 14,642. Planned comparisons of the coordinate and unrelated control for coordinate IW types yielded no significant effects, as in the TLD group. These null results for the planned comparisons suggest that the main effect of IW type in the SLI group was due primarily to the faster RTs in the neutral IW condition relative to the other conditions (see Table 5).
Comparison of children with TLD and SLI
To compare error rates and RTs in children with TLD and SLI, we conducted additional mixed-design ANOVA with Language Group as a between-subjects factor in the ANOVA with subjects as the random factor (F1), and a within-items factor in the ANOVA with items as the random factor (F2). In summarizing these analyses, we do not report main effects and interactions that do not involve Language Group, because these are redundant with the results described previously.
ERRORS
Children with TLD produced marginally fewer errors than children with SLI (6.1% vs. 8.8%), F1 (1, 42) = 3.35, p = .074, MSE = 0.834, partial η2 = 0.07; F2 (1, 23) = 15.17, p = .001, MSE = 0.253, partial η2 = 0.40. There was a significant interaction of SOA with Language Group, F1 (3, 126) = 2.79, p = .043, MSE = 0.090, partial η2 = 0.06; F2 (3, 69) = 7.13, p = .0003, MSE = 0.061, partial η2 = 0.24. This interaction was due to an increased error rate at SOA of 0 in the SLI group (described above), which was not present in the TLD group.
RTS
Overall, RTs were only slightly faster for children with TLD (1046 ms) than for children with SLI (1131 ms), F1 (1, 42) = 1.15, p = .289, MSE = 1,358,107, partial η2 = 0.03; F2 (1, 23) = 83.70, p = .0001, MSE = 23,444, partial η2 = 0.78. The only other statistically significant effect involving Language Group was an interaction of Language Group and SOA in the item-based analysis, F1 (3, 126) = 1.82, p = .146, MSE = 115,289, partial η2 = 0.04; F2 (1, 23) = 13.53, p = .0001, MSE = 10,654, partial η2 = 0.37. This interaction is presumably due to the children with SLI showing a somewhat larger RT increase at SOA 0 than the children with TLD (see neutral condition in Tables 4 and 5). The two-way interaction of Language Group and IW type, and the three-way interaction of Language Group, IW type, and SOA were not significant.
Comparison of adults (auditory condition) and children with TLD
To compare adults and children with TLD on the auditory condition, we conducted additional mixed-design ANOVA with Age Group as a between-subjects factor in the ANOVA with subjects as the random factor (F1), and a within-items factor in the ANOVA with items as the random factor (F2). In summarizing these analyses, we do not report main effects and interactions that do not involve Age Group, as these are redundant with the results described previously.
ERRORS
Overall, children with TLD produced significantly more errors than adults (6.1% vs. 1.4%), F1 (1, 42) = 42.88, p = .0001, MSE = 0.410, partial η2 = 0.51; F2 (1, 23) = 46.40, p = .0001, MSE = 0.375, partial η2 = 0.67. No other effects were significant.
RTS
The analysis of RTs yielded a highly significant main effect of Age Group, F1 (1, 42) = 43.71, p = .0001, MSE = 820,587, partial η2 = 0.51; F2 (1, 23) = 1,329.09, p = .0001, MSE = 23,097, partial η2 = 0.98, with children naming pictures more slowly than adults (1046 vs. 643 ms). Age Group interacted significantly with SOA, F1 (3, 126) = 8.51, p = .0001, partial η2 = 0.17, MSE = 52,789; F2 (3, 69) = 81.43, p = .0001, MSE = 5,912, partial η2 = 0.78, with children showing a stronger effect of SOA than adults (see neutral condition in Tables 1 and 4). It is of the most importance that age group also interacted significantly with IW type, F1 (4, 168) = 21.71, p = .0001, partial η2 = 0.34, MSE = 13,108; F2 (4, 92) = 16.19, p = .0001, MSE = 16,424, partial η2 = 0.41, with adults showing both an associative priming effect and a coordinate interference effect, but children showing only the associative priming effect. The three-way interaction of Age Group, SOA, and IW type was marginally significant, F1 (12, 504) = 1.74, p = .055, partial η2 = 0.04, MSE = 5,962; F2 (3, 69) = 2.80, p = .001, MSE = 6,364, partial η2 = 0.11, which reflects that the time course of the associative priming and coordinate interference effects in the adult group did not replicate in the child group.
Z-score comparison
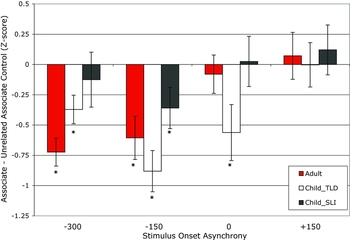
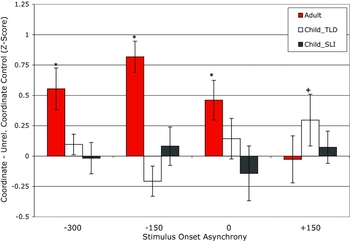
To compare the magnitude of associative and coordinate effects across participants irrespective of individual and group differences in speed of processing (Kail, Reference Kail1991, Reference Kail1992; Miller, Kail, Leonard & Tomblin, Reference Miller, Kail, Leonard and Tomblin2001), we Z transformed each participant's 20 condition means (Faust, Balota, Spieler, & Ferraro, Reference Faust, Balota, Spieler and Ferraro1999). If group differences can be described by a change in information processing rate, using standardized scores to rescale the data will eliminate these differences. Figure 1 shows the associative priming effect for each participant group at each SOA, and Figure 2 shows the coordinate interference effect. Figures 1 and 2 plot the average difference scores calculated for each participant for each comparison. Lower Z scores for the associate IW condition relative to its unrelated control indicate priming; hence, negative difference scores represent associative priming. Higher Z scores for the coordinate IW condition relative to its unrelated control indicate interference; hence, positive difference scores represent coordinate interference.
Associative priming effects for adults (auditory condition), children with typical language development (TLD), and children with specific language impairment (SLI; N = 22 in each group). Standard error bars are shown. [A color version of this figure can be viewed online at http://journals.cambridge.org/aps]

Coordinate interference effects for adults (auditory condition), children with typical language development (TLD), and children with specific language impairment (SLI; N = 22 in each group). Standard error bars are shown. [A color version of this figure can be viewed online at http://journals.cambridge.org/aps]

For each group, we conducted repeated-measures ANOVAs on Z scores (with SOA and IW type as within-subjects factors); these analyses incorporated the planned comparisons for associative priming and coordinate interference at each SOA. The pattern of significant associative priming and coordinate interference effects using Z scores matched the results of the planned comparisons using raw scores with two exceptions: The associate priming effect became statistically significant for the children with SLI at SOA −150, F (1, 252) = 3.89, p = .0495, MSE = 0.36, and the coordinate interference effect became marginally significant for children with TLD at SOA +150, F (1, 252) = 3.71, p = .055, MSE = 0.26. All of the statistically significant planned comparisons are marked by asterisks in Figures 1 and 2.
Next, we used the Z scores to compare the two groups of children, using a mixed-design ANOVA with SOA and IW type as within-subjects factors and Language Group as a between-subjects factor. The only interaction involving Language Group to reach significance was the two-way interaction of IW type and Language Group, F (4, 168) = 2.72, p = .032, MSE = 0.47, partial η2 = 0.06. This interaction suggests that the children with TLD were more sensitive to the semantic relationships between the IWs and target pictures than their peers with SLI. To confirm that the interaction stemmed from a larger associative priming effect in the TLD children, we ran an additional analysis of just the associate IW and unrelated associate control IW conditions. This ANOVA yielded a significant interaction between IW type and Language Group, F (1, 42) = 4.99, p = .031, MSE = 0.60, partial η2 = 0.11, which confirms that the TLD children were more sensitive to the degree of association between the IWs and the names of the pictures. An additional analysis of just the coordinate IW and unrelated coordinate control IW conditions yielded no significant effects involving Language Group; for the interaction of IW type and Language Group, F (1, 42) < 1.
Finally we used the Z scores to compare the children with TLD with the adults, using a mixed-design ANOVA with SOA and IW type as within-subjects and Age Group as a between-subjects factor. All three interactions involving Age Group were significant: the two-way interactions of SOA and Age Group, F (3, 126) = 3.03, p = .032, MSE = 2.50, partial η2 = 0.07; and IW type and Age Group, F (4, 168) = 2.68, p = .033, MSE = 0.38, partial η2 = 0.06; and the three-way interaction of SOA, IW type and Age Group, F (12, 504) = 3.30, p = .0001, MSE = 0.28, partial η2 = 0.07, which confirms the pattern of results observed in the RT analyses described above.
Correlations with assessment test results
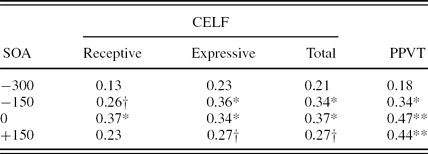
To explore whether language assessment test scores were predictive of individual differences in the size of the associative priming effect among the children, we calculated Pearson correlation coefficients at each SOA. For this analysis, we used the difference scores calculated from each child's Z scores. However, we reverse scored the associative priming effect so that positive values would indicate a larger associative priming effect (i.e., more facilitation). Language assessment tests tended to correlate significantly with the magnitude of the associative priming effect across three of the four SOA conditions: at −150, 0, and +150 (see Table 6 for correlation coefficients). That is, higher language abilities correlated with a greater degree of facilitation from associates. Associative priming effect sizes were unrelated to child sex, age in months, and nonverbal intelligence (TONI scores). We also ran regression analyses using both group (SLI vs. TLD) and language assessment test scores as predictors of the size of the associative priming effect at each SOA. It is important that, despite a high degree of collinearity between group and language assessment scores (all variance inflation factors > 2), Betas were consistently higher for language assessments scores than for the dichotomous group variable. Over and above the effect of group, PPVT scores remained a significant predictor of the size of the associative priming effect at SOA 0, Beta = 0.57, p = .007; and at SOA +150, Beta = 0.84 p = .001. Similarly, over and above the effect of group, CELF expressive and CELF total scores were significant predictors of associative priming at SOA +150 (Beta = 0.58, p = .021 for CELF expressive, and Beta = 0.66, p = .012 for CELF total).
Pearson correlation coefficients between language assessment test scores and the size of the associative priming effect in children (N = 44)
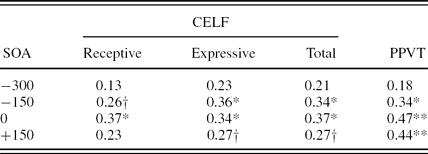
Note: CELF, Clinical Evaluation of Language Fundamentals; PPVT, Peabody Picture Vocabulary Test; SOA, stimulus onset asynchrony.
†p < .10. *p < .05. **p < .01.
Discussion
In Experiment 2, children made fewer errors and named pictures faster when pictures were paired with associate IWs in comparison to unrelated IWs. Associate IWs lowered error rates for both groups of children across most SOA conditions. Children with TLD tended to show a stronger associative priming effect in RTs across SOA conditions than children with SLI. The size of the associative priming effect in RTs correlated with receptive vocabulary size (PPVT scores) and overall expressive and receptive language abilities (CELF scores) in the children.
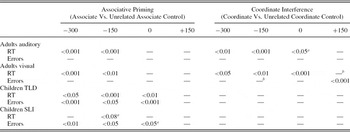
Table 7 provides a summary of the planned comparisons of associative priming and coordinate interference effects across Experiments 1 and 2. The associative priming effect of the children appeared to follow the same general time course as observed in the adults in Experiment 1 but peaked somewhat later. That is, the maximal effect of association on RTs was observed at SOA −300 in the adults (see also Sailor et al., Reference Sailor, Brooks, Bruening, Seiger-Gardner and Guterman2009), whereas the maximal effect for the children was at SOA −150 and extended to SOA 0.
Summary of statistically significant planned comparisons for RTs and errors in Experiments 1 and 2 (n = 22 in each group)

Note: RT, reaction time; TLD, typical language development; SLI, specific language impairment.
aPlanned comparison reliable only by subjects (F1).
bPlanned comparison reliable only by items (F2)
In contrast to the strong facilitative effect of the associate IWs, the coordinate IWs failed to produce reliable interference in the children. That is, the semantic interference effect was weak to nonexistent in the children, with only a trend observed in the typically developing children at the latest SOA (+150). The absence of a statistically reliable coordinate interference effect in both groups of children contrasts with the results from previous cross-modal PWI studies with children (Jerger et al., Reference Jerger, Martin and Damian2002; Seiger-Gardner & Schwartz, Reference Seiger-Gardner and Schwartz2008) in which coordinate IWs were intermixed with phonologically related IWs. Given the similarities in the procedures used across studies (especially the Seiger-Gardner and Schwartz experiment that was conducted in the same laboratory with children from the same population as in our study), one might conclude that the coordinate interference effect in children is highly sensitive to changes in the composition of the stimulus materials, such as the substitution of associate IWs for phonologically related IWs in the stimulus set. We will return to this issue in the General Discussion.
GENERAL DISCUSSION
In two experiments, we set out to explore the differential impact of associative and coordinate relationships on lexical access in speech production. Experiment 1 with adults confirmed the existence of two distinct semantic context effects in the PWI task. In addition to replicating these effects with visual IWs, Experiment 1 demonstrated that auditory IWs yield a very similar pattern of coordinate interference and associative priming. Experiment 2 extended the paradigm to children, half with SLI and half with typical development, using auditory presentation of the IWs. It is surprising that the children failed to show the coordinate interference effect, yet showed significant associative priming, as reflected in faster RTs and fewer errors for pictures paired with their associates.
Individual and group differences in semantic context effects
It is important to note that individual differences in the strength of the semantic context effects in the children were linked to their language abilities. Children with SLI showed substantially less facilitation than their peers when the target pictures were paired with their associates. The weak associative priming in the children with SLI confirms the recent findings of Hennessey et al. (Reference Hennessey, Leitão and Mucciarone2010) and Velez and Schwartz (Reference Velez and Schwartz2010) who failed to detect a semantic priming effect in children with SLI. Individual differences in the depth and strength of lexical semantic knowledge (McGregor, Reference McGregor1997; McGregor, Newman, et al., Reference McGregor, Newman, Reilly and Capone2002) provide an explanation for the relationship between language abilities and the size of the associative priming effect. Children with SLI tend to have less detailed knowledge of how words tend to co-occur with other words across different semantic contexts, that is, they have impoverished lexical knowledge of co-occurrence statistics. Weak associative links within a lexical system containing fewer entries would contribute to the word-finding difficulties that many of these children experience. This interpretation fits the results of the repeated free association task of Seiger-Gardner et al. (Reference Seiger-Gardner, Brooks and Cadavid2007) in which children with SLI produced significantly fewer associates than did their peers in response to nouns. Future studies comparing children with SLI to younger language-matched children would help to clarify the role of lexical knowledge in associative priming.
Alternatively, weaker associative priming might be a consequence of a faster rate of decay of the IWs in the children with SLI. The idea that children with SLI may have faster decay rates for spoken words is supported by recent work on spoken word recognition. McMurray et al. (Reference McMurray, Samelson, Lee and Tomblin2010) monitored eye movements to pictures while participants followed spoken instructions (e.g., Click on the candy). It is crucial that, in some of the trials, one of the alternative pictures in the array was a member of the same phonological cohort as the target (e.g., a candle). Adolescents with SLI experienced a greater degree of competition from the cohort competitor over a longer interval than their peers; that is, they looked more often at the candle and continued to make eye movements to the candle even after the point of disambiguation of the target (i.e., the offset of candy). McMurray et al. (Reference McMurray, Samelson, Lee and Tomblin2010) used these data to evaluate a variety of computational models (varying parameters such as processing speed, vocabulary size, quality of sensory and phonological representations) and found that increasing the decay rate for the auditory trace led to the best-fitting model of their data.
Under the faster-decay rate hypothesis, in the PWI task children with SLI would be predicted to show weaker effects of the IWs at the earlier SOAs (−300 and −150) than at the later SOAs (0 and +150) because more time would have elapsed between presentation of the IW and the picture to be named. However, two aspects of our data are inconsistent with this hypothesis. First, children with SLI showed significant associative priming effects with respect to error rates at the first three SOAs, but not at the last SOA. Second, given that neutral IWs (i.e., repeating the same word good) produce less interference than other IWs, one would expect less of a difference in RTs for the neutral IW condition versus the other IW conditions in children with SLI. That is, if the activation of lexical information for the IW decays rapidly, one would not expect the trials with neutral IWs to be substantially faster than the other IW conditions. Our results do not support this prediction as children with SLI showed substantially faster RTs in naming pictures paired with the neutral IW across all four SOA conditions (see Table 5). RTs were consistently faster for the neutral IW conditions irrespective of the timing of the IW; that is, in analyses of the RTs of children with SLI, the interaction of SOA and IW type did not approach statistical significance, F (12, 252) < 1 for raw RTs; F (12, 252) < 1 for Z scores.
Furthermore, if the main difference in lexical processing between children with SLI and TLD is a faster decay rate for lexical information, then one would expect to see a smaller difference between RTs for the neutral IW condition in comparison to the other IW conditions in children with SLI. However, when we compared the children with SLI with their typically developing peers, there was no hint of a three-way interaction between IW type, SOA, and Language Group, F (12, 252) < 1 for raw RTs; F (12, 504) = 1.04, ns, for Z scores. Thus, the pattern of results appears to be inconsistent with the decay rate hypothesis.
In comparing the associative priming effect in the typically developing children and the adults, we observed an extended time course of the effect in the children, with the largest associative priming effect occurring at a later SOA in that group. This shift in the peak impact of the IWs with age was observed in a previous PWI study of phonological priming in children (5- to 11-year-olds) and adults (Brooks & MacWhinney, Reference Brooks and MacWhinney2000). Brooks and MacWhinney interpreted the shift (i.e., greater phonological priming at later SOAs in children than adults) as due to developmental changes in speed of processing (Kail, Reference Kail1991, Reference Kail1992). That is, if children take longer to retrieve the name of the picture, the IW needs to come later in order to have its maximal effect. However, it is important to emphasize that, in the present study, the children with SLI did not show an extended time course of associative priming, relative to their peers, despite their slower speed of processing. Hence, a generalized slowing account (Kail, Reference Kail1994) also fails to account for the observed differences in the time course and the magnitude of the associative priming effect among the children.
Previous PWI studies in children (Jerger et al., Reference Jerger, Martin and Damian2002; Rosinski, Reference Rosinski1977; Rosinski, Golinkoff, & Kukish, Reference Rosinski, Golinkoff and Kukish1975; Seiger-Gardner & Schwartz, 2000) led us to expect that the children in our study would show a semantic interference effect when targets were paired with their coordinates. It is unexpected that the semantic interference effect would be observed in children when phonologically related IWs are interspersed with coordinates (Jerger et al., Reference Jerger, Martin and Damian2002; Seiger-Gardner & Schwartz, 2000) but not when associates are interspersed with coordinates. However, there are a number of reasons why caution should be adopted in interpreting the presence or absence of a semantic interference effect for children. First, there are a limited number of PWI studies of semantic interference with children, and semantic interference is not always observed. Using a Stroop-like procedure in which all of the targets were from one of two semantic categories (clothing or animals), Hanauer and Brooks (Reference Hanauer and Brooks2005, their expts. 1 and 2) showed that the semantic interference effect in children is strongly influenced by manipulations of the response set. In this study, participants completed blocks of trials in which sets of clothing and animal pictures were paired with IWs from the same two semantic categories. In the blocked condition, the pictures of animals and clothing were presented in separate blocks, whereas in the mixed condition, animal and clothing targets were interspersed. Children showed a strong semantic interference effect with slower naming of targets paired with their coordinates only in the blocked condition. That is, simultaneous activation of both semantic cohorts in the mixed condition was sufficient to eliminate the semantic interference effect. Why interference from coordinates is so vulnerable to manipulations of response set in children, but not adults, is an important topic for future research. Second, the much more extensive adult literature indicates that there are several constraints on the size or presence of a semantic interference effect in the PWI task. In this literature, a broad number of factors have been suggested to influence the size of the semantic interference effect. These include the influence of response set, target-IW association, response compatibility of the target and IW, number of repetitions of items and SOA. Given the much smaller number of studies with children than adults, we simply do not have sufficient information on how various factors impact the semantic interference effect in children.
Neurocognitive bases of coordinate interference and associative priming
The fact that age impacted the coordinate interference and the associative priming effects differently supports recent proposals that taxonomic and thematic relationships invoke distinct patterns of brain activity (Maguire, Brier, & Ferree, Reference Maguire, Brier and Ferree2010; Sachs et al., Reference Sachs, Weis, Zellagui, Huber, Zvyagintsev and Mathiak2008; Sass, Sachs, Krach, & Kircher, Reference Sass, Sachs, Krach and Kircher2009), with greater involvement of attention, effortful control and inhibition in the processing of taxonomic relationships. Using priming paradigms paired with electrophysiology (Maguire et al., Reference Maguire, Brier and Ferree2010) or fMRI (Sass et al., Reference Sass, Sachs, Krach and Kircher2009; Sachs et al., Reference Sachs, Weis, Zellagui, Huber, Zvyagintsev and Mathiak2008), these studies have documented differential patterns of neural activity over frontal, temporal, and parietal regions when processing associates (e.g., car-garage) versus coordinates (e.g., car-bus). Activation of taxonomic relationships produces increased activity in right frontotemporal regions, including the cingulate gyrus, which is involved in the detection of semantic relationships and response selection (Sass et al., Reference Sass, Sachs, Krach and Kircher2009). In contrast, thematic relationships differentially activate left superior and middle temporal regions associated with semantic memory storage and automatic “spread of activation” (Sass et al., Reference Sass, Sachs, Krach and Kircher2009, p. 82). Sass et al. argue that there is a less efficient routine for recognizing taxonomic relations than for thematic relations; thus, more effortful control of attention is required. Across studies (Maguire et al., Reference Maguire, Brier and Ferree2010; Sachs et al., Reference Sachs, Weis, Zellagui, Huber, Zvyagintsev and Mathiak2008; Sass et al., Reference Sass, Sachs, Krach and Kircher2009), thematic relationships have tended to produce larger behavioral effects than taxonomic relationships, which suggests that members of thematic categories may share stronger conceptual relationships than members of taxonomic categories (Sachs et al., Reference Sachs, Weis, Zellagui, Huber, Zvyagintsev and Mathiak2008). Reports that taxonomic and thematic knowledge may be differentially affected by brain injury (Davidoff & Roberson, Reference Davidoff and Roberson2004; Glosser, Friedman, Grugan, Lee, & Grossman, Reference Glosser, Friedman, Grugan, Lee and Grossman1998), with taxonomic relationships showing greater vulnerability to loss than thematic relationships, appears to be consistent with this interpretation. Given our finding that the associative priming effect is much more robust than the coordinate interference effect in children, neuroimaging studies with children are needed to shed light on how these distinct neural networks are developing.
Although most researchers assume that associative and coordinates influence different stages of picture naming, debate continues regarding the stages at which these effects are localized (cf. Sailor et al., Reference Sailor, Brooks, Bruening, Seiger-Gardner and Guterman2009). One proposal places the semantic interference effect at a postlexical stage of processing whereby the speaker makes a decision regarding the appropriateness of the IW as a response to the picture (Mahon et al., Reference Mahon, Costa, Peterson, Vargas and Caramazza2007). Under this hypothesis, a coordinate IW will share a sufficient number of relevant features with the target picture to require additional time to rule out as an appropriate response. This account seems incompatible with our findings of a weaker coordinate interference in children than adults, as children should be less capable of distinguishing task-relevant versus irrelevant features. Furthermore, children make occasional errors by naming the IW as opposed to the picture, but these errors are not more common for coordinate IWs than for their unrelated controls.
Alternatively, the “swinging lexical network” model of Abdel Rahman and Melinger (Reference Abdel Rahman and Melinger2009) posits that semantic interference arises from strong competition at the lexical level, whereas semantic facilitation arises from priming at the conceptual level coupled with weaker competition at the lexical level. Specifically, they argue that coordinate IWs activate a relatively large cohort at the lexical level due to the overlap they share with related lexical items. The competition among these lexical items slows processing more than the facilitation produced at the conceptual level by the semantic relatedness of the items. Under this proposal, age-related difference in the strength of the interference effect would be due to differences in the automatic activation of a semantic cohort under different task conditions. Consistent with this account, Hanauer and Brooks (Reference Hanauer and Brooks2005, their expt. 3) demonstrated that membership in the response set was sufficient to produce a cohort interference effect in adults, but not children. In this experiment, all of the IWs were unrelated to the target pictures; nevertheless, in adults, pictures paired with IWs that named other pictures in the response set were named more slowly than pictures paired with IWs that were out of the response set. This occurrence of an interference effect in the absence of semantic relatedness fits Abdel Rahman and Melinger's (Reference Abdel Rahman and Melinger2007, Reference Abdel Rahman and Melinger2009) view that cohorts emerge flexibly as ad hoc categories (Barsalou, Reference Barsalou1983) in response to task demands.
In contrast to coordinate IWs, Abdel Rahman and Melinger (Reference Abdel Rahman and Melinger2009) argue that associate IWs usually do not share connections to as many common items and, therefore, activate a smaller cohort. However, a strong associate of the target picture, such as used in our study, would be expected to produce considerable facilitation at the conceptual level through spreading activation. A smaller cohort would not produce much competition at the lexical level; hence, the slowing would be insufficient to offset the facilitation at the conceptual level.
Conclusions
Children with language impairments have significant lexical and semantic deficits that impact their fluency in word retrieval. We sought to clarify the nature of their difficulties by exploring how different types of semantic context influence lexical access in the PWI task, by contrasting the effects of associate and coordinate IWs. It is surprising that we failed to obtain a coordinate interference effect in either group of children, which led us to consider how existing models of PWI could account for our results, as well as earlier findings (Hanauer & Brooks, Reference Hanauer and Brooks2005) that the semantic interference effect in children varies as a function of the stimulus set. At present, the proposed “swinging lexical network” model of Abdel Rahman and Melinger (Reference Abdel Rahman and Melinger2009) seems to provide the most detailed account of how coordinates and associates produce either facilitation or interference as a function of task demands, and this model may be most amenable to developmental considerations. The magnitude of the associative priming effect was correlated with language abilities in the children, as measured using standardized tests. Our finding that associative priming is weak in children with SLI supports other recent findings (Hennessey et al., Reference Hennessey, Leitão and Mucciarone2010; Seiger-Gardner et al., Reference Seiger-Gardner, Brooks and Cadavid2007; Velez & Schwartz, Reference Velez and Schwartz2010), and has clinical implications for the treatment of lexical impairments. Word retrieval in children is strongly facilitated through the spread of activation to related concepts, and in children with SLI, lexical access gains weaker support from such networks of association. Treatments that focus on building stronger associative links within the lexicon may prove advantageous for reducing word-finding difficulties in children with SLI.
APPENDIX A

ACKNOWLEDGMENTS
The work was supported by a City University of New York Collaborative Research Award and NIH Score Grant S06GM008225 (to K. S. and P. J. B.). We thank Paul Bruening, Mark Guterman, Christine Neumayer, Kayon Nobles, and Olidia Valencia for their assistance in preparing stimulus materials, data collection, and tabulation.