Introduction
The serotonergic system has been the principal focus in molecular genetic investigations of emotional behavior in general, and risk of major depressive illness in particular (Belmaker & Agam, Reference Belmaker and Agam2008). The serotonin transporter (5-HTT) regulates the reuptake of 5-HT at synapses (Heils et al. Reference Heils, Teufel, Petri, Stober, Riederer, Bengel and Lesch1996; Lesch et al. Reference Lesch, Bengel, Heils, Sabol, Greenberg, Petri, Benjamin, Muller, Hamer and Murphy1996), and molecular genetic investigations of this pathway have focused in large part on the role of the serotonin transporter gene (SLC6A4). The 5-HTTLPR is a polymorphism in the promoter region of the serotonin transporter gene (Heils et al. Reference Heils, Teufel, Petri, Stober, Riederer, Bengel and Lesch1996), with two common alleles: a long allele with 16 repeats (L) and a short allele with 14 repeats (S). The S allele (Lesch et al. Reference Lesch, Bengel, Heils, Sabol, Greenberg, Petri, Benjamin, Muller, Hamer and Murphy1996) has been reported to result in lower transcriptional activity than the L allele (Heils et al. Reference Heils, Teufel, Petri, Stober, Riederer, Bengel and Lesch1996), leading to a relative reduction in mRNA levels, serotonin binding, and reuptake (Little et al. Reference Little, McLaughlin, Zhang, Livermore, Dalack, McFinton, DelProposto, Hill, Cassin, Watson and Cook1998). More recently, a functional single nucleotide polymorphism (SNP) within the 5-HTTLPR variant has been identified that seems to modify the functional consequences of carrying the L allele (Hu et al. Reference Hu, Lipsky, Zhu, Akhtar, Taubman, Greenberg, Xu, Arnold, Richter, Kennedy, Murphy and Goldman2006). The LA variant increases transcription whereas the S and LG constructs were not found to differ in basal expression. In consequence, genotyping of this SNP has begun to be incorporated into recent investigations of the 5-HTTLPR.
The 5-HTTLPR variant has been investigated extensively in relation to its possible association with mood disorder and related constructs such as anxiety-related personality traits. A recent meta-analysis concluded that the S allele is not associated with elevated Harm Avoidance, or Neuroticism as measured by the Eysenck Personality Questionnaire, although there remains a possibility that the variant influences the NEO personality questionnaire measure of Neuroticism (Munafò et al. Reference Munafò, Freimer, Ng, Ophoff, Veijola, Miettunen, Jarvelin, Taanila and Flint2009 b). This indicates the possibility that individual study characteristics, such as the measurement instrument used, may influence the likelihood of detecting a hypothesized genetic effect. It has also been reported to moderate the relationship between stressful life events and unipolar depression (Caspi et al. Reference Caspi, Sugden, Moffitt, Taylor, Craig, Harrington, McClay, Mill, Martin, Braithwaite and Poulton2003), although again the evidence to date is equivocal (Munafò et al. Reference Munafò, Durrant, Lewis and Flint2009 a; Risch et al. Reference Risch, Herrell, Lehner, Liang, Eaves, Hoh, Griem, Kovacs, Ott and Merikangas2009). In particular, the interaction effect described in the original report implies an association between the 5-HTTLPR genotype and the risk of depression that should therefore be detectable with sufficient statistical power (Munafò et al. Reference Munafò, Durrant, Lewis and Flint2009 a). A recent meta-analysis of 24 independent samples concluded that there was evidence of significant association between the 5-HTTLPR genotype and unipolar depression (Lopez-Leon et al. Reference Lopez-Leon, Janssens, Gonzalez-Zuloeta Ladd, Del-Favero, Claes, Oostra and van Duijn2008). However, this report did not include data from relevant gene×environment (G×E) interaction studies, and only included studies published up to 2006.
It is therefore timely, in the context of recent criticisms of the 5-HTTLPR×stressful life events literature, to re-examine the strength of association between the 5-HTTLPR genotype and unipolar depression, particularly because the size of any interaction effect will be determined by the main effects (for example of the 5-HTTLPR genotype and stressful life events, separately) and the type of interaction present. When the environmental and genetic main effect sizes are known, in addition to the type of interaction operating, the size of the interaction effect is fixed, given certain assumptions (i.e. genotype frequencies, proportion of environmentally exposed individuals, model of genetic action). The accurate specification of the magnitude of any main effect of the 5-HTTLPR genotype on risk of depression, in conjunction with the nature of the interaction effect predicted, will therefore inform the design and conduct of future 5-HTTLPR×stressful life events interaction studies.
It is also possible that some of the observed inconsistency among genetic association studies may be due to variation in individual study characteristics, such as the measurement instrument used, or sample ancestry. Meta-analysis allows the indirect investigation of these characteristics, by comparing pooled effect size estimates grouped by study characteristic. In principle, this might clarify why some studies fail to detect an effect even though the effect is present, and inform the design and conduct of future primary studies. Finally, there is also increasing concern that the genetic literature may be distorted by various biases, which would lead to a misleading impression of the strength of evidence for a putative gene–disease association (Munafò et al. Reference Munafò, Attwood and Flint2008, Reference Munafò, Stothart and Flint2009 c). Meta-analysis is one means by which a more accurate estimate of the strength of evidence for such association may be obtained, in addition to offering a means by which potential biases, such as publication bias, may be identified and, in principle, corrected for (Munafò & Flint, Reference Munafò and Flint2004).
We therefore sought to ascertain the strength of evidence for association between the 5-HTTLPR polymorphism and unipolar depression, using meta-analytic techniques to comprehensively combine data from relevant published studies, and obtain an estimate of the likely magnitude of effect of any association. We also sought to test for possible publication bias, and explore the impact of various study design characteristics on the magnitude of the observed effect size.
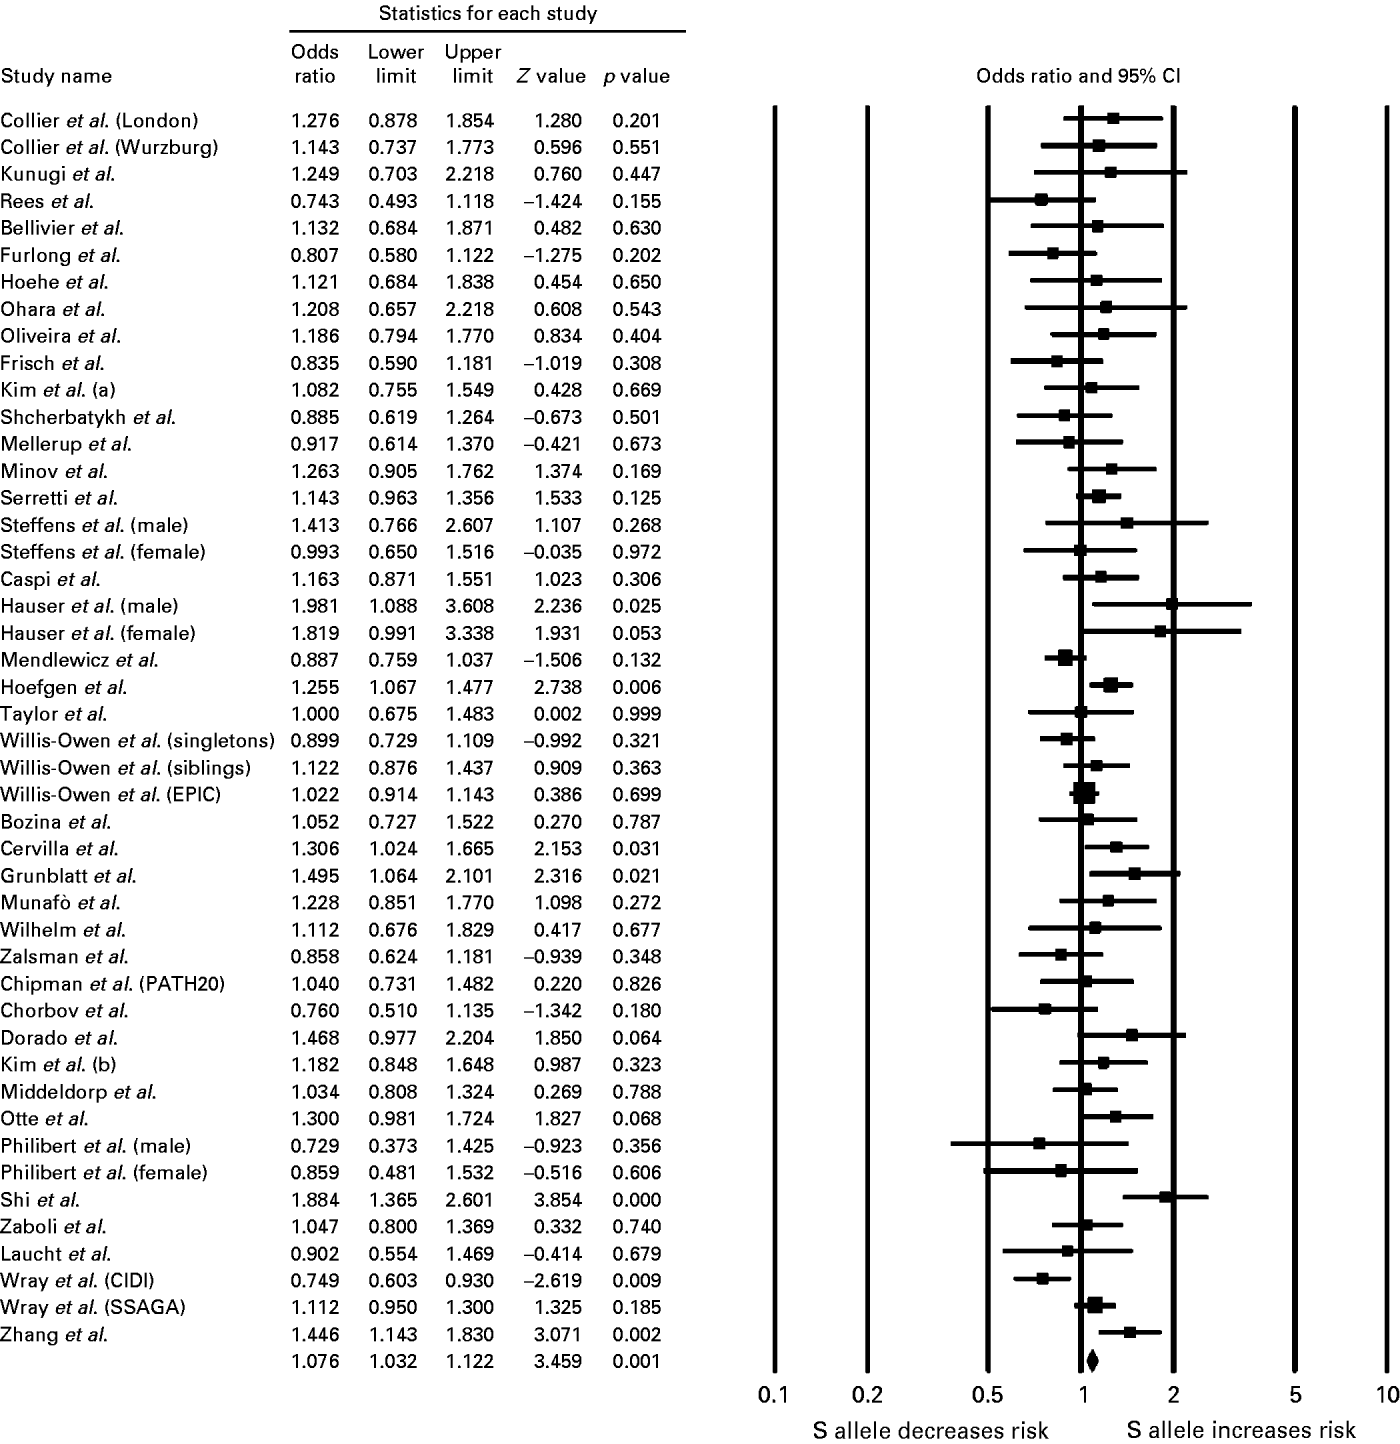
Meta-analysis of 5-HTTLPR allele frequency in healthy controls and patients with unipolar depression.

Method
Selection of studies for inclusion
Case–control genetic association studies of the 5-HTTLPR polymorphism in healthy controls and patients with unipolar depression were included. Studies reporting data on either single-sex or both male and female participants of any ancestral origin were included. Studies with data for only patients or only healthy participants were excluded, as were family-based studies that only reported transmission disequilibrium to affected offspring. The principal outcome measure was the allelic odds ratio (OR) for the 5-HTTLPR polymorphism and major depression case status, which assumes an additive model of genetic action. Secondary outcome measures were the genotypic ORs for both dominant (S+ v. LL) and recessive (SS v. L+) models of genetic action.
Search strategy
The search was performed on two databases: PubMed and PsycINFO. These databases were searched from the first date available in each database up to 30 September 2009, using the search terms ‘depression’, ‘genetic association’, ‘serotonin transporter’, ‘5-HTTLPR’, ‘5HTTLPR’, ‘SERT’ and ‘SLC6A4’. Once articles had been collected, bibliographies were then hand-searched for additional references.
The abstracts of studies identified by these search strategies were then examined with reference to the inclusion and exclusion criteria. Duplications were deleted and the whole text of each reference was then checked to further establish whether the study met the study inclusion criteria. Studies that reported previously published data were excluded.
Data extraction
For each study, the following data were extracted independently by two authors (H.C. and A.S.A.) using standard forms: (1) author(s) and year of publication; (2) methods (country of origin, case and control sample size, diagnostic classification, method of diagnosis, method of sampling, method of genotyping, whether or not an extreme score design was used, whether or not the study investigated G×E interaction effects, sample ancestry, and S allele frequency); (3) data (number of participants in control and case groups, mean age and sex ratio by allele frequency). Genotype frequencies were used to calculate whether these deviated significantly from Hardy–Weinberg equilibrium among controls. Ancestry was coded as European, East Asian or Other (which included cases where ancestry was stated as mixed or not stated). Discrepancies were resolved by mutual consent.
Analysis of data
Data were analyzed using the Comprehensive Meta-Analysis (v.2) statistical software package (Borenstein & Borenstein, Reference Borenstein and Borenstein1999). An α level of 0.050 was retained throughout, and all tests of significance were two-tailed.
Data were initially analyzed within a fixed-effects framework and ORs pooled using inverse variance methods to generate a summary OR and 95% confidence interval (CI). A fixed-effects framework assumes that the effect of allele frequency is constant across studies and between-study variation is considered to be due to chance or random variation. The assumption was checked using a χ2 test of goodness of fit for homogeneity. The significance of the pooled OR was determined using a Z test, and the percentage of total variation across studies due to heterogeneity quantified using the I 2 statistic. Conventionally, values of 25, 50 and 75% represent low, moderate and high heterogeneity respectively (Higgins et al. Reference Higgins, Thompson, Deeks and Altman2003).
Where there was evidence of a significant association between 5-HTTLPR allele frequency and depression case status in the presence of significant and/or moderate to high between-study heterogeneity, a random-effects framework was used, with ORs pooled using DerSimonian and Laird methods. A random-effects framework assumes that between-study variation is due to both chance or random variation and an individual study effect. Random-effects models are more conservative than fixed-effects models and generate a wider CI. The significance of the pooled OR was determined using a Z test.
We also conducted a series of stratified analyses and meta-regression analyses to assess the impact of various study characteristics, including diagnostic classification, method of diagnosis, method of sampling, method of genotyping, whether or not an extreme score design was used, whether or not the study investigated G×E interaction effects, sample ancestry, and S allele frequency. The OR of the first published study was compared to the pooled OR of the remaining studies using a Z test, as there is evidence for a substantially greater estimate of effect size in the first published study (Ioannidis et al. Reference Ioannidis, Ntzani, Trikalinos and Contopoulos-Ioannidis2001). Funnel plots were created to assess potential small-study bias (e.g. due to publication bias against non-significant results) by plotting individual study ln OR against the inverse of the standard error of the ln OR. Small-study bias was also assessed using the Egger test (Egger et al. Reference Egger, Davey Smith, Schneider and Minder1997).
Results
Description of studies
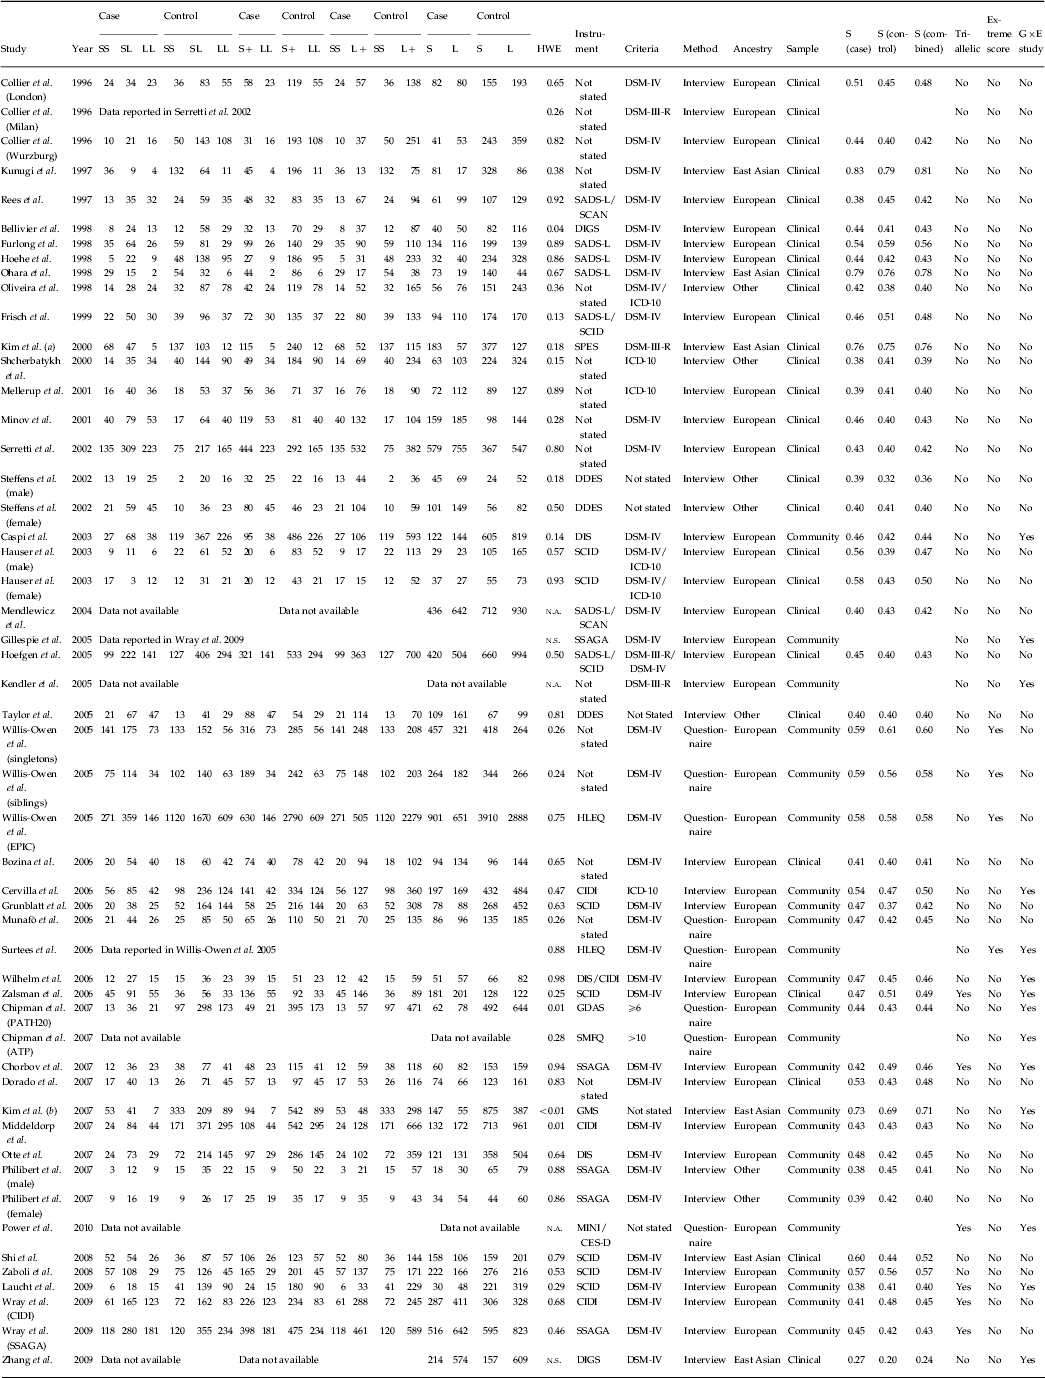
A total of 39 studies, comprising k=46 independent samples published between 1996 and 2009, were identified by the search strategy and contributed to the meta-analysis (Collier et al. Reference Collier, Stober, Li, Heils, Catalano, Di Bella, Arranz, Murray, Vallada, Bengel, Muller, Roberts, Smeraldi, Kirov, Sham and Lesch1996; Kunugi et al. Reference Kunugi, Hattori, Kato, Tatsumi, Sakai, Sasaki, Hirose and Nanko1997; Rees et al. Reference Rees, Norton, Jones, McCandless, Scourfield, Holmans, Moorhead, Feldman, Sadler, Cole, Redman, Farmer, McGuffin, Owen and Craddock1997; Bellivier et al. Reference Bellivier, Henry, Szoke, Schurhoff, Nosten-Bertrand, Feingold, Launay, Leboyer and Laplanche1998; Furlong et al. Reference Furlong, Ho, Walsh, Rubinsztein, Jain, Paykel, Easton and Rubinsztein1998; Hoehe et al. Reference Hoehe, Wendel, Grunewald, Chiaroni, Levy, Morris-Rosendahl, Macher, Sander and Crocq1998; Ohara et al. Reference Ohara, Nagai, Tsukamoto, Tani, Suzuki and Ohara1998; Oliveira et al. Reference Oliveira, Gallindo, Maia, Brito-Marques, Otto, Passos-Bueno, Morais and Zatz1998; Frisch et al. Reference Frisch, Postilnick, Rockah, Michaelovsky, Postilnick, Birman, Laor, Rauchverger, Kreinin, Poyurovsky, Schneidman, Modai and Weizman1999; Kim et al. Reference Kim, Lim, Lee, Sohn, Kim, Hahn and Carroll2000, Reference Kim, Stewart, Kim, Yang, Shin, Kim and Yoon2007; Shcherbatykh et al. Reference Shcherbatykh, Golimbet, Orlova and Kaleda2000; Mellerup et al. Reference Mellerup, Bennike, Bolwig, Dam, Hasholt, Jorgensen, Plenge and Sorensen2001; Minov et al. Reference Minov, Baghai, Schule, Zwanzger, Schwarz, Zill, Rupprecht and Bondy2001; Serretti et al. Reference Serretti, Lilli, Lorenzi, Lattuada, Cusin and Smeraldi2002; Steffens et al. Reference Steffens, Svenson, Marchuk, Levy, Hays, Flint, Krishnan and Siegler2002; Caspi et al. Reference Caspi, Sugden, Moffitt, Taylor, Craig, Harrington, McClay, Mill, Martin, Braithwaite and Poulton2003; Hauser et al. Reference Hauser, Leszczynska, Samochowiec, Czerski, Ostapowicz, Chlopocka, Horodnicki and Rybakowski2003; Mendlewicz et al. Reference Mendlewicz, Massat, Souery, Del-Favero, Oruc, Nothen, Blackwood, Muir, Battersby, Lerer, Segman, Kaneva, Serretti, Lilli, Lorenzi, Jakovljevic, Ivezic, Rietschel, Milanova and Van Broeckhoven2004; Hoefgen et al. Reference Hoefgen, Schulze, Ohlraun, von Widdern, Hofels, Gross, Heidmann, Kovalenko, Eckermann, Kolsch, Metten, Zobel, Becker, Nothen, Propping, Heun, Maier and Rietschel2005; Taylor et al. Reference Taylor, Steffens, Payne, MacFall, Marchuk, Svenson and Krishnan2005; Willis-Owen et al. Reference Willis-Owen, Turri, Munafò, Surtees, Wainwright, Brixey and Flint2005; Bozina et al. Reference Bozina, Mihaljevic-Peles, Sagud, Jakovljevic and Sertic2006; Cervilla et al. Reference Cervilla, Rivera, Molina, Torres-Gonzalez, Bellon, Moreno, de Dios Luna, Lorente, de Diego-Otero, King, Nazareth and Gutierrez2006; Grunblatt et al. Reference Grunblatt, Loffler, Zehetmayer, Jungwirth, Tragl, Riederer and Fischer2006; Munafò et al. Reference Munafò, Clark, Roberts and Johnstone2006; Surtees et al. Reference Surtees, Wainwright, Willis-Owen, Luben, Day and Flint2006; Wilhelm et al. Reference Wilhelm, Mitchell, Niven, Finch, Wedgwood, Scimone, Blair, Parker and Schofield2006; Zalsman et al. Reference Zalsman, Huang, Oquendo, Burke, Hu, Brent, Ellis, Goldman and Mann2006; Chipman et al. Reference Chipman, Jorm, Prior, Sanson, Smart, Tan and Easteal2007; Dorado et al. Reference Dorado, Penas-Lledo, Gonzalez, Caceres, Cobaleda and Llerena2007; Middeldorp et al. Reference Middeldorp, de Geus, Beem, Lakenberg, Hottenga, Slagboom and Boomsma2007; Otte et al. Reference Otte, McCaffery, Ali and Whooley2007; Philibert et al. Reference Philibert, Sandhu, Hollenbeck, Gunter, Adams and Madan2007; Shi et al. Reference Shi, Hu, Dong, Gao, An, Liu, Chen and Sun2008; Zaboli et al. Reference Zaboli, Jonsson, Gizatullin, De Franciscis, Asberg and Leopardi2008; Laucht et al. Reference Laucht, Treutlein, Blomeyer, Buchmann, Schmid, Becker, Zimmermann, Schmidt, Esser, Rietschel and Banaschewski2009; Wray et al. Reference Wray, James, Gordon, Dumenil, Ryan, Coventry, Statham, Pergadia, Madden, Heath, Montgomery and Martin2009; Zhang et al. Reference Zhang, Xu, Xu, Yang, Luo, Sun, Sun, Wang and Shen2009). Of these, k=33 samples were derived from populations of European ancestry, k=6 from populations of East Asian ancestry, and k=7 from other populations. Data from one study (Power et al. Reference Power, Stewart, Ancelin, Jaussent, Malafosse and Ritchie2010) were not reported in a format that enabled their inclusion in the meta-analysis. Data from another study (Mendlewicz et al. Reference Mendlewicz, Massat, Souery, Del-Favero, Oruc, Nothen, Blackwood, Muir, Battersby, Lerer, Segman, Kaneva, Serretti, Lilli, Lorenzi, Jakovljevic, Ivezic, Rietschel, Milanova and Van Broeckhoven2004) were available from a previous meta-analysis (Lopez-Leon et al. Reference Lopez-Leon, Janssens, Gonzalez-Zuloeta Ladd, Del-Favero, Claes, Oostra and van Duijn2008). In cases where data from the same sample appeared in more than one study (Collier et al. Reference Collier, Stober, Li, Heils, Catalano, Di Bella, Arranz, Murray, Vallada, Bengel, Muller, Roberts, Smeraldi, Kirov, Sham and Lesch1996; Gillespie et al. Reference Gillespie, Whitfield, Williams, Heath and Martin2005; Surtees et al. Reference Surtees, Wainwright, Willis-Owen, Luben, Day and Flint2006), only the study reporting the larger sample, or the most recent study, was included. The characteristics of these studies are presented in Table 1.
Characteristics of included studies

ATP, Australian Temperament Project; CES-D, Center for Epidemiologic Studies – Depression; CIDI, Composite International Diagnostic Interview; DDES, Duke Depression Evaluation Schedule; DIGS, Diagnostic Interview for Genetic Studies; DIS, Diagnostic Interview Schedule; EPIC, European Prospective Investigation into Cancer and Nutrition; GDAS, Goldberg Depression and Anxiety Scales; GMS, Geriatric Mental State; HLEQ, Health and Life Experiences Questionnaire; MINI, Mini International Neuropsychiatric Interview; PATH20, Personality and Total Health (PATH) Through Life Project; SADS-L, Schedule for Affective Disorders and Schizophrenia – Lifetime; SCAN, Schedules for Clinical Assessment in Neuropsychiatry; SCID, Structured Clinical Interview for Depression; SPES, Samsung Psychiatric Evaluation Schedule; SMFQ, Short Mood and Feelings Questionnaire; SSAGA, Semi-Structured Assessment for the Genetics of Alcoholism; S, S allele frequency; HWE, Hardy–Weinberg Equilibrium (controls); n.a., not available; n.s., not significant.
Meta-analysis
Meta-analysis (k=46) indicated evidence of significant allelic association between the 5-HTTLPR polymorphism and unipolar depression (OR 1.08, 95% CI 1.03–1.12, Z=3.46, p=0.001). These results are presented in Fig. 1. There was evidence of significant between-study heterogeneity [χ2(45)=80.87, p=0.001, I 2=44%, 95% CI 15–63]. When the analysis was repeated within a random-effects framework there remained evidence of significant association (OR 1.09, 95% CI 1.02–1.16, Z=2.68, p=0.007). Removal of the first published study, comprising three independent samples (k=43), did not alter these results substantially (OR 1.07, 95% CI 1.02–1.12, Z=3.01, p=0.003). There was evidence of significant between-study heterogeneity [χ2(42)=79.43, p<0.001, I 2=47%, 95% CI 18–66]. When the analysis was repeated within a random-effects framework, there remained evidence of significant association (OR 1.08, 95% CI 1.01–1.16, Z=2.34, p=0.019).
There was considerable variation across studies in S allele frequency for cases (27–82%), controls (20–79%) and total samples (24–81%). Meta-regression did not indicate any evidence of association between individual study effect size estimate and S allele frequency for case S allele frequency (p=0.28) or total S allele frequency (p=0.28), but did indicate an association with control S allele frequency (p=0.002), reflecting decreasing effect size estimate with increasing S allele frequency among controls.
We also tested dominant and recessive models of the effect of the S allele. Data from two studies (Mendlewicz et al. Reference Mendlewicz, Massat, Souery, Del-Favero, Oruc, Nothen, Blackwood, Muir, Battersby, Lerer, Segman, Kaneva, Serretti, Lilli, Lorenzi, Jakovljevic, Ivezic, Rietschel, Milanova and Van Broeckhoven2004; Zhang et al. Reference Zhang, Xu, Xu, Yang, Luo, Sun, Sun, Wang and Shen2009) could not be included in these analyses because they did not report genotype frequencies among case and controls. For the dominant model (S+v. LL) the effect of genotype was not statistically significant (OR 1.06, 95% CI 0.99–1.14, Z=1.63, p=0.10). There was no evidence of significant between-study heterogeneity [χ2(43)=53.78, p=0.13, I 2=20%, 95% CI 0–48]. For the recessive model (SS v. L+) the effect of genotype was statistically significant (OR 1.16, 95% CI 1.08–1.24, Z=3.95, p<0.001). There was evidence of significant between-study heterogeneity [χ2(43)=69.59, p=0.006, I 2=38%, 95% CI 5–60]. When the analysis was repeated within a random-effects framework, there remained evidence of significant association (OR 1.18, 95% CI 1.06–1.31, Z=3.12, p=0.002).
Stratified analyses
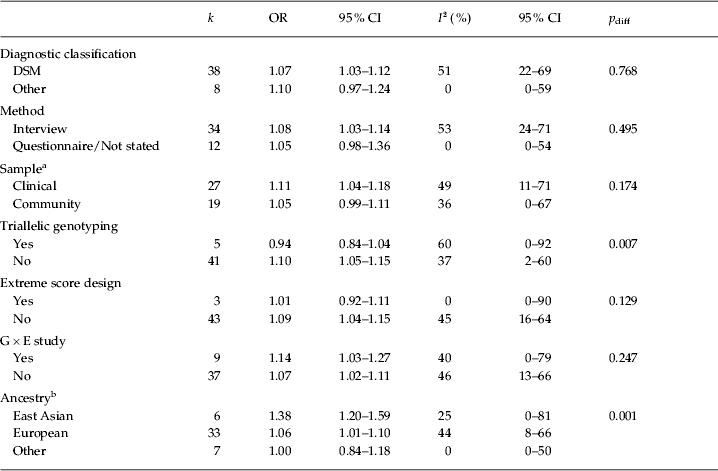
A series of analyses stratified by study design characteristics were conducted to assess the impact of these characteristics on the pooled effect size estimate. These are summarized in Table 2.
Analyses stratified by study design characteristics

OR, Odds ratio; CI, confidence interval; diff, difference; G×E, gene×environment.
a These results did not change substantially when one study that recruited participants from insurance records of those on long-term sick leave was included (Zaboli et al. Reference Zaboli, Jonsson, Gizatullin, De Franciscis, Asberg and Leopardi2008).
b Pairwise comparisons indicate that the pooled effect size estimate derived from samples of East Asian ancestry differs significantly from those derived from both European (p<0.001) and Other (p=0.004) samples, but that estimates from European and Other samples do not differ significantly (p=0.52).
We investigated diagnostic classification (DSM-based versus other), method of diagnosis (clinical interview versus questionnaire or not stated), method of sampling (clinical versus community), method of genotyping (triallelic versus biallelic), whether or not an extreme score design was used, whether or not the study investigated G×E interaction effects, and sample ancestry (European versus East Asian versus Other). Of these, we only observed evidence for statistically significant differences in pooled effect size estimates by method of genotyping (p=0.007) and sample ancestry (p=0.001).
For the analysis stratified by method of genotyping, we observed a reduced pooled effect size estimate for studies that used triallelic genotyping (OR 0.94, 95% CI 0.84–1.04, Z=1.19, p=0.24) compared to those that did not (OR 1.10, 95% CI 1.05–1.15, Z=4.22, p<0.001). For the analysis stratified by sample ancestry, we observed an increased pooled effect size estimate for studies that recruited samples of East Asian ancestry (OR 1.38, 95% CI 1.20–1.59, Z=4.44, p<0.001) compared to those that recruited samples of European (OR 1.06, 95% CI 1.01–1.10, Z=2.34, p=0.019) or Other (OR 1.00, 95% CI 0.84–1.18, Z=0.06, p=0.95) ancestries. Pairwise comparisons indicate that the pooled effect size estimate derived from samples of East Asian ancestry differs significantly from those derived from both European (p<0.001) and Other (p=0.004) samples, but that estimates from European and Other samples do not differ significantly (p=0.52).
Publication bias
A visual inspection of a funnel plot of individual study accuracy (ln OR) against accuracy (1/s.e.) did not suggest evidence of small study bias, and Egger's test (Egger et al. Reference Egger, Davey Smith, Schneider and Minder1997) also did not indicate evidence of small study bias (t 44=0.86, p=0.39). A comparison of the effect size of the first published study (OR 1.22) with the pooled effect size of subsequent studies (OR 1.07) indicated no significant difference (p=0.38). Meta-regression of individual study effect size against year of publication was not significant (p=0.41). These results did not change substantially when G×E studies were excluded.
Power calculation
The overall effect size estimate (OR 1.08) indicated that the sample size to detect this correlation with 80% power at an α level of 0.05, on the assumption of equal numbers of cases and controls, would be in excess of n=5600. This suggests that the studies conducted to date lack sufficient statistical power. Power calculations were performed using G*Power3 (Faul et al. Reference Faul, Erdfelder, Lang and Buchner2007).
Discussion
The results of our primary analysis indicate a statistically significant but small effect of the 5-HTTLPR polymorphism on risk of unipolar depression. This association remained significant when data from samples of European and East Asian ancestry were analyzed separately, and there was evidence for a larger effect among samples of East Asian ancestry. In all cases there was evidence of significant between-study heterogeneity, although the observed associations were robust to the application of a random-effects framework. We did not observe any evidence of small study bias, such as might arise in the presence of publication bias. These findings are consistent with our previous report (Munafò et al. Reference Munafò, Freimer, Ng, Ophoff, Veijola, Miettunen, Jarvelin, Taanila and Flint2009 b), which indicated a possibility that the variant influences trait neuroticism as measured by the NEO personality questionnaire, although the failure to observe association with other measures of similar traits is problematic. It is also worth noting that the magnitude of the 5-HTTLPR effect observed in our primary meta-analysis (OR 1.08) is very similar to that indicated in our recent review of the 5-HTTLPR×stressful life events literature (OR 1.07) for the main effect of genotype (Munafò et al. Reference Munafò, Durrant, Lewis and Flint2009 a). Overall, therefore, our results from this and other studies provide support for a very small effect of the 5-HTTLPR genotype on risk of depression, possibly mediated by trait neuroticism (Munafò et al. Reference Munafò, Freimer, Ng, Ophoff, Veijola, Miettunen, Jarvelin, Taanila and Flint2009 b), but do not support the possibility that this effect differs depending on exposure to stressful life events (Munafò et al. Reference Munafò, Durrant, Lewis and Flint2009 a).
In the absence of a sufficiently powerful and well-designed study to determine the relationship between genetic variant and phenotype, meta-analysis has become a standard strategy in psychiatric genetics for resolving differences between multiple studies of the same genetic association. However, the results of a meta-analysis are dependent on the quality of the individual studies, and are therefore often not definitive (Munafò & Flint, 2004). It is now widely recognized that in psychiatric disease the genetic effect size attributable to a single genetic variant is likely to be very small; OR values <1.2 are probably the rule (consistent with the pooled effect size estimate we observed in this study), requiring studies with thousands of participants for their detection. Notably, only six of the studies reported here used more than 1000 participants, and only two (from the same investigators) used more than 1000 cases and 1000 controls (Willis-Owen et al. Reference Willis-Owen, Turri, Munafò, Surtees, Wainwright, Brixey and Flint2005; Surtees et al. Reference Surtees, Wainwright, Willis-Owen, Luben, Day and Flint2006). Low statistical power will increase the ratio of false positives to true positives among those studies that achieve nominal statistical significance (Sterne & Davey Smith, Reference Sterne and Davey Smith2001).
It is noteworthy that few of the individual study characteristics that we investigated had a substantial effect on the pooled effect size estimate. This suggests that concerns over the variability in the use of different diagnostic instruments, methods of assessment, sampling strategies, or in the use of extreme score designs, may be unwarranted. Unfortunately, we were unable to assess the impact of other factors, most notably whether a diagnosis of lifetime depression was made, and the extent to which major confounding conditions, such as psychotic disorders and substance use disorders, were excluded. This was because most studies failed to report this information adequately, and it would be valuable if future studies could present this information systematically.
Only two characteristics were found to influence the effect size estimate: sample ancestry and the use of triallelic genotyping methods. In the former, the effect of the 5-HTTLPR was greater among samples of East Asian ancestry compared to those of European or other ancestries, which in turn did not differ. This may be due, in part, to a higher frequency of the S allele in East Asian populations. The mean of East Asian populations in Table 1 is 0.64, compared to 0.46 in Europeans, but the variance is also much larger (0.048 v. 0.003), possibly because of greater variation between populations or possibly reflecting differences in genotyping methodology, a point discussed below. Of note, studies that used triallelic genotyping of the 5-HTTLPR indicated a reduced effect size estimate, opposite to what would be expected if the effect of the 5-HTTLPR were genuine and this method more accurately assayed functional genotype. However, the 5-HTTLPR is not simply triallelic; at least 10 alleles have been reported (Nakamura et al. Reference Nakamura, Ueno, Sano and Tanabe2000) and there are additional functional SNPs at the transporter locus (Martin et al. Reference Martin, Cleak, Willis-Owen, Flint and Shifman2007), two of which seem to make larger contributions to expression variation than the promoter variants. We do not know how many of the variants are functional, nor how many are in linkage disequilibrium with other variants that also have an effect on transcriptional activity. These genetic variants increase the heterogeneity, but unfortunately there are insufficient published data to assess their impact.
A final issue, rarely considered in the literature but which may contribute to variability between different studies, is technical. The DNA in which the 5-HTTLPR is embedded has a high GC content (about 70%), and polymerase chain reaction (PCR)-based assays require modifications to provide reliable results. We have often observed that, under these conditions, additional, artifactual bands may be produced. We therefore carry out the PCR in duplicate routinely, with case and control participants ordered randomly on the same PCR analysis plate, and have the genotypes called blind to the status of the participant. We have found that these controls are essential to avoid bias in the genotyping, but we do not know to what extent similar controls are used in other laboratories. It is possible that technical artifacts may explain some of the inconsistencies in the literature, which may in turn account for the observed between-study heterogeneity in our analyses.
When, as here, meta-analysis is reliant on using a large number of small studies, there is ample opportunity for undetected confounds to bias the results. Some confounds, such as differences in sample ancestry and the diagnostic criteria used, are well recognized and can be taken into account, as we have done here. Although we did not observe any evidence of small study bias, it is worth noting that formal tests of small study bias lack power to detect modest effects. However, there are other biases that, until now, have remained relatively ignored, and that are also likely to contribute. We have documented the impact of research location, funding and journal impact factor on the results of psychiatric genetic association studies (Munafò et al. Reference Munafò, Attwood and Flint2008, Reference Munafò, Stothart and Flint2009 c). Undoubtedly other similar factors, equally distant from biology, remain to be discovered. Without taking these into consideration it is difficult to arrive at a firm recommendation as to the validity and reliability of the results of our meta-analysis. Prima facie, our results provide support for the presence of a small effect of the 5-HTTLPR polymorphism on susceptibility to depression. However, we caution that it is possible that the effect has an artifactual basis rather than a biological origin.
Acknowledgements
We are grateful to the authors who released their data in an appropriate format to enable their inclusion. J. Flint is supported by the Wellcome Trust. This research was supported in part by a National Alliance for Research on Schizophrenia and Depression Young Investigator Award to M. Munafò.
Declaration of Interest
None.