


Introduction
Winter growth of sea ice is probably the single most significant dynamic change on the earth’s surface and is a key parameter in global climate, oceanographic and ecological systems. yet relatively few measurements have been made of the physical properties of sea-ice growth in situ, largely due to the difficulties associated with fieldwork during the polar winter. most traditional models of sea-ice properties and growth during the winter are fashioned from measurements at the end of winter, climate records and laboratory experiments. however, sea-ice growth can be strongly affected by local conditions not included in models, such as found by Reference Crocker and WadhamsCrocker and wadhams (1989) in mcmurdo sound, antarctica, who had to modify their model to account for platelet ice growth.
Platelet ice is often observed in mcmurdo sound, as layers of unaligned crystals below and within the usual congelation ice structure, and also as an unconsolidated layer under the ice (Reference Crocker and WadhamsCrocker and wadhams, 1989; Reference Jeffries and WeeksJeffries and weeks, 1993; Reference Gow, Ackley, Govoni, Weeks and JeffriesGow and others, 1998; Reference Günther and DieckmannGünther and diekmann, 1999; Reference Leonard, Purdie, Langhorne, Haskell, Williams and FrewLeonard and others, 2006). although linked to the proximity of ice shelves, the exact mechanism for platelet ice growth is still undetermined (Reference Smith, Langhorne, Haskell, Trodahl, Frew and VennellSmith and others, 2001). Reference Foldvik and KvingeFoldvik and kvinge (1974) demonstrated that thermohaline convection under ice shelves could produce supercooled surface water, which has been observed in mcmurdo sound (Reference Lewis, Perkin and JacobsLewis and perkin, 1985). platelet ice could be produced in situ where the supercooled water contacts the sea ice, or as plumes of frazil ice suspended in the water (Reference Jenkins and BomboschJenkins and bombosch, 1995; Reference Smedsrud and JenkinsSmedsrud and jenkins, 2004), coming from under the ice shelf and attaching to the sea ice.
Sea ice grows principally through the conduction of heat from the water interface, up through the ice (and sometimes snow) to the air interface. growth models, beginning with Reference StefanStefan (1891), have largely been concerned with determining the ice–air equilibrium temperature via a variety of heat-transfer processes between ice, snow and atmosphere (Reference LeppärantaLeppäranta, 1993). more detailed numerical models such as Reference Maykut and UntersteinerMaykut and untersteiner (1971) include environmental parameters logged on location, or large-scale measurements from remote sensing. these models have been applied somewhat successfully to seasonal ice growth rates, retaining the basic assumptions of stefan’s law, in fitting a temperature gradient to a derived ice–air surface temperature. thermistor arrays frozen into growing sea ice can measure the temperature profile in situ, and were used by Reference Lewis and OuraLewis (1967) to determine ice growth and heat transport directly. since then many others have used thermistor arrays, including Reference Lytle and AckleyLytle and ackley (1996), Reference TrodahlTrodahl and others (2000) and Reference Wettlaufer, Worster and HuppertWettlaufer and others (2000), with increasing temporal and spatial resolutions in ice growth measured at the ice–water interface.
This paper reports how detailed measurements of the ice temperature profile recorded during the growth of first-year sea ice over the winter were used to compare sea-ice growth with the predictions of heat conduction from the ice–water interface. measuring the temperature gradient directly avoids the complications of modelling heat-exchange processes at the ice–air interface, and preliminary results indicate additional heat loss to the ocean is required to explain the sea-ice growth in the vicinity of an ice shelf.
Ice Growth Model
Idealized growth of sea ice was solved analytically by Reference StefanStefan (1891), by equating the latent heat removed freezing a volume, v, of ice with density ρ si to the vertical heat conduction up through the ice to the colder air above. considering 1 m2 of ice with thickness H, the volume of ice frozen is just the growth rate dH/dt, and the conductive heat flux is proportional to the vertical temperature gradient δT/δz in the ice. however, the temperature gradient will depend on the ice thickness, assuming a linear temperature profile between the top surface at T 0 and the base at the freezing point T f. equating latent heat to the conductive flux removed gives

Where L si and k si are the latent heat and thermal conductivity of sea p ice. the solution to equation (1) gives the ice thickness known as stefan’s law, where θ is the integral of the negative surface temperature over time and is usually expressed in degree-days.
Sea ice is a complex mixture of liquid brine inclusions trapped between crystals of pure water ice, as well as relatively small volumes of air and solid salts, all in thermodynamic equilibrium as described quantitatively in Reference Weeks and AckleyWeeks and ackley (1982). brine volume and, therefore, all other thermal properties of sea ice are functions of salinity and temperature which have been determined theoretically and experimentally, as summarized in Reference YenYen (1981). since the temperature and salinity change through the ice, the thermal properties also vary with depth and time, and many ice growth models simply use averages of ice properties and temperature gradient.
Models following stefan’s formulation consider all growth is at the ice–water interface, the surface where the sea ice is at its freezing point. however, ice growth is not complete at the freezing temperature, but continues as ice cools further due to the decrease in brine volume with temperature. about 90% of the brine volume change occurs within a few degrees of the freezing point in a layer of several centimetres above the ice–water interface, where the vertical temperature gradient increases smoothly from approximately zero in the water. far above the ice–water interface, the heat associated with changes in brine volume is accounted for in the heat capacity.
Consider a depth H in the ice where the heat balance is evaluated. define H to be the depth of a temperature isotherm where the brine volume and therefore all thermal properties of the sea ice are known. the rate of change, dH/dt, of the isotherm depth will give the volume of ice growth in the latent-heat term in equation (1). the latent heat of sea ice, L si , is defined (Reference YenYen, 1981) according to the total heat required to increase the temperature to the freezing point and the brine volume to 100%, so the model will include all the heat removed between the water and this isotherm.
As well as conductive flux due to the ice temperature gradient, an oceanic heat-flux term is required to account for heat transfer from the water under the ice. with ocean temperatures generally warmer than the ice, there is a positive flux into the ice, slowing growth until the ice reaches the depth where the conductive and oceanic fluxes are equal and growth stops. oceanic heat flux has been calculated directly from turbulent heat transfer in the ocean by Reference McPheeMcphee (1992), and included in growth models such as Reference Omstedt and WettlauferOmstedt and Reference Wettlaufer, Worster and HuppertWettlaufer (1992) and Reference Lytle, Massom, Bindoff, Worby and AllisonLytle and others (2000). alternatively, it can be derived from the difference between the measured latent and conductive heat fluxes (Reference Maykut and UntersteinerMaykut and untersteiner, 1971; Reference Heil, Allison and LytleHeil and others 1996; Reference Lytle and AckleyLytle and ackley 1996), which is the approach used in this paper.
In the following a localized form of the heat balance from equation (1) is evaluated at an isothermal surface of temperature T and depth H, where the thermal properties of the ice are determined and constant. balancing the latent heat from ice growth due to the isotherm velocity, dH/dt, with conduction through the temperature gradient at H and an oceanic heat flux, F w, gives:

This can be expressed as a simple model with growth split into conductive and oceanic heat-flux terms,

The conductive term is proportional to the temperature gradient, and the oceanic flux term includes all heat-transfer mechanisms through the isotherm to the ocean.
Antarctic Winter Measurements
A comprehensive winter sea-ice fieldwork programme was conducted out of scott base, mcmurdo sound, from march through august 2003. measurements included a near-continuous record of ice temperature profiles, air temperature, ocean current profiles (0–10 m), water temperature and salinity (20 and 50 m), and regular ice cores were taken for analysis of salinity, and crystal structure. further details of these measurements are reported in Reference Leonard, Purdie, Langhorne, Haskell, Williams and FrewLeonard and others (2006).
Thermistor probes were designed and built specifically for the winter fieldwork programme to record changes in daily ice growth rates associated with platelet ice formation. to achieve centimetre resolution, with expected growth rates of 1 cmd–1 or more, 60 thermistors were spaced at 1 and 4 cm intervals on the 100 cm long pvc probes. each thermistor extended 2 cm in small tubes from the probe body, to reduce the influence of the probe on the ice temperature measurements. using a campbell cr10x data logger and multiplexer, the temperature resolution was 0.0003˚c near the freezing point of sea water, and 0.003˚c over the full range of 0 to –50˚c. measuring a fixed reference resistance with each set of thermistor measurements allowed drift in the electrical circuit to be corrected, and with a single-point calibration we achieved an accuracy of about ±0.02˚c.
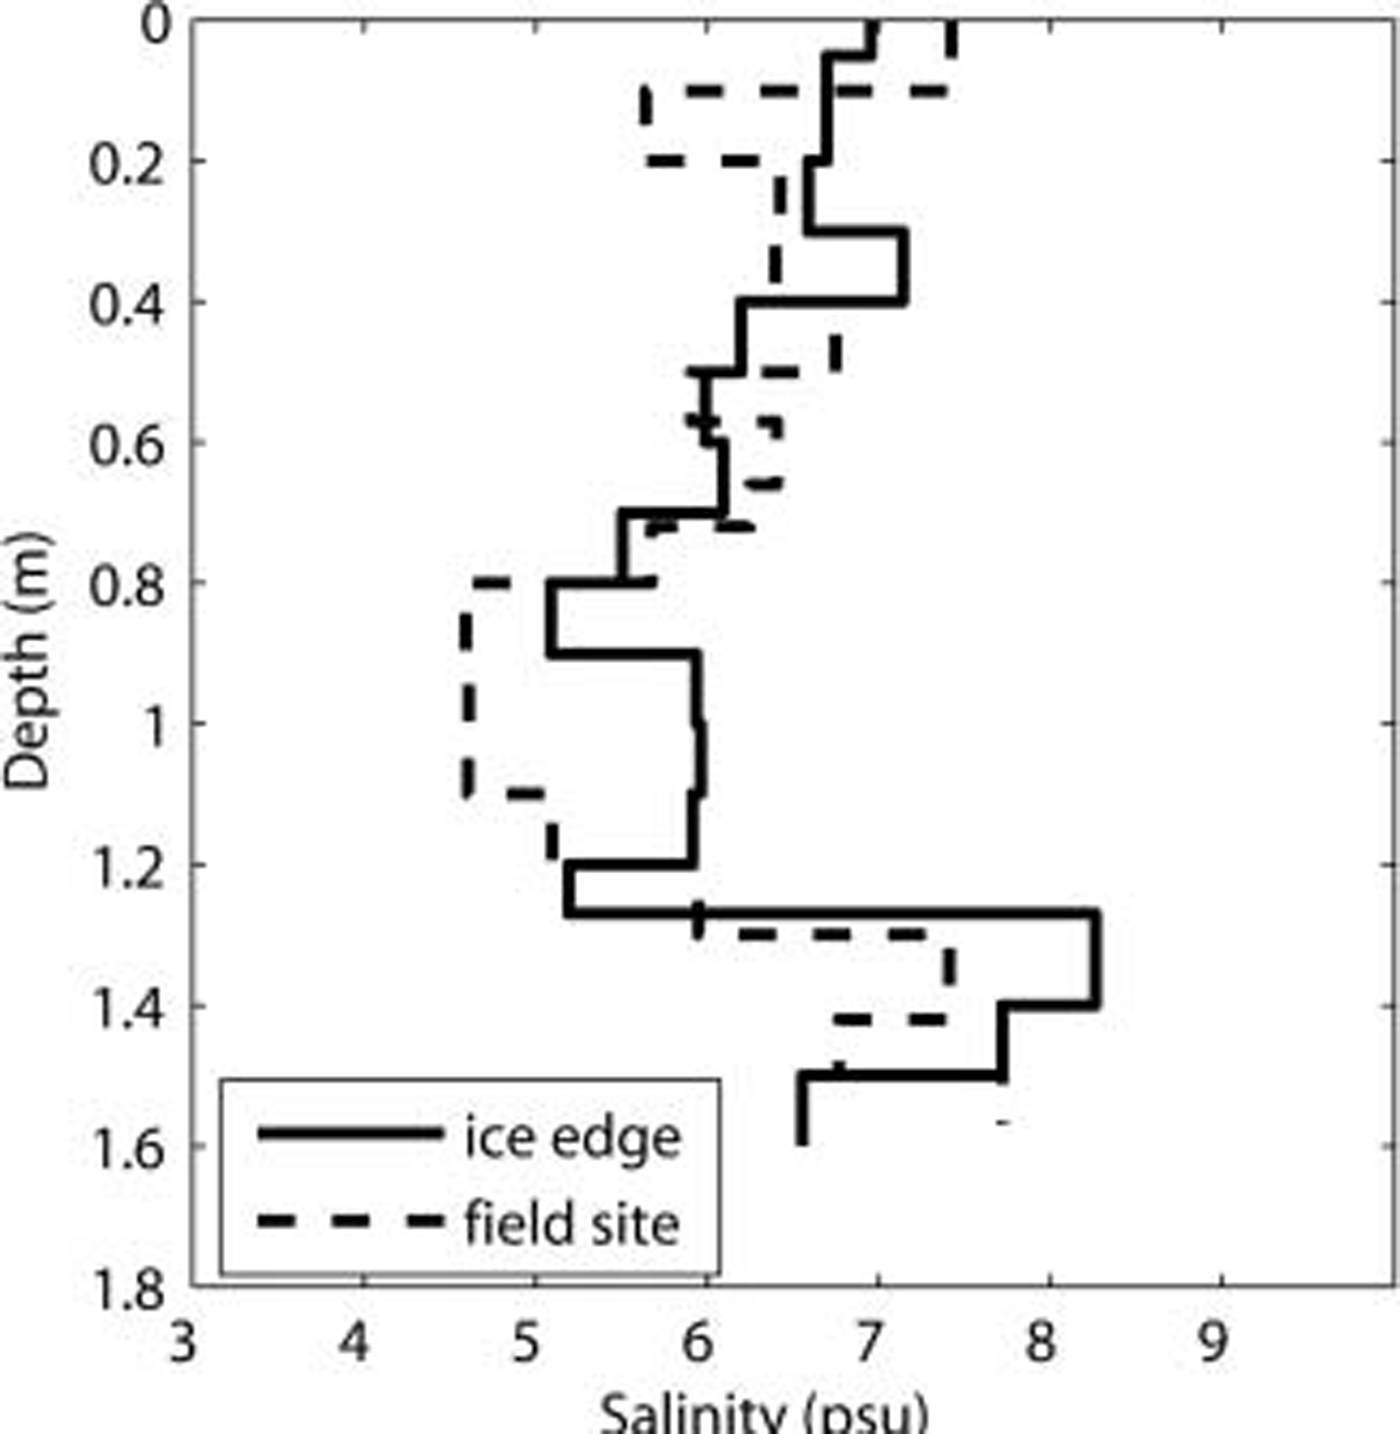
Selection of a field site location was complicated by the fact that the annual summer break-out of sea ice had left the ice edge about 40 km further north than scott base, which was too far to support regular fieldwork. the only viable site was a 300 m by 200 m turning bay cleared in the multi-year ice for the resupply fuel tanker. this was ice-free when the tanker left on 3 march 2003. the turning bay site was located 6 km northwest of mcmurdo base, well away from the coast, in water that was >540m deep (Reference Leonard, Purdie, Langhorne, Haskell, Williams and FrewLeonard and others, 2006). although surrounded by 4.3m thick multi-year ice, ice growing at this site appeared representative of true first-year ice, as can be seen from the comparison of salinity cores in figure 1.
Salinity profiles of first-year ice from the true ice edge on 5 August, and ice at the measurement site of a similar depth on 16 July. Salinities are in good agreement, and the difference in dates reflects different times of initial freezing.
The first thermistor probe was deployed at the field site when the tanker left. it was floated out about 20m from the multi-year ice edge before the newly forming ice became solid. temperatures were logged every 2 min and retrieved from the campbell data logger every few days, although the battery and storage limitations allowed measurements to continue uninterrupted for 2 weeks in the event of bad weather. a large snowdrift had covered the ice over the probe on 21 april, producing a significant decrease in ice growth and later causing the ice to become flooded. when the ice was 90 cm thick, a second thermistor probe was deployed through a small hole on 1 may.
Concurrent measurement of the underlying oceanography was made at the site during the winter, as reported in Reference Leonard, Purdie, Langhorne, Haskell, Williams and FrewLeonard and others (2006). salinity cores were taken at regular intervals, and at different locations on the first-year ice and surrounding multi-year ice. when each probe was cut out of the ice, ice fabric cores were taken to obtain the crystal structure.
Ice Growth Analysis
Thermistor probe temperatures were averaged to hourly intervals to reduce noise, and an example of the results is shown in figure 2. profiles were then smoothed to correct for calibration drift between thermistors of up to ±0.02˚c by adjusting each thermistor value according to a linear fit between nearby thermistors. outlying values were moved towards the line until a fit threshold was reached, giving the smoothed temperature and vertical temperature gradient at each thermistor. isotherm depths and vertical temperature gradients were determined by interpolation from the smoothed temperature profiles. the ice–water interface could also be approximated from each isotherm using the local temperature gradient to extrapolate from the isotherm down to the freezing point of the sea water.
Example temperatures showing individual thermistors freezing into the ice. The temperature axis is inverted, so thermistors in the water are clustered together at the base of the plot at around –1.9˚C, and thermistors at 1 cm intervals in the ice appear successively higher on the plot with decreasing temperatures. A number of brine drainage events are recorded showing dips in temperature of thermistors closer to the ice–water interface, and in particular the large series of events recorded in the week of 25 May.
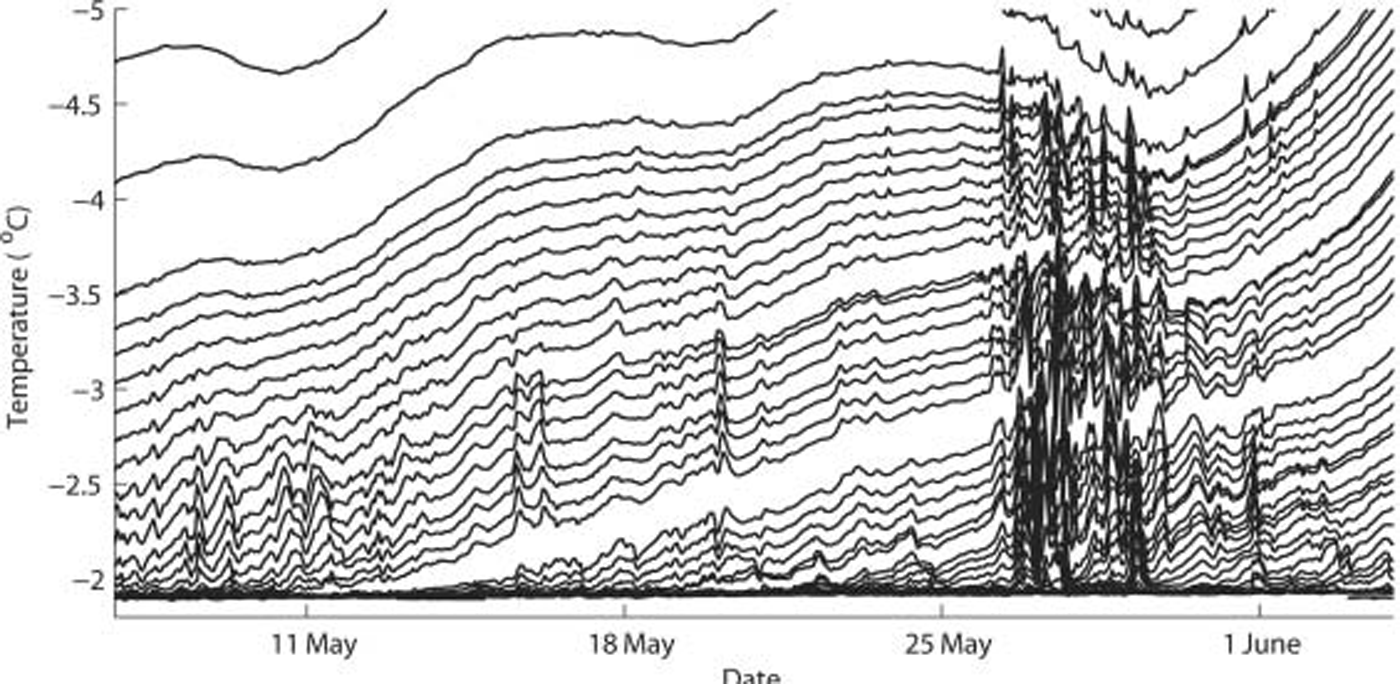
Episodes of temperature decreases correlated across several adjacent thermistors in the lower 30 cm of the ice and lasting a few hours can be seen every few days in figure 2. these are attributed to brine drainage channels, as previously reported by others (e.g. Reference Lake and LewisLake and lewis, 1970; Reference TrodahlTrodahl and others, 2000). the characteristic effect of a large brine drainage channel on the temperature profile on 26 may is shown in figure 3. at this time, significant volumes of platelet ice were observed in the water (Reference Leonard, Purdie, Langhorne, Haskell, Williams and FrewLeonard and others, 2006), but it is not known if unconsolidated platelets under the ice could have triggered the brine drainage. the deflection of isotherms by brine drainage events created significant noise in isotherm growth velocities. therefore a 5 day gaussian filter was used to smooth out these variations and other growth artefacts from isotherms crossing slightly varying thermistors every 1–6 days.
Ice temperature profiles taken around 26 May showing a significant brine drainage event which caused the measured isotherm growth velocities to appear to drop significantly below the modelled growth.

Water temperatures from the thermistor probes can be compared with independent measurements made at the ice–water interface of –1.884±0.001˚c (19 april) and –1.917±0.001˚c (14 july), reported in Reference Leonard, Purdie, Langhorne, Haskell, Williams and FrewLeonard and others (2006). this compared well with smoothed thermistor probe water temperatures ranging from –1.86±0.02˚c from the first probe in april to –1.94±0.02˚c from the second probe in early july. an uncertainty of ±0.02˚c in temperatures, combined with a typical ice temperature gradient of 10˚cm–1, gives an uncertainty in isotherm depths of only ±0.002 m.
figure 4. shows some calculated temperature contours and the inferred ice–water interface depth, which compares well with depths measured from ice cores taken nearby. there are times, particularly in april and june, when temperature contour spacing changes and the temperature gradient near the ice–water interface is not constant. the growth rate at the first probe was significantly reduced from 20 april when a snowdrift 50 cm deep covered the top of the first probe.
Ice temperature contours and the extrapolated ice–water interface depth taken from two thermistor probes compared with ice depths measured from cores around the site. The discontinuity separating the first and second thermistor probe temperatures is due to the build-up of snow above the first probe inhibiting growth.

The thermal properties of ice in equation (3) require the salinity to be well defined, as well as the temperature. this is not possible for the bottom 5–10 cm of the ice core where the high porosity allows brine to drain when extracting cores, causing salinity there to be significantly underestimated. this high porosity near the ice–water interface also allows brine movement and therefore heat transfer through advection and convection (Reference Wettlaufer, Worster and HuppertWettlaufer and others, 1997). ice salinity profiles were measured at the site through the winter with 10 cm depth samples, and show the salinity about 10cm above the ice–water interface was generally in the range 5–7 psu (practical salinity units). the –3.0˚c contour was selected to define the depth, H, for growth analysis because it was approximately 10cm above the ice–water interface, where the salinity was measured accurately. brine volume at –3.0˚c and 6±1 psu is 0.097±0.015, calculated from Reference Cox and WeeksCox and weeks (1983). although this is above the percolation threshold (Reference Golden, Ackley and LytleGolden and others, 1998) allowing brine movement through the ice, experiments such as Reference Niedrauer and MartinNiedrauer and martin (1979) indicate that the effect on heat transport at this level is minimal.
The physical properties of sea ice were determined at a temperature of –3.0˚c and salinity of 6±1 psu for use in the growth model equation (3). an upper limit on density of 925 ±2kgm–3 was calculated from Reference YenYen (1981) for gas-free sea ice. assuming minimal gas volume near the ice–water interface, a density ρ si = 920±5 kgm–3 was adopted, which agrees well with measured values reviewed in Reference Timco and FrederkingTimco and frederking (1996). thermal conductivity was determined as k si = 1.89±0.04wm–1 ˚c–1 according to a parameterization k si = 2:09 - 0:011 T + 0:117S/T by Reference PringlePringle (2004). the latent heat of fusion for sea ice was calculated according to Reference YenYen (1981) as L si = 303±6×10³ j kg–1. using these values in equation (3) to calculate the conductive growth coefficient, k si/ρ si L si, gives a value of 6.78±0.04×10⁻⁹m2 s–1 ˚c–1, which is equivalent to ice growth of around 6mmd–1 for a typical ice temperature gradient of 10˚cm–1.
Temperature gradients at the –3.0˚c contour were used to model the ice growth expected from heat conduction in equation (3). this model growth is shown in figure 5, compared with the growth velocity measured by the change in depth of the –3.0˚c isotherm with time. although growth measured by the isotherm velocity generally agrees with the conductive model, there are significant deviations.
Ice growth velocity recorded by the –3.0˚C contour and the extrapolated ice–water interface, compared with that expected from the model of heat conduction up through the ice.

Deviations where growth velocities were less than in the conductive model, particularly in april, were found to be anomalous effects of extremely large changes in air temperature propagating down through the ice. on 20 april a snowdrift 0.5 m thick covered the ice, abruptly increasing temperature down the entire ice profile and causing the dip in isotherm velocity and conductive growth shown in the model. a large decrease in the temperature gradient when the ice warms moves the temperature contours up relative to the ice–water interface, which results in an apparent decrease in growth, that is reversed when the ice is cooled down again. the dip in growth on 26 may is also anomalous due to the temperature changes caused by the large brine drainage event shown in figure 3.
Large increases in the isotherm growth velocities in june and the higher average values from july onwards are clearly not related to the conductive model and must be due to a negative oceanic heat flux. the required oceanic heat flux from equation (3) is shown in figure 6, giving a peak negative flux of about –30wm–2 and the average after july around –5wm–2. a negative heat flux producing extra growth is unusual, with similar models for other locations deriving positive oceanic heat fluxes which limit ice growth. in mcmurdo sound, however, Reference Crocker and WadhamsCrocker and wadhams (1989) estimate that an oceanic heat flux of –24wm–2 over 60 days was required to grow the 1 m deep layer of loose platelets observed under the sea ice.
Oceanic heat flux required from the ice growth model compared with potential surface supercooling in the water at 20m depth (10m before 23 May) from Reference Leonard, Purdie, Langhorne, Haskell, Williams and FrewLeonard and others (2006), and spot measurements within 0.15 m of the ice–water interface. Potential surface supercooling is the difference between the potential temperature, θ, of the water (temperature if moved to the surface adiabatically) and the surface freezing point, T f. The 10/20m potential supercooling is smoothed with the 24 hour mean filter.

Previous oceanic heat-flux calculations from measured ice growth using temperature profiles include Reference Lytle and AckleyLytle and ackley (1996) reporting +7±2wm–2 in weddell sea pack ice from february through june 1992. Reference Heil, Allison and LytleHeil and others (1996) used an ice growth model combined with ice depth measurements to calculate oceanic heat fluxes averaging +0.3 to +7wm–2 beneath landfast sea ice over winter from 12 individual years data between 1958 and 1986. Reference Omstedt and WettlauferOmstedt and wettlaufer (1992) showed good agreement between oceanic heat flux measured from ice growth and calculated from turbulent heat exchange at the ocean boundary. we observe that their peak oceanic heat fluxes of around +30wm–2 corresponded to turbulent heat exchange with a water temperature difference of 0.2˚c above freezing. comparing this to our flux of –30wm–2 and observed surface supercooling of –0.014˚c (fig. 6), turbulent heat-transfer coefficients would have to be an order of magnitude higher to explain the oceanic heat flux.
Ice growth from turbulent heat exchange with the water is related to the temperature difference between the water and its freezing point (Reference Omstedt and WettlauferOmstedt and wettlaufer, 1992). however, a comparison of the required oceanic heat flux with potential surface supercooling measured at the site shown in figure 6 fails to show any direct correlation. water temperatures and salinity at 20m depth from Reference Leonard, Purdie, Langhorne, Haskell, Williams and FrewLeonard and others (2006) were converted to potential temperature and freezing point at the surface to calculate the potential surface supercooling. the most significant negative oceanic heat-flux events occur in june without increases in supercooling, and supercooling peaks in may, july and august occur when there was minimal heat flux to the ocean. supercooling at the ice–water interface was only measured directly a few days each month, but followed the general trend of the supercooling from 20m depth, increasing later in the winter, and does not match the changes in oceanic heat flux.
Another potential cause of oceanic heat flux is latent heat due to platelet ice crystals already suspended in the water arriving from under the ice shelf. large episodic increases in acoustic signal detected by the current profiler at the site were attributed to ice crystals suspended in the water and were shown to correlate with water supercooling at 20m (Reference Leonard, Purdie, Langhorne, Haskell, Williams and FrewLeonard and others, 2006). although this evidence of suspended ice crystals does not coincide with episodes of negative oceanic heat flux, unconsolidated platelets trapped under the ice by buoyancy could later become incorporated into ice growth.
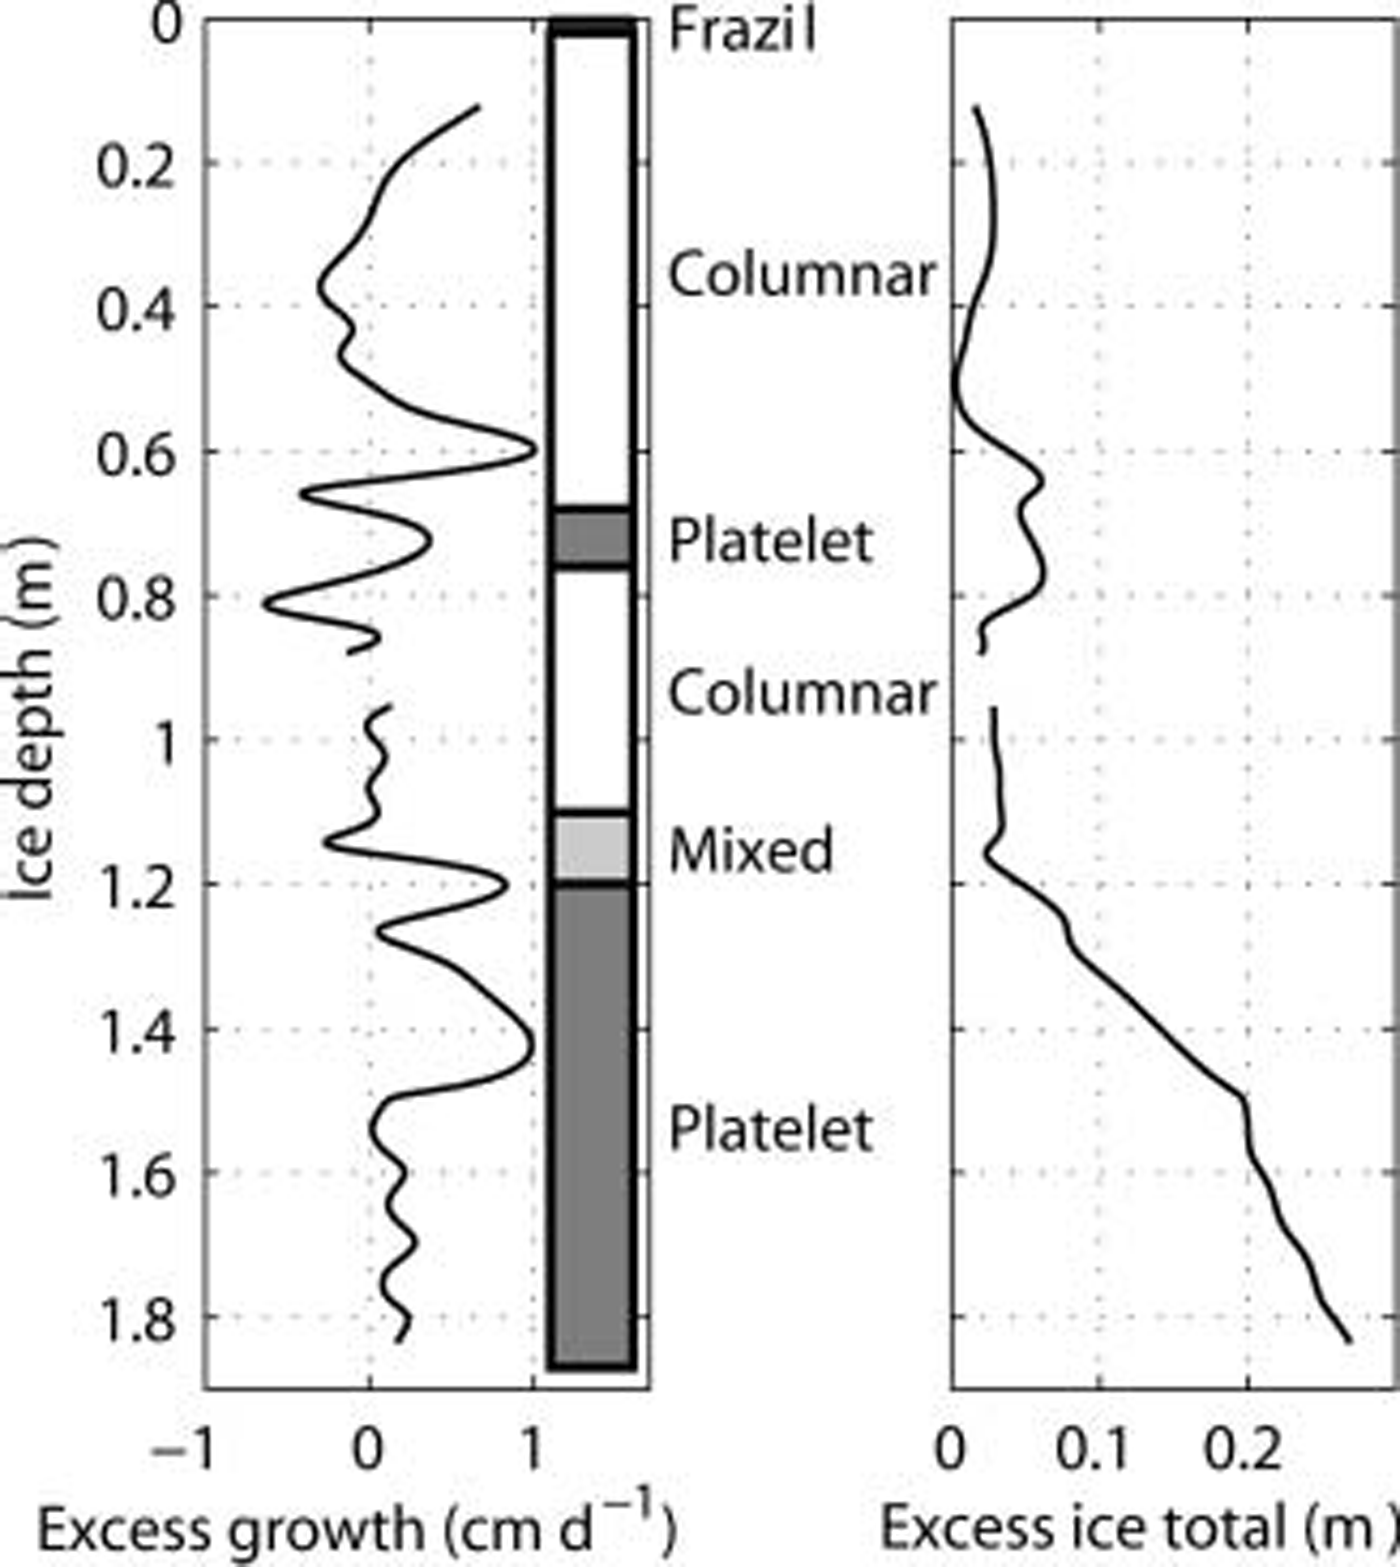
Residual ice growth from oceanic heat flux is compared with the appearance of platelet ice in cores in figure 7. episodes of additional ice growth at 0.6m appear 0.1 m before the band of incorporated platelet ice in the core, but the increase in growth in june corresponds with the main onset of platelet ice in the core at 1.1 m. this is even clearer when considering the cumulative growth from the oceanic heat flux, which is also shown in figure 7. from the onset of platelet ice at 1.1 m, it can be seen in figure 7 at the integrated oceanic heat flux accounts for approximately 0.25 m growth out of the 0.7 m of platelet ice in the core. the implication is that about 35% of the growth of platelet ice is due to oceanic heat flux, with the remaining 65% due to heat conduction through the ice. this agrees with deductions made from previous measurements in mcmurdo sound by Reference TrodahlTrodahl and others (2000), showing oceanic heat flux coincides with the onset of platelet ice in cores at 1.4 m, and is responsible for an estimated one-third of the platelet ice growth.
Profile showing the residual measured ice growth rate due to oceanic heat flux (left), and its cumulative effect on ice thickness (right). These are plotted as functions of ice–water interface depth for comparison with ice crystal structure observations from an ice core (centre).
Conclusions
Temperature profiles of first-year landfast sea ice have been recorded continuously over the winter growth season at mcmurdo sound. using directly measured temperature gradients in the ice to model conductive growth, it has been shown that heat conduction through the sea ice was insufficient to account for the observed ice growth rates. according to a simple heat-transfer model, the extra growth requires periods of substantial negative oceanic heat flux, down to –30wm–2. this oceanic heat flux did not appear to correlate directly with supercooling recorded in the water column over winter. although turbulent heat transfer has not yet been modelled explicitly, the small water temperature gradients measured would require a large heat-transfer coefficient to account for the significant oceanic flux. this will be the subject of future work.
An unusual feature of sea ice in mcmurdo sound is the presence of large amounts of platelet ice both incorporated into the first-year ice profile, and also observed suspended in the water column under the ice, or becoming attached to objects lowered into the water. oceanic heat-flux growth appeared to coincide with the onset of platelet ice in cores, and accounts for about 35% of the total platelet ice growth, which is in good agreement with previous estimates.
The question remains whether the negative oceanic heat flux represents a growth of platelet ice in situ from turbulent heat transfer, or platelets rising from a plume grown under the ice shelf. although supercooling observed in the water allows for growth in situ, surprisingly there is no direct correlation with the oceanic heat flux. evidence of ice platelets suspended in the water, while not directly correlated with oceanic heat flux, could indicate unconsolidated platelets already trapped under the ice at the onset of platelet ice growth. it is likely that the observed oceanic heat flux is a combination of the above growth processes. at present, we are unable to determine the ratio of in situ platelet ice growth to frazil ice growing suspended in water from beneath the nearby mcmurdo ice shelf.
Acknowledgements
The authors would like to thank j. leitch for field support, the 2003 winter-over crew at scott base, antarctica new zealand, the electronics technicians in university of otago physics department, and c. petrich for insightful discussion. we are grateful to the new zealand marsden fund and to the foundation for research science and technology for financial support.



