INTRODUCTION
Mathematical models of biological systems are designed to emulate biological phenomena (Ford Reference Ford2009). As understanding of the intricacies governing biology deepens and available computational methods have become more sophisticated, the use of models to test hypotheses has greatly expanded (Waterman & Lander Reference Waterman and Lander1995). To appropriately represent biology, careful parameterization of these models is essential (Baldwin Reference Baldwin1995; Ford Reference Ford2009). Models which predict nutrient requirements of livestock based on performance targets (National Research Council 2000, 2001, 2012) are a primary application within animal nutrition.
A challenge with nutrient requirement models is the timeline required to consolidate scientific understanding into reliable quantifications. Scientific understanding proceeds in stages with initial knowledge coming in binary form generally indicating a presence or lack of response to stimuli. Later knowledge extends the binary information to response curves and eventually multifactorial response surfaces. Until the second step is achieved, a model cannot be developed, and until the third step is reached, models will be limited in application. In many cases, the mechanisms of biological response to various stimuli are similar across species. For example, mammals and poultry employ nearly identical primary thermoregulatory mechanisms (Herreid & Kessel Reference Herreid and Kessel1967; Chaffee & Roberts Reference Chaffee and Roberts1971; Aschoff Reference Aschoff1981; Nagy et al. Reference Nagy, Girard and Brown1999; Hohtola Reference Hohtola, Barnes and Carey2004). When biological mechanisms are similar, it may be possible to use cross-species (CS) data for parameterizing models, specifically when species-specific (SS) data are limited or unavailable.
The objectives of the current study were (1) to compare and model intake responses to temperature for several livestock species and (2) to assess opportunities to use CS data to parameterize models when SS data were limited. Based on reviews of feed intake regulation in livestock and poultry species (Baile & Forbes Reference Baile and Forbes1974; Denbow Reference Denbow1985; Nyachoti et al. Reference Nyachoti, Zijlstra, de Lange and Patience2004), intake response to temperature stress was used as a focus because the regulatory responses were expected to be similar. It was hypothesized that similar standardized responses to temperature would be observed across species and that CS data could be used to develop more robust predictions of feed intake responses when SS data were limited.
MATERIALS AND METHODS
Literature search
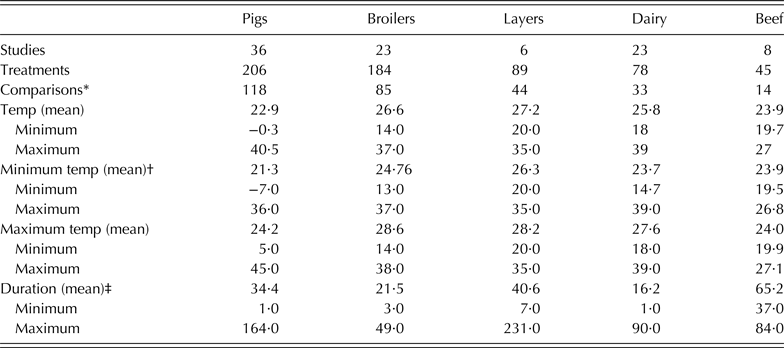
A literature search of the Agricola database was performed to identify studies that measured feed intake for animals in a thermoneutral (TN) control treatment and a treatment where temperature was outside the TN zone. The TN zone is the range of temperatures within which an animal does not have to expend energy to maintain body temperature (Kingma et al. Reference Kingma, Frijns and van Marken Lichtenbelt2012). A TN control treatment was identified as such if it was defined as a TN control group within a study. The variable definition of a TN control treatment was necessary because critical temperatures vary by species, age and production stage. The Google Scholar search tool was also used to identify resources available in the databases accessible from the Virginia Tech library. Keywords used in these searches were ‘(species), intake and (stress)’ where species included ‘swine, pigs, poultry, chickens, broilers, layers, cows, dairy and cattle’ and stress included ‘heat stress, cold stress and ambient temperature’. Additional searches through the Journal of Animal Science, Journal of Dairy Science and Poultry Science were conducted using the same keywords, refined by species. Inclusion of studies in the data set required that both intake and ambient temperature were reported. The experiment also needed to be designed such that one or more treatments with temperature outside the TN zone and one or more treatments within the TN zone were reported. This inclusion criterion was employed because the response variable of models was thermally stressed intake expressed as a fraction of TN feed intake. As such, each thermally stressed intake data point needed a corresponding TN intake measurement (TN comparison). The initial literature search also included beef cattle; however, insufficient data (12 TN comparisons at two temperatures) were available. The number of TN comparisons identified by animal species is listed in Table 1. The data set included 614 treatment means from 108 studies. From those studies, 280 comparisons with TN feed intake were identified. Pigs and broilers had the largest number of comparisons, with dairy and layers having fewer comparisons (Table 1). The data used are available online at the National Animal Nutrition Program (2014a) website.
Number of studies, treatments and thermoneutral comparisons identified across species

* Number of comparisons to a thermoneutral control (intake at thermal stress divided by intake at thermoneutral) identified within the data set. These comparisons are the fractional feed intake data used as the primary modelled response variable.
† Temperature (temp) given in °C.
‡ Duration of exposure temperatures outside the thermoneutral zone (d).
Assessment of available data
Within each study, one or more TN treatments were identified. Feed intake under each corresponding environmental stress treatment (Intake) was then expressed as a fraction of intake at TN (TNI):
 $${\rm FFI} = Intake/TNI.$$
Fractional feed intake (FFI) was used as a primary response variable to ensure the intake response variable was numerically similar across studies and species. This approach was also congruent with most nutrient requirement system feed intake equations where a baseline intake is predicted and environmental factors are applied as a multiplicative scalar. A FFI value of 1 therefore results in no change in intake from the predicted TN intake. Intake depression occurs at FFI values less than 1, and intake stimulation at FFI values greater than 1.
Calculating FFI in such a manner implies that the response within the TN zone is always 1 and has a variance of 0 with no slope. These assumptions may be inaccurate. To more completely represent the dynamics within the TN zone, adjusted TN intakes were calculated as:
 $${\rm FF}{{\rm I}_{{\rm TN}}} = 1 - (1 - TNI/TN{I_{{\rm mean}}}) \times adj,$$
where adj was given a value of 0·15 (calculated from the measured data). This value represented the within-study standard deviation as a fraction of mean TNI. This adjustment preserved the variance in the original data and accommodated any slope within the TN zone. Only a portion of the total variance in TNI was retained because body weights (BWs), age, stage of production and other between-study differences resulted in substantial differences in FFITN. Although the species differences in intake could have been accounted for by using a mixed model with random effects for species and study, the authors were most interested in parameterizing equations that could eventually be implemented in nutrient requirement models and random effect variables would limit this opportunity.
The SS data were aggregated to yield a CS data set. Within the CS data set, treatments were categorized according to whether they reflected cold stress, TN, moderate heat stress or heat stressed environments. Fitting CS equations was most likely to be successful if, across species, similar explanatory variables were well correlated with FFI. If common explanatory variables could not be identified, fitting a CS equation would likely be inappropriate. To identify possible common explanatory variables across species, correlations were calculated between all variables within each data set and used to inform the functional form of FFI response equations.
Assessing viability of cross-species model fitting
A fixed effects analysis of variance was performed on CS to identify whether the effects of species (broiler, layer, dairy or pigs), environment type (cold stress, TN, moderate heat stress or heat stress) or the interactions between species and environment were significant. Tukey's pairwise comparisons were used to identify which species and temperatures were significantly different.
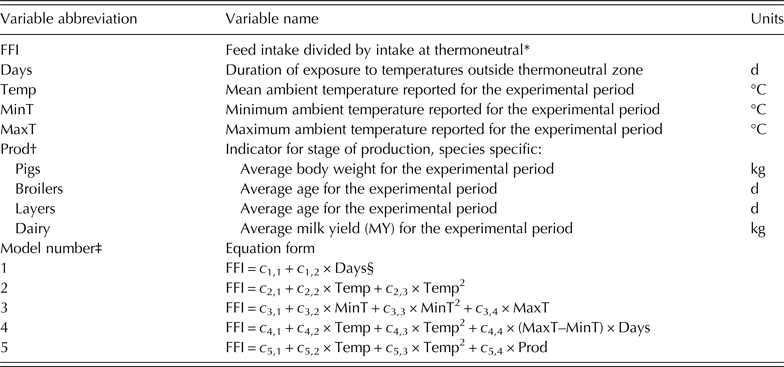
Four models were then derived from both the CS and SS data sets. An additional model accounting for temperature and production stage effects was derived from the SS data. This model was not derived from the CS data because unique indicators of production stage were identified and could not be effectively standardized across species. Although multiples of maintenance energy required for production may be a useful way to standardize across species in future analyses, the stage of production data available in the current study (ages, BW and milk yield) did not lend themselves to this standardization approach as some (age) were not directly correlated with multiples of maintenance. The models and their parameters are defined in Table 2. All model fitting and relevant statistical analyses were conducted using R statistical software (R Development Core Team 2014). Examples of the code used in this analysis are included on the National Animal Nutrition Program (2014b) website.
Variable and model definitions for equations prediction fractional feed intake across species
* Thermoneutral intake was defined as a treatment reported within a study as a thermoneutral control.
† Stage of performance was referred to by a common variable name (Per) across species; however, unique types of data were used for each species.
‡ Model numbers are used to refer these different models of fractional feed intake (FFI)
§ Model coefficients (c i,j) are labelled with the model number (i) and the coefficient number (j) within the model.
For each FFI treatment mean, the models were used to predict FFI and this modelled FFI was compared with measured FFI values. For each species, the root mean squared error of prediction (RMSPE), concordance correlation coefficient (CCC) and corrected Akaike information criteria coefficient (AICc) were calculated (Willmott Reference Willmott1981; Lin Reference Lin1989; Hurvich & Tsai Reference Hurvich and Tsai1993). The SS- and CS-based model RMSPE and CCC were then compared for each species and model.
Model forms were selected to demonstrate a wide range of goodness of fit. Model 1 was designed to be a relatively poor prediction as it did not include a temperature term. Models 2, 4 and 5 were based on a quadratic relationship with temperature. A quadratic response to temperature was employed because animals likely have some physical maximum intake due to digestive tract space limitations and at extremely high temperatures, animals stop eating altogether. An initial comparison of linear and quadratic temperature models suggested lower RMSPE and higher CCC for the quadratic fit (White et al. Reference White, Miller and Haniganin press). The residuals of the quadratic model were assessed against additional explanatory variables available within the data set. Residuals patterned systematically against maximum temperature and stage of production, thus, additional effects for these parameters were added in Models 4 and 5. Residuals patterned very clearly against stage of production and thus Model 5 was expected to have the best predictive capacity. There is some evidence to suggest that minimum temperature governs animals’ responses to temperature as responses to heat stress in environments with temperature cycling or night cooling differ from environments with constant hot temperatures. To better characterize this response Model 3 was designed to assess a baseline response to minimum temperature. The residuals of this quadratic response to minimum temperature patterned against the product of duration of exposure to temperatures outside TN and the difference between minimum and maximum temperatures and so this effect was also included in the model. Based on the known interactions between temperature and humidity in governing most species’ reactions to thermal stress, a humidity term ideally should have been included in one or more models. Unfortunately, less than half the studies reported relative humidity and thus a relationship between relative humidity and intake could not be identified. This exclusion of relative humidity is a limitation of the models derived in the current study.
RESULTS
Simple correlations
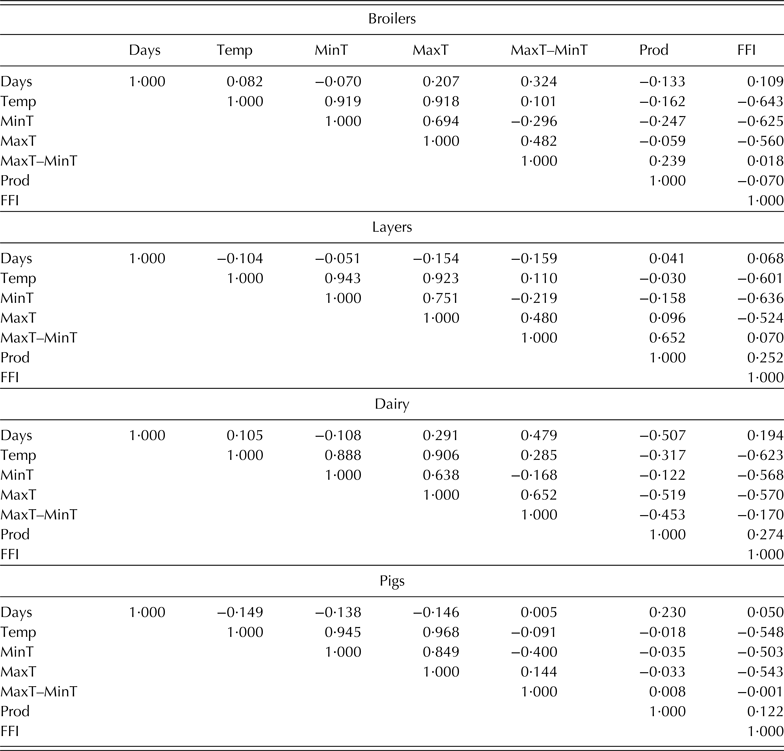
Simple correlations between explanatory variables were calculated (Table 3). Explanatory variables were not well correlated with one another with the exception of mean, minimum and maximum temperatures. Duration of exposure to temperatures outside TN explained very little variance in FFI for pigs and layers (R = 0·07 and 0·07) and explained a small proportion of the variability in dairy cattle (R = 0·19) and laying hens (R = 0·11) FFI. Mean, minimum and maximum temperatures showed strong, negative correlations with FFI in all species (−0·50〈R〉−0·64).
Analysis of variance
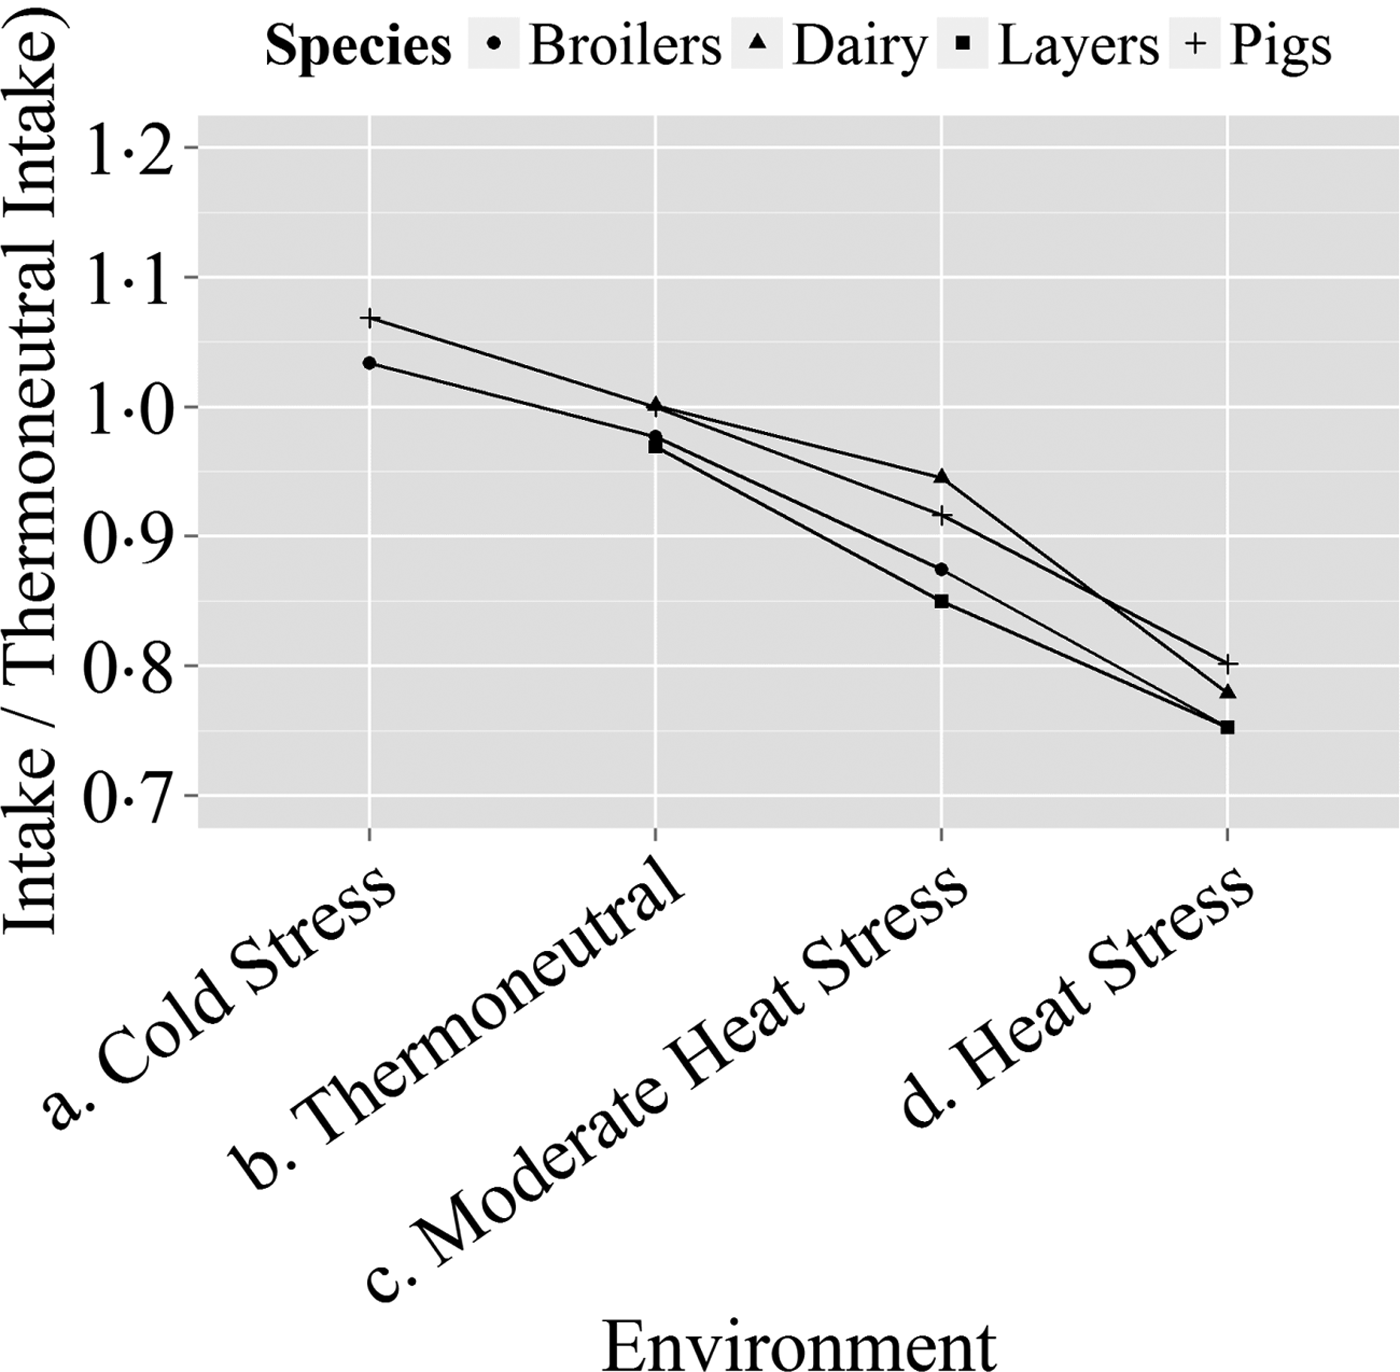
The analysis of variance indicated that the temperature and species main effects were significant (P < 0·001). No species by temperature interaction could be detected (P = 0·162) indicating that the slope of the response to temperature did not differ across species. The least-squares means for each temperature by species combination are presented in Fig. 1. The FFI for all levels of temperature were significantly different from each other (P < 0·001), except cold stressed FFI was not significantly different from TN FFI. Pigs and dairy cattle were significantly different from each other (P < 0·001), and pigs and laying hens were significantly different from each other (P < 0·001). Although these differences were statistically significant, they represented small numerical differences (6–7%) given the variability in the data.
Mean fractional feed intake observed for different species during cold stress, thermoneutral conditions, moderate heat stress and heat stress.
Comparing cross- and within-species models
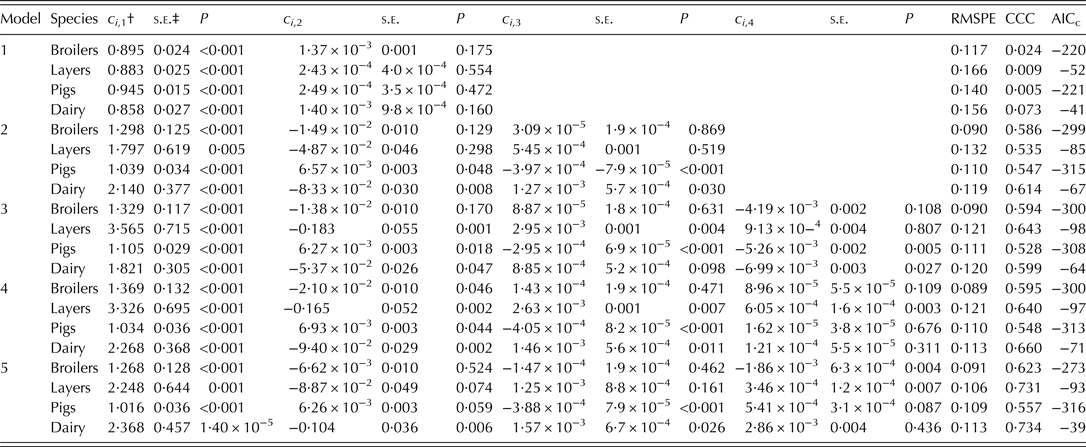
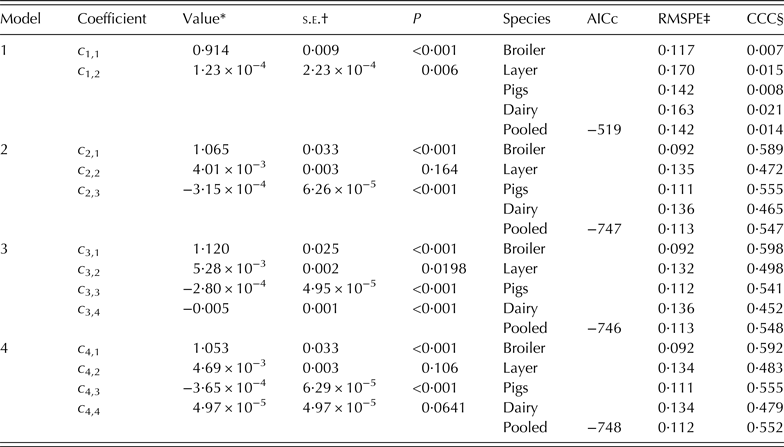
The AICc, RMSPE and CCC for the models derived from SS data are included in Table 4. The largest RMSPE was 16·6% for Model 1 in layers and the smallest RMSPE was in broilers (Model 4; 8·9%). The CCC for the models mirrored RMSPE (Table 4) with the exception of Model 1, where the RMSPE was insufficiently sensitive to detect the poor accuracy and precision identified with the CCC. Rankings based on AICc differed from rankings based on CCC. The coefficients and the AICc, RMSPE and CCC for the models fit from CS are included in Table 5.
Parameter estimates and fit statistics for each model derived from species-specific data*
* Root mean squared prediction error (RMSPE), concordance correlation coefficient (CCC) and corrected Akaike information criteria (AICc) were used to compare models.
† Coefficients (c i,1, c i,2, c i,3, c i,4) are model(i)-specific and defined in Table 2.
‡ Standard errors (s.e.) for each coefficient.
Parameter estimates for each model fit from the cross-species data set
* Coefficients (c i,1, c i,2, c i,3, c i,4) are model(i)-specific and defined in Table 2.
† Standard errors (s.e.) for each coefficient.
‡ Root mean squared prediction error (RMSPE) for each model and species combination expressed as a proportion of thermoneutral intake.
§ Concordance correlation coefficient (CCC) for each model and species combination.
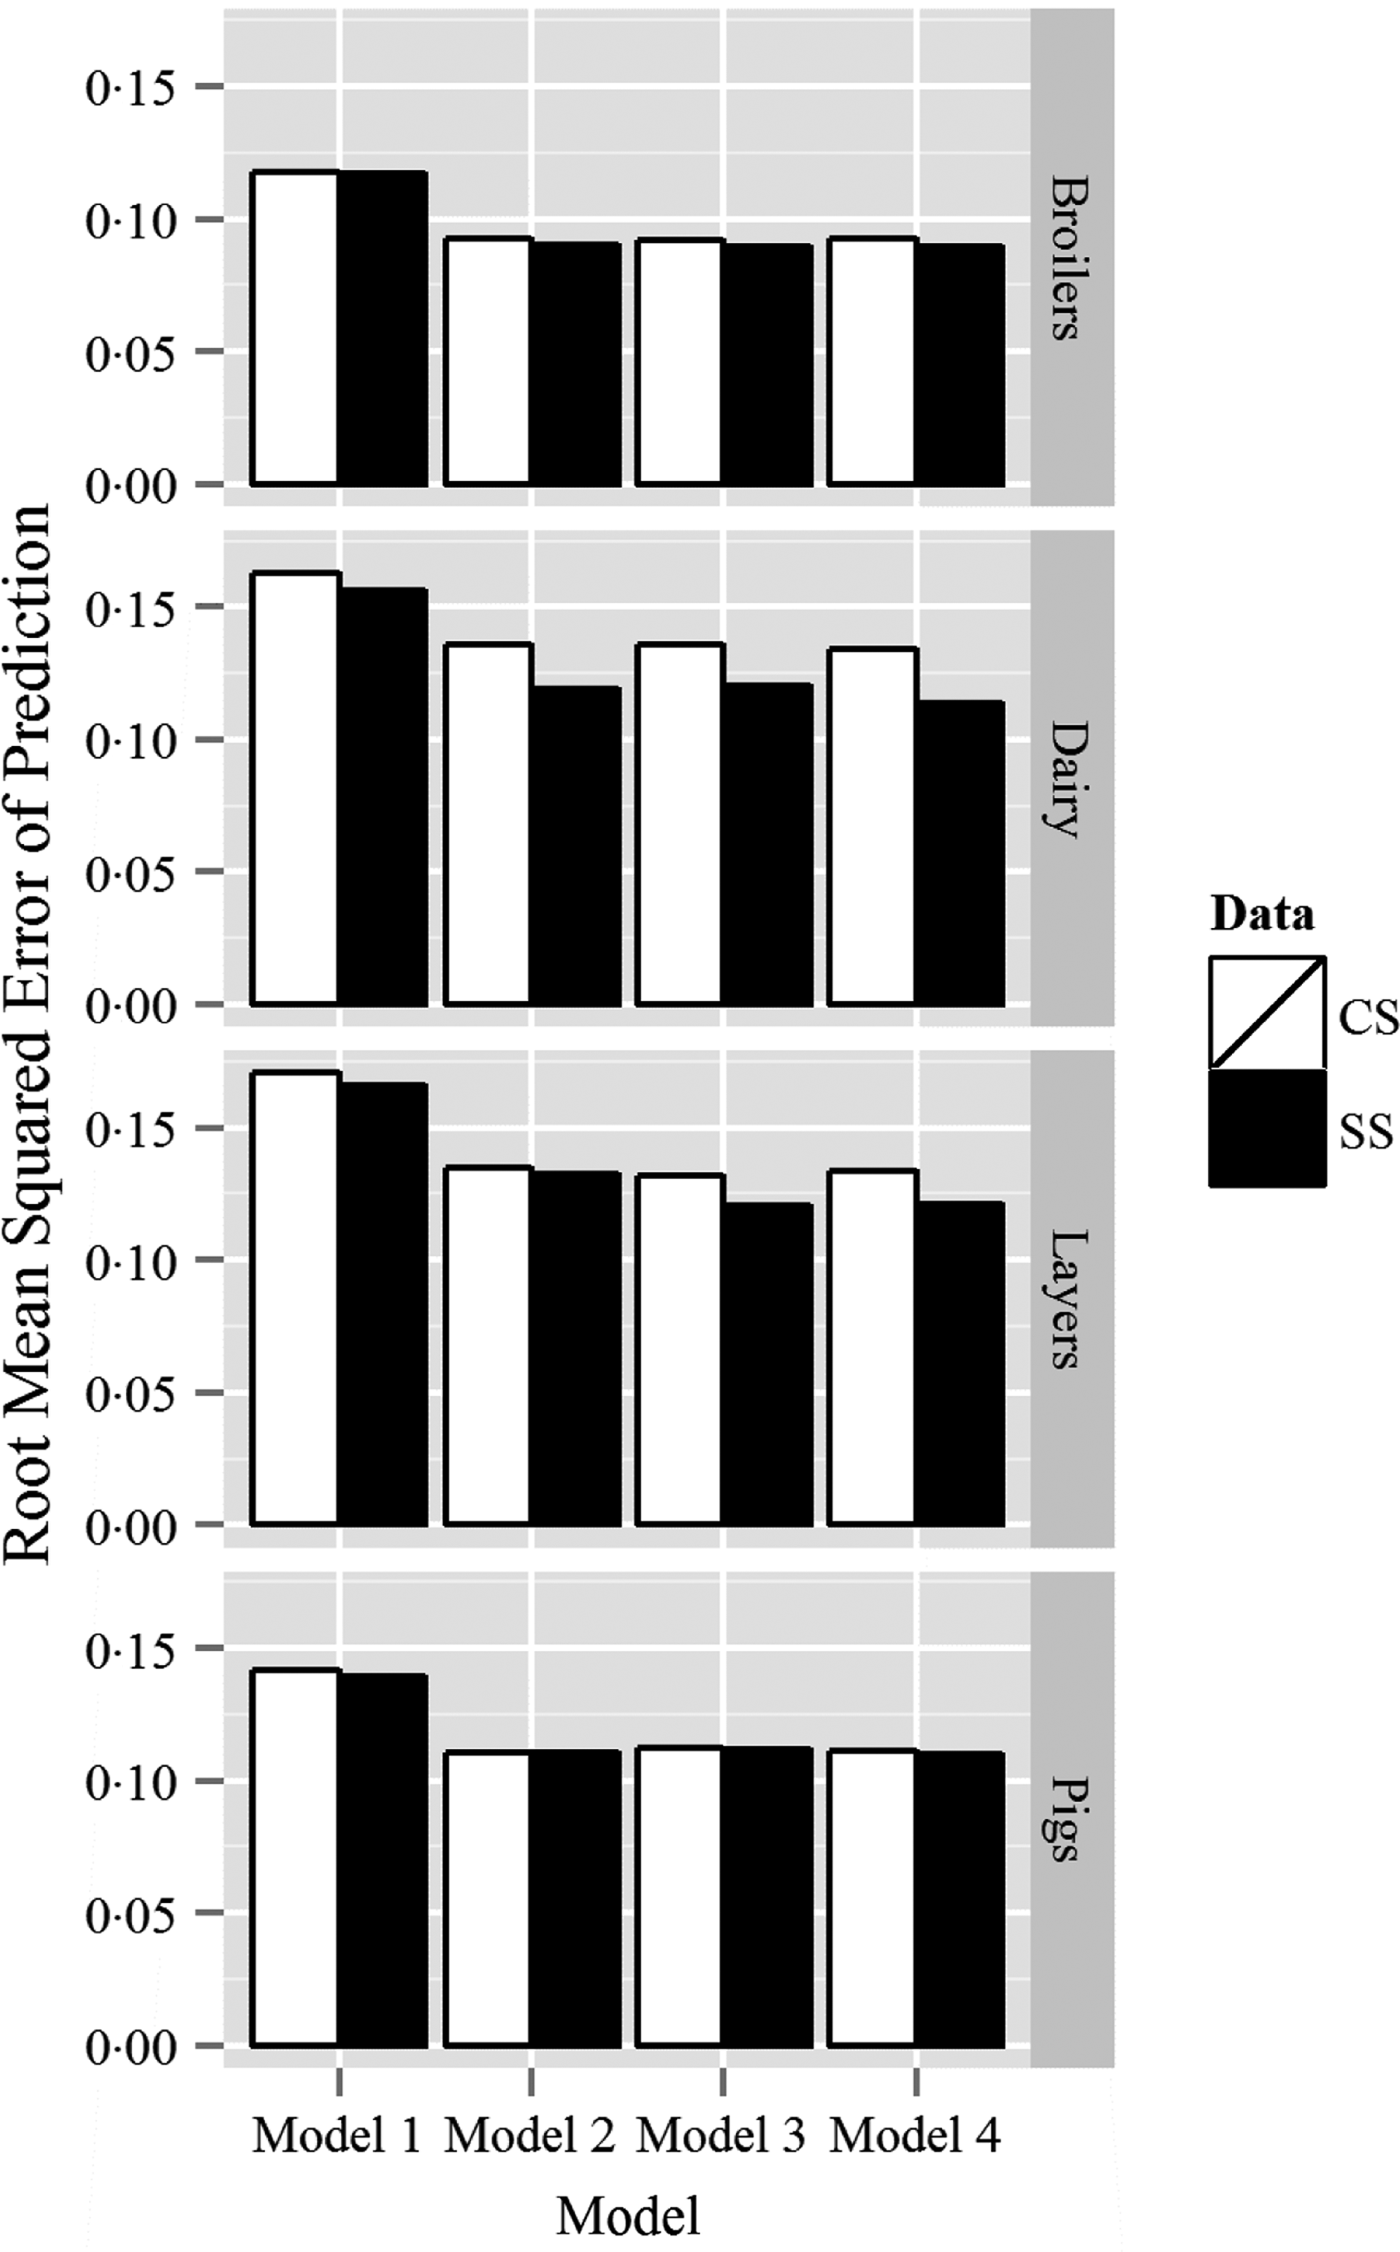
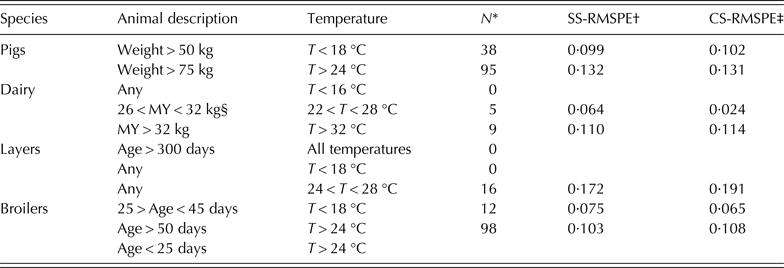
The RMSPE and CCC for models derived from CS data were nearly equal to those for equivalent models derived from SS data (Fig. 2). A summary of the identified knowledge gaps is listed in Table 6. Within these knowledge gaps, RMSPE from the CS-derived models was often lower than the SS-derived models indicating that using CS data to fill in a data set may be preferable to extrapolating an equation across a range where minimal data were available during fitting.
Root mean squared prediction error for models derived across species (CS) or within species (SS).
Notable knowledge gaps within current assessments of livestock feed intake responses to heat and cold stress and comparison of model prediction error from data within temperature range
* Number of observations (n) available within temperature range. These values were used for calculating root mean squared error of prediction (RMSPE) as a proportion of thermoneutral intake. No constraints on animal description were included.
† Species-specific (SS) derived model RMSPE based on predictions from Model 4.
‡ Cross-species (CS) derived model RMSPE based on predictions from Model 4.
§ Milk yield (MY) was used as a performance indicator within the dairy data set.
DISCUSSION
Correlations
During initial exposure to heat stress, FFI was expected to be low, indicating severe initial feed intake depression. As animals acclimated to temperature stress, FFI was expected to recover and gradually increase with time. In all species, the correlation between duration of exposure to temperatures outside the TN zone and FFI was positive, which supports this acclimation hypothesis. Acclimation has been defended in many species (Chaffee & Roberts Reference Chaffee and Roberts1971; Verhagen Reference Verhagen1987; Renaudeau et al. Reference Renaudeau, Huc and Noblet2007, Reference Renaudeau, Collin, Yahav, de Basilio, Gourdine and Collier2012). Although dairy cattle studies over several years have shown moderate adaptation (Arrillaga et al. Reference Arrillaga, Henning and Miller1952), short-term studies testing acclimation are limited. Duration of exposure to temperatures outside the TN zone was more strongly correlated with FFI in dairy cattle, compared with the other species. Although this correlation may suggest that dairy cattle acclimate more effectively than do other species, it is most likely an artefact of the data. Only one dairy cattle study assessed heat stress over several months; that single long-term study also reported higher FFI as a result and, may have artificially exacerbated variability in FFI with respect to duration of exposure to temperatures outside the TN zone. Additional studies on dairy cattle adaptation and acclimation to temperature stress are needed to elucidate a more reliable relationship.
Temperature was expected to correlate well with FFI. Cold-stressed animals increase intake to improve energy availability (Bukowiecki et al. Reference Bukowiecki, Collet, Follea, Guay and Jahjah1982) and heat-stressed animals decrease intake to minimize maintenance heat increment (Close & Mount Reference Close and Mount1978). The expected correlation was observed in all species. Mean temperature correlated more strongly with FFI than minimum or maximum temperatures, suggesting average heat load had a greater impact on intake than temporary temperature abatement in the form of lower minimal temperatures (night cooling). While minimum and maximum temperature had similar strength of correlation in other species, boiler FFI was more strongly correlated with minimum temperature, suggesting that night cooling may be particularly important for growing birds (Segura et al. Reference Segura, Feddes and Zuidhof2006).
Feed intake responses to temperature
Differences by species
The analysis of variance suggested that only slight (6–7%) differences in FFI existed between species. Thermoregulatory mechanisms are similar between birds and mammals (Hohtola Reference Hohtola, Barnes and Carey2004). During heat stress, animals rely on energy-intensive heat abatement mechanisms such as sweating and panting (Patience et al. Reference Patience, Umboh, Chaplin and Nyachoti2005; Tzschentke Reference Tzschentke2007; Berman Reference Berman2011). In addition to heat abatement techniques, birds and mammals both decrease intake to minimize heat production during times of heat stress (Dale & Fuller Reference Dale and Fuller1980; Bernabucci et al. Reference Bernabucci, Lacetera, Baumgard, Rhoads, Ronchi and Nardone2010). During periods of cold stress, both birds and mammals rely on shivering thermogenesis and on behavioural adaptions to conserve heat (Wekstein & Zolman Reference Wekstein and Zolman1971; Horowitz et al. Reference Horowitz, Scott, Hillman and van Tienhoven1978; Berthon et al. Reference Berthon, Herpin and Le Dividich1994; Hicks et al. Reference Hicks, McGlone, Whisnant, Kattesh and Norman1998). Because of these biological similarities, the small differences in intake responses across species were expected. However, given the common slope and lack of an interaction, lack of data for a species in a particular range does not preclude derivation of a predicted response for that species in that range. One simply needs enough data for the species to allow prediction of the main species effect. Ideally, the available beef cattle data could have been used as an example to illustrate the usefulness of this approach. Unfortunately, the beef data set only included two temperature levels and the variability in FFI at those temperatures precluded identification of a significant species effect.
Differences by temperature
The FFI within each temperature range was expected to differ from FFI in other temperature ranges. Decreased feed intake during heat stress is an important survival mechanism because it helps the animal restrict total heat load and regulate metabolism (McGuire et al. Reference McGuire, Beede, Collier, Buonomo, DeLorenzo, Wilcox, Huntington and Reynolds1991). These responses to high temperature are important physiological mechanisms that have been well conserved during evolution (Sonna et al. Reference Sonna, Fujita, Gaffin and Lilly2002). When comparing across species, moderate heat stress resulted in a 0·07 kg/kg decrease in FFI compared with TN intake. More severe heat stress decreased FFI by an additional 0·12 kg/kg.
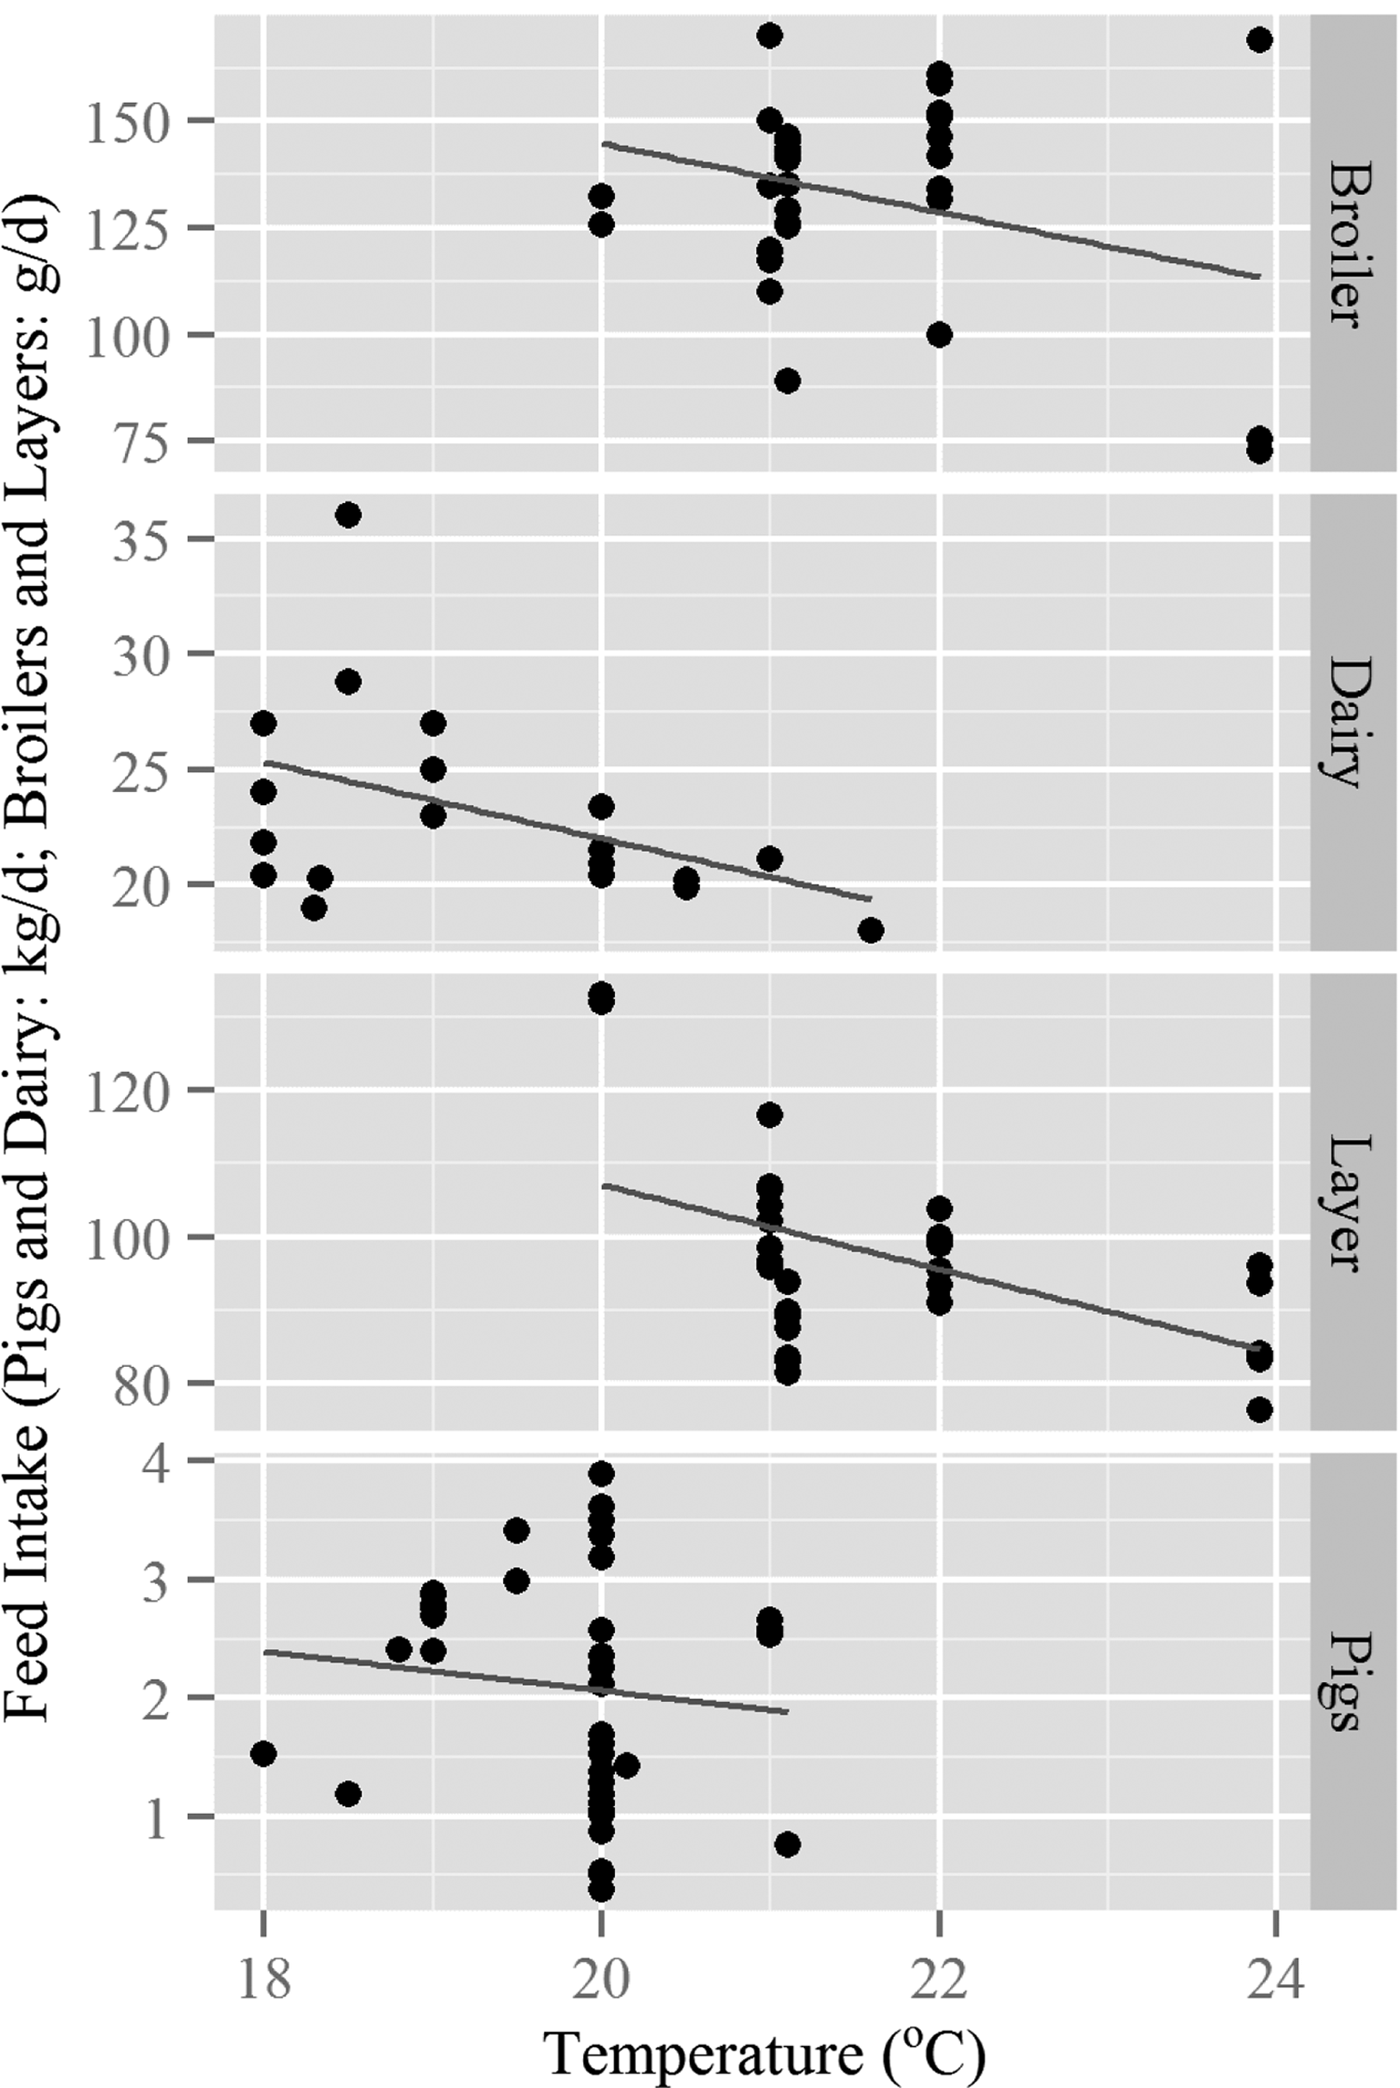
Feed intake has been proposed as a temperature regulation mechanism for decades, and it is well established that animals increase intake during periods of cold (Brobeck Reference Brobeck1948; Hamilton Reference Hamilton1963; Ketelaars & Tolkamp Reference Ketelaars and Tolkamp1992). In the current study, no significant difference was revealed between cold-stressed intake and TN intake. On average, FFI during cold stress was 0·02 kg/kg higher than FFI within the TN zone. Several reasons exist for the lack of significance and small numerical difference between these temperature ranges. Minimal cold stress data were available and this limited availability may have led to high variation in the cold stress response and a lack of significance between cold and TN intake. Alternatively, the lack of significance could point to a different trend within the data. Categorizing temperature by zones suggests that intake responses should be constant over temperatures within the zone. In the case of heat stress, this assumption was marginalized by the inclusion of multiple zones (moderate heat stress and heat stress). The trends in data across the study (Fig. 1) demonstrate a continuous change in intake across temperatures. For the purpose of predicting intake responses, deriving separate functions based on stress type (cold stress modelled separately from heat stress) may be inappropriate. Further evidence for this assertion was revealed by analysing data within the TN zone.
The TN zone has been a central idea within thermoregulatory theory for decades (Kingma et al. Reference Kingma, Frijns and van Marken Lichtenbelt2012). It is defined as the range of ambient temperatures where regulatory responses in metabolic heat production or evaporative heat loss do not occur. Previous models have assumed that intake is stable within this TN zone (National Research Council 2012) because temperature-induced regulation of feed intake is most apparent outside the zone. During the calculation of FFITN, it became apparent that FFI varied with temperature even within the TN zone (Fig. 3).
Feed intake within the thermoneutral zone for multiple livestock species.
When the idea of thermoneutrality was first proposed, it was based on the observation that energy balance experiments could not be reproduced without maintaining constant environmental conditions between studies (Rubner Reference Rubner1982). Much of the early investigation of this concept measured the maximal temperature gradient between skin and air over which the body could maintain temperature without increasing heat production (Hardy & Du Bois Reference Hardy and Du Bois1937a, Reference Hardy and Du Boisb). Within the TN zone, vasoconstriction and vasodilation are employed to either shuttle heat to the skin where it is more readily dissipated or to conserve heat within the body core. Feed intake regulation is also acknowledged to be important for maintenance of energy storage and energy homeostasis (Woods et al. Reference Woods, Seeley, Porte and Schwartz1998; McMinn et al. Reference McMinn, Baskin and Schwartz2000). On the basis of data analysis conducted herein, the idea that intake does not vary within the TN zone does not seem fully appropriate. Short-term intake regulation appeared to be employed concurrent with vasoconstriction or dilation to help maintain energy balance within the TN zone.
Common model forms across species
Model forms were selected for how well they were expected to perform across species. In general, the models worked as expected. Model 1 had high RMSPE and AICc and low CCC in all species. Models 2, 3 and 4 had moderate RMSPE, AICc and CCC. The very slight differences in fit statistics showed no clearly superior Model among 2, 3 and 4 for any of the species. Model 5 was expected to perform well and based on CCC and RMSPE, this was the case. Rankings based on AICc varied more apparently across species and tended to favour Model 3 or 4 over Model 5. The AICc is an estimate of the information lost when a model is used to represent the process that generates the data and gives no assessment of the absolute model quality. As the number of parameters does not differ between Models 3, 4 and 5, AICc would suggest that the marginal likelihood of Models 3 or 4 tended to be favourable compared with Model 5; however, the CCC suggests accuracy and precision of Model 5 tended to be improved compared with Models 3 and 4 in most species. Although the ideal model shifted when ranked by AICc or CCC, model rankings across species remained similar. Additional comparisons of CS models should be conducted to better understand how similar model forms differ in their ability to describe standardized biological responses across species.
Including a temperature parameter in the model of FFI (Model 1 compared with Model 2) improved CCC from <1% to >50% and substantially reduced AICc. In the dairy and laying hen models, temperature had a linear effect on intake only. Based on the significance values of the quadratic coefficients, it would be more appropriate to model intake in these species as a linear function of temperature. Since the objective was to compare identical models across species, these quadratic effects were retained to enable comparison. The quadratic relationship with temperature was concave in all species except pigs. A concave relationship suggests that, as temperature increases, the incremental change in FFI decreases at a decreasing rate, which implies that some biological threshold exists above which additional temperature increases have minimal effect on intake. In practice, animals have been observed to cease consumption entirely during periods of excessively high heat (Brobeck Reference Brobeck1948), and thus a concave relationship is not biologically defendable. The pig data set had both the largest (Table 1) and the most uniform range of data across temperatures. Notably, the pig data set had a substantial amount of cold-stress data, which may have been key in appropriately describing the shape of intake response to temperatures.
With the exception of laying hens, there was minimal difference between predicting FFI from mean, minimum and maximum temperatures, or based on the duration of exposure to temperatures outside the TN zone and difference between minimum and maximum temperature (Model 2 compared with Models 3 and 4). The laying hen model based on mean temperature had a lower CCC and a higher AICc than the models incorporating differences in minimum and maximum temperature. This poor fit, combined with the elevated correlation of FFI with minimum temperature in broilers, suggest that sensitivity to minimum and maximum temperatures may be more important to regulate feed intake in poultry than in pigs or dairy cattle. Environments with high mean and extremely variable temperatures have a greater impact on birds and mammals compared with extreme, constant-temperature environments (Dale & Fuller Reference Dale and Fuller1980; Lopez et al. Reference Lopez, Jesse, Becker and Ellersieck1991; Xin & DeShazer Reference Xin and DeShazer1991). Thermal conditioning has been well documented as effective in birds as they subsequently acclimate to heat stressed environments more effectively than do unconditioned counterparts (Yahav & Hurwitz Reference Yahav and Hurwitz1996; De Basilio et al. Reference De Basilio, Vilarino, Yahav and Picard2001; Moraes et al. Reference Moraes, Malheiros, Bruggeman, Collin, Tona, Van As, Onagbesan, Buyse, Decuypere and Macari2003). In pigs, neonatal thermal environment did not have a significant effect of body temperature or heat production responses during heat or cold stress (Becker et al. Reference Becker, Klir, Matteri, Spiers, Ellersiek and Misfeldt1997). This difference in efficacy of thermal conditioning suggests that birds may have improved physiological capacity to adapt to thermal environments. As such, the discrepant sensitivity to minimum and maximum temperatures detected within the current study is consistent with biological differences observed between birds and mammals.
In all species, including a metric for stage of production improved CCC and decreased RMSPE and AICc compared with all other models. Previous predictions of intake during heat and cold stress have demonstrated the importance of including some parameter accounting for the level of production (Spiers et al. Reference Spiers, Spain, Sampson and Rhoads2004). In pigs and broilers, intake responses to temperature differ with ages, BWs and rate of gain or plane of nutrition (Cooper & Washburn Reference Cooper and Washburn1998; Kerr et al. Reference Kerr, Yen, Nienaber and Easter2003; Pearce et al. Reference Pearce, Gabler, Ross, Escobar, Patience, Rhoads and Baumgard2013). Pig FFI decreased with increasing BW, which was consistent with the assertion that larger animals are more sensitive to high temperatures and smaller animals are more sensitive to cold temperatures. Conversely, as broiler age increased, FFI also increased, indicating that younger animals were more susceptible to environmental stress. Broiler FFI at 10 days differed from FFI at 70 days by <2%. Given this small detected variation by productive stage, improved uniformity of measurements across temperatures and stages of production may be necessary to define a reliable function relating temperature and age to intake during environmental stress. Dairy cattle heat stress responses vary across lactation and by production level (Spiers et al. Reference Spiers, Spain, Sampson and Rhoads2004). Similarly, in laying hens, responses to heat differ with production level (Franco-Jimenez et al. Reference Franco-Jimenez, Scheideler, Kittok, Brown-Brandl, Robeson, Taira and Beck2007). The responses detected within the dairy cattle and laying hen models suggested that heat-stressed intake depression was less pronounced in more productive dairy cattle or older hens. This relationship is inconsistent with dairy cattle measurements, which suggest that animals with greater milk production are more sensitive to heat stress. The range of production stages assessed within the dairy and layer data were not uniform, and, as such, more data are needed to parameterize a more reliable relationship between these factors.
Cross-species models
A notable shortfall of the SS-derived models for laying hens, broilers and dairy cattle was the unrealistic concave shape of the FFI curve with respect to temperatures. The CS-derived models did not suffer from this unrealistic curve shape, demonstrating greater agreement with biologic phenomena. The SS-derived models also demonstrated inconsistent direction in the responses of different species to increasing high temperatures (Model 3). Increased high temperature severely decreases FFI in many species (Dale & Fuller Reference Dale and Fuller1980; Xin & DeShazer Reference Xin and DeShazer1991). Whereas the SS-derived model for broilers demonstrated a significant direct relationship between high temperature and FFI, the CS-derived model identified an inverse relationship between these variables, which was more consistent with current understanding of biological responses to high temperatures.
The range of FFI predicted by the CS-derived models spanned from 85% of TN intake during heat stress to 110% of TN intake during cold stress. The SS-derived models predicted FFI between 75 and 250% of TN intake. The true range of FFI measured across data ranged from 55 to 125%. Although there was notable agreement between the two model types during heat stress and at TN conditions, this agreement did not confer during cold stress. When the SS-derived models for dairy cattle and laying hens were extrapolated to cold stress scenarios, these models predicted intakes (FFI = 2·5) that were double those demonstrated in the broiler and pig (FFI = 1·25) cold-stress data. From these data, one can conclude that extrapolating the current SS-derived models for laying hens and dairy cattle to predict cold stressed intake would be inappropriate. These data cannot definitively suggest that the CS-derived models are more appropriate for prediction; however, based on the range of data seen in other species, the authors strongly suppose this is the case.
Although CS-derived models were able to better represent biology when SS-derived models were inconsistent, the significant species effect detected within the analysis of variance necessitated further investigation into the capacity of CS-derived models to predict SS responses. The significance of individual parameters was greatly improved in the CS-derived compared with the SS-derived models. The insignificance of the parameter estimates in the SS-derived models can be interpreted to suggest that the data do not support the null hypothesis that the true effect is different from 0. When the data quality and volume is expanded in deriving the CS models, these same parameters often become significant. As such, improving the data quality and consistency results in the data favouring the hypothesis that the effect size differs from 0. In some cases, significant parameters in the SS-derived models became insignificant in the CS-derived model (pig and dairy c 2,3). This suggests that a SS difference in behaviour was identified in the SS-derived models. In this case, the significance of the quadratic temperature effect was dependent of species. The idea that some species respond to temperature in a curvilinear manner while others respond linearly requires additional investigation.
When comparing the models on the basis of AICc, the CS-derived models were much more probable than the SS-derived models. As AICc is based on the log-likelihood of the model given the data, it is inappropriate to use AICc to compare models derived from different data sets and as a result, comparison of the CS- and SS-derived models was based on CCC and RMSPE. When calculated for CS-derived models, CCC and RMSPE were calculated for each species data set individually to enable more appropriate comparison. Mathematically, models derived from specific data sets should yield more precise and accurate predictions of the data than models derived from a more global data set. As such, it is not surprising that the CS-derived models had lower CCC than did the SS-derived models. Comparison of the CS- and SS-derived models based on RMSPE was not as clear as the comparison by CCC because many comparisons had similar RMSPE between CS- and SS-derived models within a species. This inconsistency is likely because RMSPE is a less sensitive fit metric than CCC. The RMSPE is more heavily influenced by sample size and can fail to detect poor fit in highly variable data sets. Regardless of comparison based on RMSPE or CCC, differences between CS- and SS-derived model fit were minimal. The small differences in the performance of the SS- and CS-derived models combined with the improved parameter significance in the CS-derived models suggest that, if data are limiting, fitting a response function based on standardized CS data may be an option.
Using cross-species data to overcome knowledge gaps
There are notable gaps within the current body of literature assessing FFI across temperatures and stages of performance. Studies differentiating between levels of heat stress (moderate stress compared with severe stress) were lacking. Within dairy cattle literature, temperatures around 26 and 28 °C have been well investigated for a range of milk yields but more moderate heat stress (Table 6) and temperature above 30 °C have not been well investigated. Within the literature on pigs, temperatures between 20 and 32 °C have been well characterized across a range of productive stages. Broiler studies on severe heat stress (temperature >32 °C) and laying hen responses to moderate heat stress (temperature >28 °C) were limited. Data from larger/older animals at high temperature was underrepresented across species. Responses to heat stress become exacerbated in animals of larger size (Stahly & Cromwell Reference Stahly and Cromwell1979; Nyachoti et al. Reference Nyachoti, Zijlstra, de Lange and Patience2004). Thus, additional data on these responses will improve understanding of climate change implications. Cold stress represented another gap across species. Cold stress studies have been conducted (Brouček et al. Reference Brouček, Letkovičová and Kovalčuj1991) and the subject has been reviewed (Young Reference Young1981, Reference Young1983); however, TN comparisons are lacking. In dairy and laying hens, no data were identified. A small amount of broiler data was available primarily from young birds.
For each range of data representing a knowledge gap, the RMSPE and CCC of the SS- and CS-derived models were compared (Table 6). Within these knowledge gaps, the CS-derived models frequently resulted in improved RMSPE and CCC compared with the SS-derived models. The improvement in CS-derived model fit highlights the danger of over-fitting models or extrapolating their results beyond the range of inputs used in fitting. In cases where minimal data are available within a key parameter range, these results collectively suggest that, although not ideal, it may be possible to fit parameters based on CS data so that a more complete array of data is used in parameterization and the resulting equations are more robust over a range of data.
CONCLUSIONS
The CS data set highlighted similarities in CS responses to temperature stress. The well recognized decrease in feed intake with increasing temperature was characteristic to all evaluated animal species. Intake during TN conditions was not an exception to this trend as a constant decrease in intake across the TN zone was observed for all species. This difference within the TN zone was contrary to previous modelling efforts that assumed constant intake during TN conditions. Models derived from CS data sets had improved agreement with recognized biological responses compared with SS models, although the later had improved statistical goodness-of-fit. When compared over notable gaps within the data, CS models had similar or, in some cases, improved, statistical performance compared with SS models. The improved agreement between modelled and measured data suggests that filling in data sets with standardized CS data may be a viable alternative to extrapolating responses over a data range where minimal information was available.
The current work was carried out and supported as an activity of the National Animal Nutrition Program (NANP) to provide enabling technologies, support and shared resources to the research community. The NANP, a National Research Support Project (NRSP-9) of State Agricultural Experiment Stations, is funded from Hatch funds administered by the National Institute of Food and Agriculture, US Department of Agriculture, Washington DC. The National Animal Nutrition Program (NANP) Coordinating Committee is composed of Gary Cromwell (University of Kentucky), Phillip Miller (University of Nebraska), Jack Odle (North Carolina State University), Mark Hanigan (Virginia Tech), William Weiss (The Ohio State University), Mary Beth Hall (USDA-ARS), Mike Galyean (Texas Tech), Todd Applegate (Purdue University) and Donald Beitz (Iowa State University). The NANP Modeling Subcommittee comprises Mark Hanigan (Virginia Tech), Brian Kerr (USDA/ARS), Ermias Kebreab (University of California – Davis), John McNamara (Washington State University), Luis Tedeschi (Texas A&M University), Mike VandeHaar (Michigan State University), Nathalie Trottier (Michigan State University) and Roselina Angel (University of Maryland)