





1 Introduction
The control strategy to reduce skin friction in fully developed turbulent flows has been a persistent research topic for many years because of the increasing demands for energy saving and pollutant-emission reduction. Among the drag-reduction control schemes (Gad-El Hak Reference Gad-El Hak2000), active open-loop control methods such as moving the surface or imposing an extra body force have attracted significant attention. This strategy can achieve relatively higher drag-reduction (DR) rates compared with passive controls, and it is easier to accomplish in practical application compared with closed-loop controls. The spanwise (circumferential) movement of the wall is one of the controls that has been extensively studied in turbulent boundary layers (Choi, Debisschop & Clayton Reference Choi, Debisschop and Clayton1998; Skote Reference Skote2012, Reference Skote2013; Skote, Mishra & Wu Reference Skote, Mishra and Wu2015), channel flows (Jung, Mangiavacchi & Akhavan Reference Jung, Mangiavacchi and Akhavan1992; Baron & Quadrio Reference Baron and Quadrio1996; Quadrio, Ricco & Viotti Reference Quadrio, Ricco and Viotti2009; Viotti, Quadrio & Luchini Reference Viotti, Quadrio and Luchini2009; Quadrio Reference Quadrio2011; Touber & Leschziner Reference Touber and Leschziner2012; Hurst, Yang & Chung Reference Hurst, Yang and Chung2014) and pipe flows (Choi & Graham Reference Choi and Graham1998; Quadrio & Sibilla Reference Quadrio and Sibilla2000; Choi, Xu & Sung Reference Choi, Xu and Sung2002; Auteri et al. Reference Auteri, Baron, Belan, Campanardi and Quadrio2010).
Reducing friction drag by spanwise wall oscillation (time oscillation) was first proposed by Jung et al. (Reference Jung, Mangiavacchi and Akhavan1992) in numerically simulated turbulent channel flows. The wall moves in the spanwise direction as
 $$\begin{eqnarray}w_{wall}(t)=A\sin \unicode[STIX]{x1D714}t,\end{eqnarray}$$
where
 $w_{wall}$
is the spanwise velocity of the wall,
 $A$
denotes the oscillation amplitude and
 $\unicode[STIX]{x1D714}$
is the oscillation angular frequency. The oscillation period
 $T$
is determined by
 $T=2\unicode[STIX]{x03C0}/\unicode[STIX]{x1D714}$
. Jung et al. (Reference Jung, Mangiavacchi and Akhavan1992) showed that the time oscillation of the wall is very effective in reducing friction drag; a DR rate of as much as 40 % can be attained when the wall oscillates at the optimal period,
 $T_{opt0}^{+}\approx 100$
(hereinafter, the superscript ‘
 $+$
’ denotes the scaling by the friction velocity
 $u_{\unicode[STIX]{x1D70F}0}$
of the uncontrolled reference flow and the kinematic viscosity
 $\unicode[STIX]{x1D708}$
of the fluid unless otherwise specified).
Similar to the time oscillation of the wall, Viotti et al. (Reference Viotti, Quadrio and Luchini2009) transformed the control law (1.1) into a streamwise wavy distribution of spanwise velocity (streamwise oscillation) described by
 $$\begin{eqnarray}w_{wall}(x)=A\sin k_{x}x,\end{eqnarray}$$
where
 $x$
denotes the streamwise coordinate and
 $k_{x}$
is the wavenumber. The corresponding wavelength is obtained by
 $\unicode[STIX]{x1D706}_{x}=2\unicode[STIX]{x03C0}/k_{x}$
. This control can reach a DR rate of up to 52 % at the amplitude
 $A^{+}=20$
and the wavelength
 $\unicode[STIX]{x1D706}_{x}^{+}=1250$
. At different amplitudes, the optimal wavelength in (1.2) was found to be in good accordance with the optimal oscillating period in (1.1) after being converted by using the near-wall convective velocity under the Taylor hypothesis. Similar results were found by Skote (Reference Skote2011) who applied the wall forcing according to (1.2) in the boundary layer flow.
Quadrio et al. (Reference Quadrio, Ricco and Viotti2009), combining (1.1) and (1.2), proposed a more general control scheme, i.e. the streamwise-travelling wave of spanwise velocity (streamwise-travelling wave):
 $$\begin{eqnarray}w_{wall}(x,t)=A\sin (k_{x}x-\unicode[STIX]{x1D714}t).\end{eqnarray}$$
By performing direct numerical simulations (DNSs) in turbulent channel flows, the relationship between the DR rate and the control parameters
 $\unicode[STIX]{x1D714}$
and
 $k_{x}$
was first obtained under the condition of fixed amplitude
 $A^{+}=12$
and the Reynold number
 $Re_{\unicode[STIX]{x1D70F}}=200$
based on
 $u_{\unicode[STIX]{x1D70F}0}$
and the half-channel width. The authors showed that in the non-zero wavenumber and oscillation frequency region, the behaviour of the DR rate is quite complex. The optimal control parameters off the axes led to a DR rate of 48 % at
 $\unicode[STIX]{x1D714}^{+}=0.030$
and
 $k_{x}^{+}=0.008$
, which is higher than the DR rates of the time oscillation control (34 % at
 $\unicode[STIX]{x1D714}^{+}=0.060$
) and the streamwise oscillation control (45 % at
 $k_{x}^{+}=0.005$
). They also indicated that the drag increase (DI) appears in a narrow triangular region in the frequency–wavenumber plane, where the maximum DI rate is up to 23 %. In this region, the wave speed of the spanwise velocity at the wall is almost identical to the convection speed of the near-wall coherent structures, namely,
 $U_{c}^{+}\approx 10$
. This value is the same as that used by Viotti et al. (Reference Viotti, Quadrio and Luchini2009) to convert the streamwise oscillation into the time oscillation.
Changes in turbulence statistics under spanwise wall oscillation have been reported. Baron & Quadrio (Reference Baron and Quadrio1996) analysed the turbulence statistics at the optimal control parameters similar to Jung et al. (Reference Jung, Mangiavacchi and Akhavan1992). They found that in the DR cases, the streamwise mean velocity is reduced in the viscous sublayer. When scaled by the actual friction velocity, the mean velocity profiles for the controlled flow collapse well with that of the uncontrolled flow in the viscous sublayer but are up-shifted in the log region. Baron & Quadrio (Reference Baron and Quadrio1996) indicated that in the DR cases, the spanwise wall oscillation can greatly suppress the turbulence intensity and cause outward movement of their peak position. Similar changes in the mean velocity profile and turbulence intensity were also observed in subsequent studies (Quadrio & Sibilla Reference Quadrio and Sibilla2000; Quadrio et al. Reference Quadrio, Ricco and Viotti2009; Viotti et al. Reference Viotti, Quadrio and Luchini2009; Touber & Leschziner Reference Touber and Leschziner2012; Skote Reference Skote2014).
The turbulent coherent structures, particularly the quasi-streamwise vortices and the velocity streaks, are also prominently affected by spanwise wall motion. In the time oscillation cases, the near-wall low-speed streaks change their orientations periodically in accordance with the wall motion. The inclined angle of the streaks is consistent with that of the mean shear stress vector at
 $y^{+}\sim 10$
(Touber & Leschziner Reference Touber and Leschziner2012). In the streamwise-travelling wave cases, the streaks are modulated by the waves in the DI cases, which show a difference from the uncontrolled flows (Quadrio et al.
Reference Quadrio, Ricco and Viotti2009). Choi et al. (Reference Choi, Xu and Sung2002) discussed the relationship between the streaks and the quasi-streamwise vortices for time oscillation DR cases in pipe flows. In the near-wall region, the high-speed fluid intrudes beneath the low-speed fluid in the period of the wall co-rotating with the streamwise vortices. However, in the counter-rotating period, the quasi-streamwise vortices are surrounded by the high-speed fluid and the low-speed fluid is lessened. This change in the relationship between the streamwise vortices and the low-speed streaks leads to the suppression of the negative velocity fluctuations and has a significant effect on the generation of the Reynold shear stress. However, away from the wall, the streaks and the quasi-streamwise vortices are hardly affected by the wall oscillation. This indicates that the influence range of the spanwise moving wall is essential in reducing the wall friction drag.
The influence range of the spanwise wall motion can be quantified by the thickness of the Stokes layer (Quadrio Reference Quadrio2011), which is crucial for DR behaviour. Choi et al. (Reference Choi, Xu and Sung2002) investigated the drag reduction in the channel and pipe flows by time oscillation control and first proposed two key factors that could determine the DR rate, namely, the thickness and the acceleration of the Stokes layer. Based on this finding, the linear relationship between the DR rate and the derived parameter
 $S^{+}$
became clear.
 $S^{+}$
is a function of the thickness and the acceleration of the Stokes layer, both of which are related to the oscillation period. The linear relationship holds well for
 $T^{+}<150$
in channel flows (Quadrio & Ricco Reference Quadrio and Ricco2004; Ricco & Quadrio Reference Ricco and Quadrio2008). For streamwise-travelling wave cases, Quadrio & Ricco (Reference Quadrio and Ricco2011) introduced the corresponding oscillation period:
 $$\begin{eqnarray}T_{s}^{+}=|\unicode[STIX]{x1D706}_{x}^{+}/(c^{+}-U_{c}^{+})|\end{eqnarray}$$
to examine the DR scaling, where
 $c^{+}=\unicode[STIX]{x1D714}^{+}/k_{x}^{+}$
is the wave speed of the control and
 $U_{c}^{+}$
is the convective velocity of the near-wall coherent structures. They pointed out that as long as
 $T_{s}^{+}<T_{th}^{+}$
(
 $T_{th}^{+}\approx 120$
in channel flows), the phase-averaged profiles of the spanwise velocity will collapse well with the exact solution of the laminar Stokes layers and the DR rate can be scaled well with the thickness of the laminar Stokes layer.
In the present study, the drag reduction at the external surface of a cylinder in turbulent flows along the axial direction of the cylinder (referred to as turbulent flows along a cylinder for abbreviation in the following) was investigated by direct numerical simulations. This work was motivated by the following two considerations: (i) many practical flying vehicles are in the shape of a cylinder, such as fuselages of aircrafts, submarines and missiles; (ii) the circumferential wall movement can trigger the instability of the flow outside the cylinder, which has crucial influence on the drag-reduction behaviour and has not been considered in the previous works concerning the flows above flat (such as channel) or concave (such as pipe) surfaces. When the cylinder rotates in the circumferential direction, the flow pattern in the near-wall region is very similar to that of the best-known Taylor–Couette flow between two coaxial cylinders, which will lose its stability if the rotation speed of the inner cylinder is beyond a certain threshold (Taylor Reference Taylor1923). In the case of pure circumferential rotation, the turbulent transport in the radial direction is enhanced due to the instability, and the circumferential vortices, regularly spreading along the axial direction, become the primary coherent structures in the near-wall region (Ostilla-Mónico et al. Reference Ostilla-Mónico, Stevens, Grossmann, Verzicco and Lohse2013, Reference Ostilla-Mónico, Van Der Poel, Verzicco, Grossmann and Lohse2014) (hereinafter, these vortices induced by centrifugal instability are referred to as ‘rotation-induced vortices’). Therefore, in the turbulent flow along a cylinder with circumferential wall movement, the Stokes layers that can reduce wall friction and the rotation-induced vortices that may enhance turbulent intensity both take effect, and their impact on DR behaviour should be investigated, which is the main concern of the present work.
The paper is structured as follows. In § 2, the physical problem and the numerical method are outlined briefly. Section 3 presents the results and discussion: the variation of DR rate with control frequency and wavenumber is displayed in § 3.1, the rotation-induced vortices and drag increase are analysed in § 3.2, the effect of wall curvature on DR rate is further discussed in § 3.3 and the net energy saving of the control is evaluated in § 3.4. Finally in § 4, the conclusions are given.
2 Problem formulation and numerical method
The geometry of the present computation domain is shown in figure 1 in which
 $R_{1}$
is the radius of the cylinder, and
 $R_{2}$
is the radius of the outer boundary of the computational domain. The cylindrical coordinates are adopted, in which
 $r$
,
 $\unicode[STIX]{x1D703}$
and
 $x$
denote the radial, circumferential and axial directions, respectively, and the corresponding velocity components are
 $u_{r}$
,
 $u_{\unicode[STIX]{x1D703}}$
and
 $u_{x}$
. The mean flow is along the axial direction. The oscillating circumferential velocity is imposed on the wall.
Sketch of the computational setting.

The flow is governed by the incompressible Navier–Stokes equations as follows:
 $$\begin{eqnarray}\displaystyle & \displaystyle \unicode[STIX]{x1D735}\boldsymbol{\cdot }\boldsymbol{u}=0, & \displaystyle\end{eqnarray}$$
 $$\begin{eqnarray}\displaystyle & \displaystyle \frac{\unicode[STIX]{x2202}\boldsymbol{u}}{\unicode[STIX]{x2202}t}=\boldsymbol{u}\times \unicode[STIX]{x1D74E}-\unicode[STIX]{x1D735}\unicode[STIX]{x1D6F1}+\unicode[STIX]{x1D708}\unicode[STIX]{x1D6FB}^{2}\boldsymbol{u}, & \displaystyle\end{eqnarray}$$
where
 $\boldsymbol{u}$
is the velocity vector,
 $\unicode[STIX]{x1D74E}$
is the vorticity vector and
 $\unicode[STIX]{x1D6F1}$
is the total pressure. In the streamwise and circumferential directions, periodic conditions are applied. The no-slip and impermeable conditions are imposed on the cylinder wall, i.e. at
 $r=R_{1}$
, the streamwise and radial velocity are zero and the circumferential velocity is described by the control law
 $$\begin{eqnarray}u_{\unicode[STIX]{x1D703}wall}(x,t)=A\sin (k_{x}x-\unicode[STIX]{x1D714}t),\end{eqnarray}$$
where
 $A$
is the oscillation amplitude,
 $k_{x}$
and
 $\unicode[STIX]{x1D714}$
are the wavenumber and frequency of the forcing velocity, respectively. On the outer boundary of the computational domain, the free-slip and no penetration conditions are applied, i.e. at
 $r=R_{2}$
,
 $\unicode[STIX]{x2202}u_{x}/\unicode[STIX]{x2202}r=0$
,
 $\unicode[STIX]{x2202}u_{\unicode[STIX]{x1D703}}/\unicode[STIX]{x2202}r=0$
and
 $u_{r}=0$
. It is noteworthy that the flow considered in the present study is not a flow in an annulus. We tried to use the present setting as a surrogate of the boundary layer flow along the external surface of a cylinder. Although the flow is driven by a pressure gradient rather than a free stream as in a true boundary layer, it can still represent the flow physics in the near-wall region of the boundary layer flow, because the Reynolds stress and viscous stress are dominant terms in the mean momentum equation, and the pressure gradient or the convection terms are negligible in the near-wall region (Klewicki Reference Klewicki2010). Using this geometry, the flow is homogenous and a periodic condition is allowed in the streamwise direction, and hence the computational cost is greatly reduced compared with that needed by the spatially developing boundary layer. Therefore, it is possible for us to run several hundred DNSs in order to give the map of drag-reduction rate. In literature, pressure-driven wall-bounded flows have also been used in the study on the mechanism of drag-reduction control in turbulent boundary layers (Kim Reference Kim2003, Reference Kim2011).
For spatial discretisation of the governing equations, Fourier expansions are used in the streamwise and circumferential directions, and a second-order central difference scheme on a non-uniform staggered grids is used in the radial direction. A third-order time-splitting method (Karniadakis, Israeli & Orszag Reference Karniadakis, Israeli and Orszag1991) is adopted for time advancement as follows:
 $$\begin{eqnarray}\frac{\displaystyle \unicode[STIX]{x1D6FE}_{0}\boldsymbol{u}^{n+1}-\mathop{\sum }_{i=0}^{2}\unicode[STIX]{x1D6FC}_{i}\boldsymbol{u}^{n-i}}{\displaystyle \unicode[STIX]{x0394}t}=N(\boldsymbol{u}^{n+1})-\unicode[STIX]{x1D735}\unicode[STIX]{x1D6F1}^{n+1}+\unicode[STIX]{x1D708}\left[\begin{array}{@{}c@{}}\unicode[STIX]{x1D6FB}^{2}u_{x}\\ \unicode[STIX]{x1D6FB}^{2}u_{r}-{\displaystyle \frac{u_{r}}{r^{2}}}\\ \unicode[STIX]{x1D6FB}^{2}u_{\unicode[STIX]{x1D703}}-{\displaystyle \frac{u_{\unicode[STIX]{x1D703}}}{r^{2}}}\\ \end{array}\right]^{n+1}\!,\end{eqnarray}$$
where
 $$\begin{eqnarray}N(\boldsymbol{u}^{n+1})=\mathop{\sum }_{i=0}^{2}\unicode[STIX]{x1D6FD}_{i}\left((\boldsymbol{u}\times \unicode[STIX]{x1D74E})+\unicode[STIX]{x1D708}\frac{2}{r^{2}}\left[\begin{array}{@{}c@{}}0\\ -{\displaystyle \frac{\unicode[STIX]{x2202}u_{\unicode[STIX]{x1D703}}}{\unicode[STIX]{x2202}\unicode[STIX]{x1D703}}}\\ {\displaystyle \frac{\unicode[STIX]{x2202}u_{r}}{\unicode[STIX]{x2202}\unicode[STIX]{x1D703}}}\\ \end{array}\right]\right)^{n-i}.\end{eqnarray}$$
The coefficients take the values of
 $\unicode[STIX]{x1D6FE}_{0}=11/6$
,
 $\unicode[STIX]{x1D6FC}_{0}=3$
,
 $\unicode[STIX]{x1D6FC}_{1}=-3/2$
,
 $\unicode[STIX]{x1D6FC}_{2}=1/3$
,
 $\unicode[STIX]{x1D6FD}_{0}=3$
,
 $\unicode[STIX]{x1D6FD}_{1}=-3$
and
 $\unicode[STIX]{x1D6FD}_{2}=1$
.
To validate the numerical method and the code, DNS was performed for turbulent flow in an annulus (boundary conditions at
 $r=R_{1}$
and
 $r=R_{2}$
were changed to be
 $u_{r}=u_{\unicode[STIX]{x1D703}}=u_{x}=0$
) and compared with those of Chung, Rhee & Sung (Reference Chung, Rhee and Sung2002), in which the second-order central difference scheme was used in all three directions. The radius ratio of the inner and outer cylinders is
 $R_{1}/R_{2}=0.5$
. The flow is driven by a constant pressure gradient along the axial direction at the Reynolds number
 $Re_{m}=U_{m}H/\unicode[STIX]{x1D708}=4450$
, in which
 $U_{m}$
is the bulk mean velocity and
 $H=R_{2}-R_{1}$
is the annulus width. The computation is conducted in only one quarter of the full cross-section, and the length in the streamwise direction is
 $L_{x}=9H$
. Uniform grids are used in the streamwise and circumferential directions, and non-uniform grids obeying the cosine distribution are adopted in the radial direction. The above computational settings are the same as those of Chung et al. (Reference Chung, Rhee and Sung2002). The present numbers of grid points are
 $128\times 71\times 192$
in the circumferential, radial and streamwise directions, respectively, whereas the numbers of grid points are
 $128\times 65\times 192$
in Chung et al. (Reference Chung, Rhee and Sung2002).
Figure 2 shows the mean velocity profile in comparison with that of Chung et al. (Reference Chung, Rhee and Sung2002). The radial coordinate is transformed and non-dimensionalised as
 $y=(r-R_{1})/H$
. The present result collapses well with that of Chung et al. (Reference Chung, Rhee and Sung2002). The root-mean-square (r.m.s.) of velocity fluctuations and the Reynolds shear stress are shown in figure 3; they also agree well with the results of Chung et al. (Reference Chung, Rhee and Sung2002).
The mean streamwise velocity profiles normalised by
 $U_{m}$
.

Root-mean-square velocity fluctuations (a) and Reynolds shear stress (b) normalised by
 $U_{m}$
.

In the present simulations of the turbulent flows along a cylinder, the outer edge is assumed to be at
 $R_{2}=4R_{1}$
for most cases, and
 $R_{2}=2R_{1}$
is also considered in § 3.3 to see the curvature effect on the drag-reduction rate. The flow rate between
 $R_{1}$
and
 $R_{2}$
is kept constant in all the simulations by adjusting the driving pressure gradient. The bulk mean velocity
 $U_{m}$
and radial width
 $H=R_{2}-R_{1}$
are selected to non-dimensionalise the governing equations. The Reynolds number based on
 $U_{m}$
and
 $H$
is fixed at
 $Re_{m}=4450$
(corresponding to
 $Re_{\unicode[STIX]{x1D70F}}=u_{\unicode[STIX]{x1D70F}0}H/\unicode[STIX]{x1D708}=272$
for uncontrolled reference flow). The radial width
 $H$
is analogous to the nominal thickness of the boundary layer along the external surface of the cylinder in the present approach. The momentum thickness of the corresponding uncontrolled reference flow is
 $\unicode[STIX]{x1D703}\approx H/12.0$
and
 $H/10.3$
for
 $R_{2}=4R_{1}$
and
 $2R_{1}$
, respectively, and the Reynolds number based on
 $\unicode[STIX]{x1D703}$
and the mean velocity at the upper boundary
 $r=R_{2}$
is
 $Re_{\unicode[STIX]{x1D703}}=407$
and 476. The amplitude of the wall oscillation velocity in (2.3) is chosen to be
 $A=U_{m}$
(corresponding to
 $A^{+}=16$
) for most cases.
 $A=0.5U_{m}$
(
 $A^{+}=8$
) and
 $A=0.25U_{m}$
(
 $A^{+}=4$
) are also considered in § 3.4 for the evaluation of net energy saving of the control. The computation is conducted in the full cross-section spanning the streamwise length of
 $L_{x}=2\unicode[STIX]{x03C0}H$
. The grid distribution in the simulation of turbulent flows along a cylinder is the same as that in the validation case. For most simulations, to obtain the DR rate in §§ 3.1 and 3.3,
 $256\times 256$
Fourier modes are used in the streamwise and circumferential directions, and 64 grid points are used in the radial direction. The grid resolution is
 $\unicode[STIX]{x0394}x^{+}=6.68$
,
 $(r\unicode[STIX]{x0394}\unicode[STIX]{x1D703})_{min/max}^{+}=1.33/5.34$
and
 $\unicode[STIX]{x0394}r_{min/max}^{+}=0.16/6.67$
. Approximately 300 DNSs were performed with the control frequency
 $\unicode[STIX]{x1D714}^{+}=0\sim 0.378$
and the wavenumber
 $k_{x}^{+}=0\sim 0.018$
. To investigate the mechanism of drag increase as discussed in § 3.2, a finer grids of
 $512\times 191\times 384$
is adopted for the selected typical DI cases. The grid resolution is improved to
 $\unicode[STIX]{x0394}x^{+}=3.34$
,
 $(r\unicode[STIX]{x0394}\unicode[STIX]{x1D703})_{min/max}^{+}=0.89/3.56$
and
 $\unicode[STIX]{x0394}r_{min/max}^{+}=0.018/2.23$
.
3 Results and discussion
3.1 Drag-reduction rate
Variation of DR rate with control frequency and wavenumber.

The change of the mean wall shear stress
 $\unicode[STIX]{x1D70F}_{w}$
under different control parameters is first investigated. The DR rate is defined as
 $$\begin{eqnarray}\text{DR}=\frac{\unicode[STIX]{x1D70F}_{w0}-\unicode[STIX]{x1D70F}_{wc}}{\unicode[STIX]{x1D70F}_{w0}},\end{eqnarray}$$
where the subscripts ‘0’ and ‘
 $c$
’ denote the uncontrolled and controlled flows, respectively. Figure 4 shows the DR rate as a function of the control frequency
 $\unicode[STIX]{x1D714}^{+}$
and wavenumber
 $k_{x}^{+}$
. For the time oscillation cases on the horizontal axis (
 $k_{x}^{+}=0$
), the maximum DR rate is 45.4 %, achieved at the control frequency
 $\unicode[STIX]{x1D714}_{opt0}^{+}\approx 0.0504$
(corresponding to
 $T_{opt0}^{+}\approx 124.7$
), which is slightly lower than the optimal frequency in channel flow
 $\unicode[STIX]{x1D714}_{opt0}^{+}\approx 0.06$
(corresponding to
 $T_{opt0}^{+}\approx 106$
) at
 $Re_{\unicode[STIX]{x1D70F}}=200$
(Quadrio et al.
Reference Quadrio, Ricco and Viotti2009). On the vertical axis representing streamwise oscillation controls (
 $\unicode[STIX]{x1D714}^{+}=0$
), the optimal wavenumber is
 $k_{x,opt0}^{+}\approx 0.0148$
(corresponding to
 $\unicode[STIX]{x1D706}_{x,opt0}^{+}\approx 424.5$
), which also results in a DR rate of approximately 45.4 %. The optimal wavelength in the present work is very different from that in the channel flow
 $\unicode[STIX]{x1D706}_{x,opt0}^{+}\approx 1250$
(Quadrio et al.
Reference Quadrio, Ricco and Viotti2009). The shorter optimal wavelength in the present cylinder flow is attributed to the centrifugal instability caused by the transverse convex curvature of the moving wall because the longer wavelength provides a larger space for the development of the rotation-induced vortices. This will be discussed in detail in § 3.2. At the control parameters of
 $(\unicode[STIX]{x1D714}^{+},k_{x}^{+})=(0.0126,0.0147)$
, very close to the vertical axis, the maximum DR rate
 $\text{DR}_{max}=48.4\,\%$
is obtained, a value that is similar to that achieved in the channel flow (Quadrio et al.
Reference Quadrio, Ricco and Viotti2009).
It is worth comparing the DI region with that of the channel flow by Quadrio et al. (Reference Quadrio, Ricco and Viotti2009) and pipe flow by Auteri et al. (Reference Auteri, Baron, Belan, Campanardi and Quadrio2010). In the present turbulent flows along a cylinder, the turning point from DR to DI is around
 $\unicode[STIX]{x1D714}^{+}\approx 0.0397$
and
 $k_{x}^{+}\approx 0.0051$
at the lateral and vertical axes in figure 4, whereas in channel flows, the turnings are very close to the origin (Quadrio et al.
Reference Quadrio, Ricco and Viotti2009). The present maximum DI rate (
 $\text{DR}=-48\,\%$
) at
 $(\unicode[STIX]{x1D714}^{+},k_{x}^{+})=(0.0246,0.0018)$
is approximately twice that of channel flows (
 $\text{DR}=-23\,\%$
). Furthermore, comparisons can be made among Auteri et al.’s (Reference Auteri, Baron, Belan, Campanardi and Quadrio2010) pipe, Quadrio et al.’s (Reference Quadrio, Ricco and Viotti2009) channel and the present cylinder flows for the controls with the fixed wavenumber
 $k_{x}^{+}\approx 0.0041$
and different frequencies (shown by the black dashed line in figure 4). The maximum DI rate in the present cylinder flow is approximately 40 %, whereas, it is only approximately 10 % in channel flow (Quadrio et al.
Reference Quadrio, Ricco and Viotti2009) and no drag increase happens in pipe flow (Auteri et al.
Reference Auteri, Baron, Belan, Campanardi and Quadrio2010). This also suggests that the mechanism related to the centrifugal instability, which does not appear in the plane channels, must be considered in the present turbulent flows along a cylinder for evaluation of the control performance.
In figure 4, the black solid line going through the points of the maximum DI rate demarcates the DR map into two parts: the S region on the top left, which is close to the streamwise oscillation control, and the T region on the bottom right, which is close to the time oscillation control. The slope of the demarcation line represents the wave speed at which the maximum DI rate is achieved. This wave speed in the present cylinder flow is approximately
 $U_{c}^{+}\approx 10$
, a value that is almost the same as that in channel flow. Quadrio et al. (Reference Quadrio, Ricco and Viotti2009) found that in channel flow this wave speed is very close to the convective velocity of the near-wall coherent structures. To validate whether this still holds in the present cylinder flows, the convective velocity of near-wall coherent structures was directly computed by the linear regression of
 $(\unicode[STIX]{x2202}u_{x}/\unicode[STIX]{x2202}t^{+},\unicode[STIX]{x2202}u_{x}/\unicode[STIX]{x2202}x^{+})$
obtained from the DNS data for both controlled and uncontrolled flows. It is found that in the near-wall region of
 $y^{+}<10$
,
 $U_{c}^{+}$
is very close to 10 for all the considered cases. Although a new mechanism has been introduced into the turbulent flows along a cylinder, it is still very useful to use
 $U_{c}^{+}$
to scale the DR rate, just as in the plane channels of Quadrio & Ricco (Reference Quadrio and Ricco2011).
The oscillation of the surface can lead to the formation of a Stokes layer, and the thickness of the Stokes layer is a key parameter to determine the drag-reduction rate (Choi et al.
Reference Choi, Xu and Sung2002; Quadrio & Ricco Reference Quadrio and Ricco2011). In the case of a cylinder oscillating in the circumferential direction, the expression for the Stokes layer thickness
 $\unicode[STIX]{x1D6FF}_{s}$
can be derived from the magnitude analysis of the equation governing the circumferential motion in the generalised Stokes layer as done by Quadrio & Ricco (Reference Quadrio and Ricco2011), but with an additional assumption of
 $\unicode[STIX]{x1D6FF}_{s}\ll R_{1}$
because of the cylindrical geometry in the present approach,
 $$\begin{eqnarray}\unicode[STIX]{x1D714}^{+}(\unicode[STIX]{x1D6FF}_{s}^{+})^{2}+(1-\text{DR})k_{x}^{+}(\unicode[STIX]{x1D6FF}_{s}^{+})^{3}\approx 1.\end{eqnarray}$$
For time oscillation and streamwise oscillation controls, considered as the special cases of travelling wave control, the thickness of the Stokes layer can be estimated as
 $\unicode[STIX]{x1D6FF}_{s}^{+}\sim (\unicode[STIX]{x1D714}^{+})^{-1/2}$
and
 $\unicode[STIX]{x1D6FF}_{s}^{+}\sim (k_{x}^{+})^{-1/3}$
, respectively.
Quadrio & Ricco (Reference Quadrio and Ricco2011) pointed out that as long as the equivalent oscillation period
 $T_{s}^{+}$
defined in (1.4) satisfies
 $T_{s}^{+}<T_{th}^{+}$
, the DR rate can be scaled well by
 $\unicode[STIX]{x1D6FF}_{s}^{+}$
. The threshold
 $T_{th}^{+}$
is determined by the optimal period
 $T_{opt0}^{+}$
in time oscillation control or the transformed optimal period
 $T_{t}^{+}=\unicode[STIX]{x1D706}_{x,opt0}^{+}/U_{c}^{+}$
in streamwise oscillation control, here the optimal period refers to the period with maximum drag-reduction rate. In a plane channel, these two optimal periods are almost same, i.e.
 $T_{opt0}^{+}\approx T_{t}^{+}\approx 120$
(Quadrio et al.
Reference Quadrio, Ricco and Viotti2009). In the present turbulent flows along a cylinder, the optimal period for time oscillation control is
 $T_{opt0}^{+}\approx 124.7$
, but the transformed optimal period for streamwise oscillation control is
 $T_{t}^{+}\approx 42.4$
, that is, the thresholds for the T region (
 $T_{th,T}^{+}\approx 120$
) and the S region (
 $T_{th,S}^{+}\approx 40$
) are very different. Figure 5 shows the relationship between the DR rate and the thickness of the Stokes layer
 $\unicode[STIX]{x1D6FF}_{s}^{+}$
determined from (3.2) for the cases in T region. The cases satisfying
 $T_{s}^{+}<T_{th}^{+}$
collapse well and other cases are widely scattered. This is similar to those in channel flows (Quadrio & Ricco Reference Quadrio and Ricco2011). The quadratic regression (red line) shows that the minimal thickness for drag reduction is
 $\unicode[STIX]{x1D6FF}_{min}^{+}\approx 0.8$
and the optimal thickness is
 $\unicode[STIX]{x1D6FF}_{opt}^{+}\approx 4.5$
.
Relationship between DR rate and Stokes layer thickness.

For the cases not satisfying
 $T_{s}^{+}<T_{th}^{+}$
in the T region and also in the S region, the scaling of the DR rate has not been considered in previous studies. In the present work, we propose to use the effective frequency and wavenumber to scale the DR rate. The effective parameters come from the transform of the streamwise-travelling wave (2.3) into time oscillation or streamwise oscillation by using Taylor’s hypothesis
 $x=U_{c}t$
or
 $t=x/U_{c}$
. Therefore the effective frequency
 $\unicode[STIX]{x1D714}_{e}^{+}$
and the effective wavenumber
 $k_{xe}^{+}$
is introduced as
 $$\begin{eqnarray}\unicode[STIX]{x1D714}_{e}^{+}=\unicode[STIX]{x1D714}^{+}-k_{xe}^{+}U_{c}^{+}\end{eqnarray}$$
and
 $$\begin{eqnarray}k_{xe}^{+}=k_{x}^{+}-\unicode[STIX]{x1D714}^{+}/U_{c}^{+}.\end{eqnarray}$$
The streamwise-travelling wave control is transformed to the equivalent time oscillation control in the T region and streamwise oscillation control in the S region by respectively employing the effective frequency and wavenumber. According to (3.2), the effective thickness of the Stokes layer can be defined as
 $$\begin{eqnarray}\unicode[STIX]{x1D6FF}_{e}^{+}=(\unicode[STIX]{x1D714}_{e}^{+})^{-1/2}\end{eqnarray}$$
and
 $$\begin{eqnarray}\unicode[STIX]{x1D6FF}_{e}^{+}=(k_{xe}^{+})^{-1/3}\end{eqnarray}$$
for the cases in the T region and S region, respectively.
Figure 6 shows the variation of DR rate as a function of the effective thickness of the Stokes layer
 $\unicode[STIX]{x1D6FF}_{e}^{+}$
. Compared with the scaling by
 $\unicode[STIX]{x1D6FF}_{s}^{+}$
as shown in figure 5 and in Quadrio & Ricco (Reference Quadrio and Ricco2011) for channel flow, the present scaling by
 $\unicode[STIX]{x1D6FF}_{e}^{+}$
collapses well all the DR and DI cases in the T and S regions. The time oscillation cases are also indicated by the red line in figure 6, which agrees well with the distribution of other control cases. The DR rate increases as the effective thickness of the Stokes layer increases and reaches an maximum value at around
 $\unicode[STIX]{x1D6FF}_{e,opt}^{+}\approx 4$
. As the effective Stokes layer further thickens, the DR rate suddenly decreases, and the wall friction can increase dramatically, which means that the centrifugal instability begins to play a significant role.
Variation of DR rate with the effective thickness of Stokes layer.

3.2 Rotation-induced vortices and drag increase
In this section, four DI cases indicated as DI1-DI4 in figure 4 are chosen to analyse the effect of rotation-induced vortices, i.e.
 $(k_{x}^{+},\unicode[STIX]{x1D714}^{+})=(0.0,0.0378)$
, (0.0037, 0.0), (0.0037, 0.0687) and (0.0110, 0.0756), and the corresponding drag-reduction rates are
 $-5.9\,\%$
,
 $-22.4\,\%$
,
 $-16.4\,\%$
and
 $-24.5\,\%$
respectively.
The rotation-induced vortices are the primary coherent structures in the near-wall region in the DI cases. Figure 7 shows the time history of the circumferential wall velocity, the surface-averaged wall shear stress and the near-wall instantaneous vortices for DI1, the time oscillation control at
 $\unicode[STIX]{x1D714}^{+}=0.0378$
(
 $TU_{m}/H=10$
). In figure 7(c), the mean flow is from left to right, and the counter-clockwise wall rotation is taken as the positive direction seen along the mean flow. The streamwise length is
 $L_{x}/H=2\unicode[STIX]{x03C0}$
. The vortices are identified by the isosurfaces of the second invariant of the velocity gradient tensor (Hunt, Wray & Moin Reference Hunt, Wray and Moin1988). Eight phases (
 $\unicode[STIX]{x1D719}$
) were chosen from 0 to
 $7\unicode[STIX]{x03C0}/4$
with a step of
 $\unicode[STIX]{x03C0}/4$
in one oscillation period (
 $\bar{t}=tU_{m}/H$
from 0 to 8.75 at a step of 1.25). At
 $\unicode[STIX]{x1D719}=0$
(
 $\bar{t}=0$
), the circumferential velocity of the wall is zero but the displacement of the wall reaches its maximum. The rotation-induced vortices occupy the near-wall region and spread quasi-periodically along the streamwise direction due to the clockwise rotation before this phase, which severely enhances the radial momentum transportation in the near-wall region. Therefore, the surface-averaged wall shear stress reaches its maximum at
 $\unicode[STIX]{x1D719}=0$
(
 $\bar{t}=0$
). At
 $\unicode[STIX]{x1D719}=\unicode[STIX]{x03C0}/4$
(
 $\bar{t}=1.25$
), the wall is rotating in a counter-clockwise direction. The vortices induced by clockwise wall rotation are being destroyed and the intensity is weakened gradually. When the wall reaches its maximum rotation speed at
 $\unicode[STIX]{x1D719}=\unicode[STIX]{x03C0}/2$
(
 $\bar{t}=2.5$
), the vortices previously formed are destroyed completely, and the counter-clockwise wall rotation does not induce the formation of new vortices yet. Therefore, the vortical structure appears out of order, and the wall friction is relatively low. The counter-clockwise wall rotation-induced vortices are strengthened at
 $\unicode[STIX]{x1D719}=3\unicode[STIX]{x03C0}/4$
(
 $\bar{t}=3.75$
) until reaching maximum intensity and maximum surface-averaged wall shear stress at
 $\unicode[STIX]{x1D719}=\unicode[STIX]{x03C0}$
(
 $\bar{t}=5$
). After
 $\unicode[STIX]{x1D719}=\unicode[STIX]{x03C0}$
, the counter-clockwise wall rotation-induced vortices are weakened, and the clockwise wall rotation-induced vortices are strengthened gradually until
 $\unicode[STIX]{x1D719}=2\unicode[STIX]{x03C0}$
(
 $\bar{t}=10$
). The surface-averaged wall shear stress then reaches maximum again. This process is repeated periodically, corresponding to the oscillation of the wall.
The time history of circumferential wall velocity (a), the surface-averaged wall shear stress (b) and the near-wall instantaneous vortices (c) for DI1, the time oscillation control at
 $\unicode[STIX]{x1D714}^{+}=0.0378$
.

The streamwise distribution of circumferential wall velocity (a), the phase-averaged wall shear stress (b) and the near-wall instantaneous vortices (c) for DI2, the streamwise oscillation control at
 $k_{x}^{+}=0.0037$
.

Figure 8 shows the streamwise distribution of circumferential wall velocity, the phase-averaged wall shear stress and the near-wall instantaneous vortices for DI2, the streamwise oscillation control at
 $k_{x}^{+}=0.0037$
(
 $k_{x}H=1$
). It can be clearly seen that the rotation-induced vortices and the wall shear stress are modulated along the streamwise direction by the wave of circumferential wall velocity. The wall shear stress is high in the region that is occupied by the rotation-induced vortices but is relatively low elsewhere. The rotation-induced vortices are observed in the downstream region of the maximum rotation speed of the wall, which can be explained by the difference between the wave speed
 $c^{+}$
and the convective velocity
 $U_{c}^{+}$
. In the streamwise oscillation case,
 $c^{+}$
is zero, whereas
 $U_{c}^{+}\approx 10$
. Consequently, when the observer follows the wave, the phase of the circumferential wall velocity will lag behind that of the rotation-induced vortices.
Streamwise distribution of circumferential wall velocity (a), phase-averaged wall shear stress (b) and near-wall instantaneous vortices (c) for DI3, the travelling wave control at
 $k_{x}^{+}=0.0037$
and
 $\unicode[STIX]{x1D714}^{+}=0.0687$
.

Streamwise distribution of circumferential wall velocity (a), phase-averaged wall shear stress (b) and near-wall instantaneous vortices (c) for DI4, the travelling wave control at
 $k_{x}^{+}=0.0110$
and
 $\unicode[STIX]{x1D714}^{+}=0.0756$
.

Figures 9 and 10 show the streamwise distribution of circumferential wall velocity, the phase-averaged wall shear stress and the near-wall instantaneous vortices for DI3 and DI4, the two streamwise-travelling wave control cases at
 $k_{x}^{+}=0.0037$
,
 $\unicode[STIX]{x1D714}^{+}=0.0687$
(
 $k_{x}H=1$
,
 $\unicode[STIX]{x1D714}H/U_{m}=1.14$
) and
 $k_{x}^{+}=0.0110$
,
 $\unicode[STIX]{x1D714}^{+}=0.0756$
(
 $k_{x}H=3$
,
 $\unicode[STIX]{x1D714}H/U_{m}=1.26$
) respectively. The streamwise distribution of the rotation-induced vortices and the wall shear stress are also modulated along the streamwise direction by the wave of circumferential wall velocity, and the wall shear stress is also high in the region that is occupied by the rotation-induced vortices but is relatively low elsewhere, which are both very similar to the streamwise oscillation control case as shown in figure 8(b,c). In figure 9, the rotation-induced vortices are observed in the upstream region of the maximum rotation speed of the wall because the wave speed
 $c^{+}=18.6$
is greater than
 $U_{c}^{+}\approx 10$
. However, in figure 10, the wave speed
 $c^{+}=7$
is close to
 $U_{c}^{+}\approx 10$
; therefore, the phases of the rotation-induced vortices and the wave of the wall oscillation are almost same.
Mean square of circumferential vorticity fluctuations
 $\langle \unicode[STIX]{x1D714}_{\unicode[STIX]{x1D703}}^{\prime }\unicode[STIX]{x1D714}_{\unicode[STIX]{x1D703}}^{\prime }\rangle ^{+}$
.
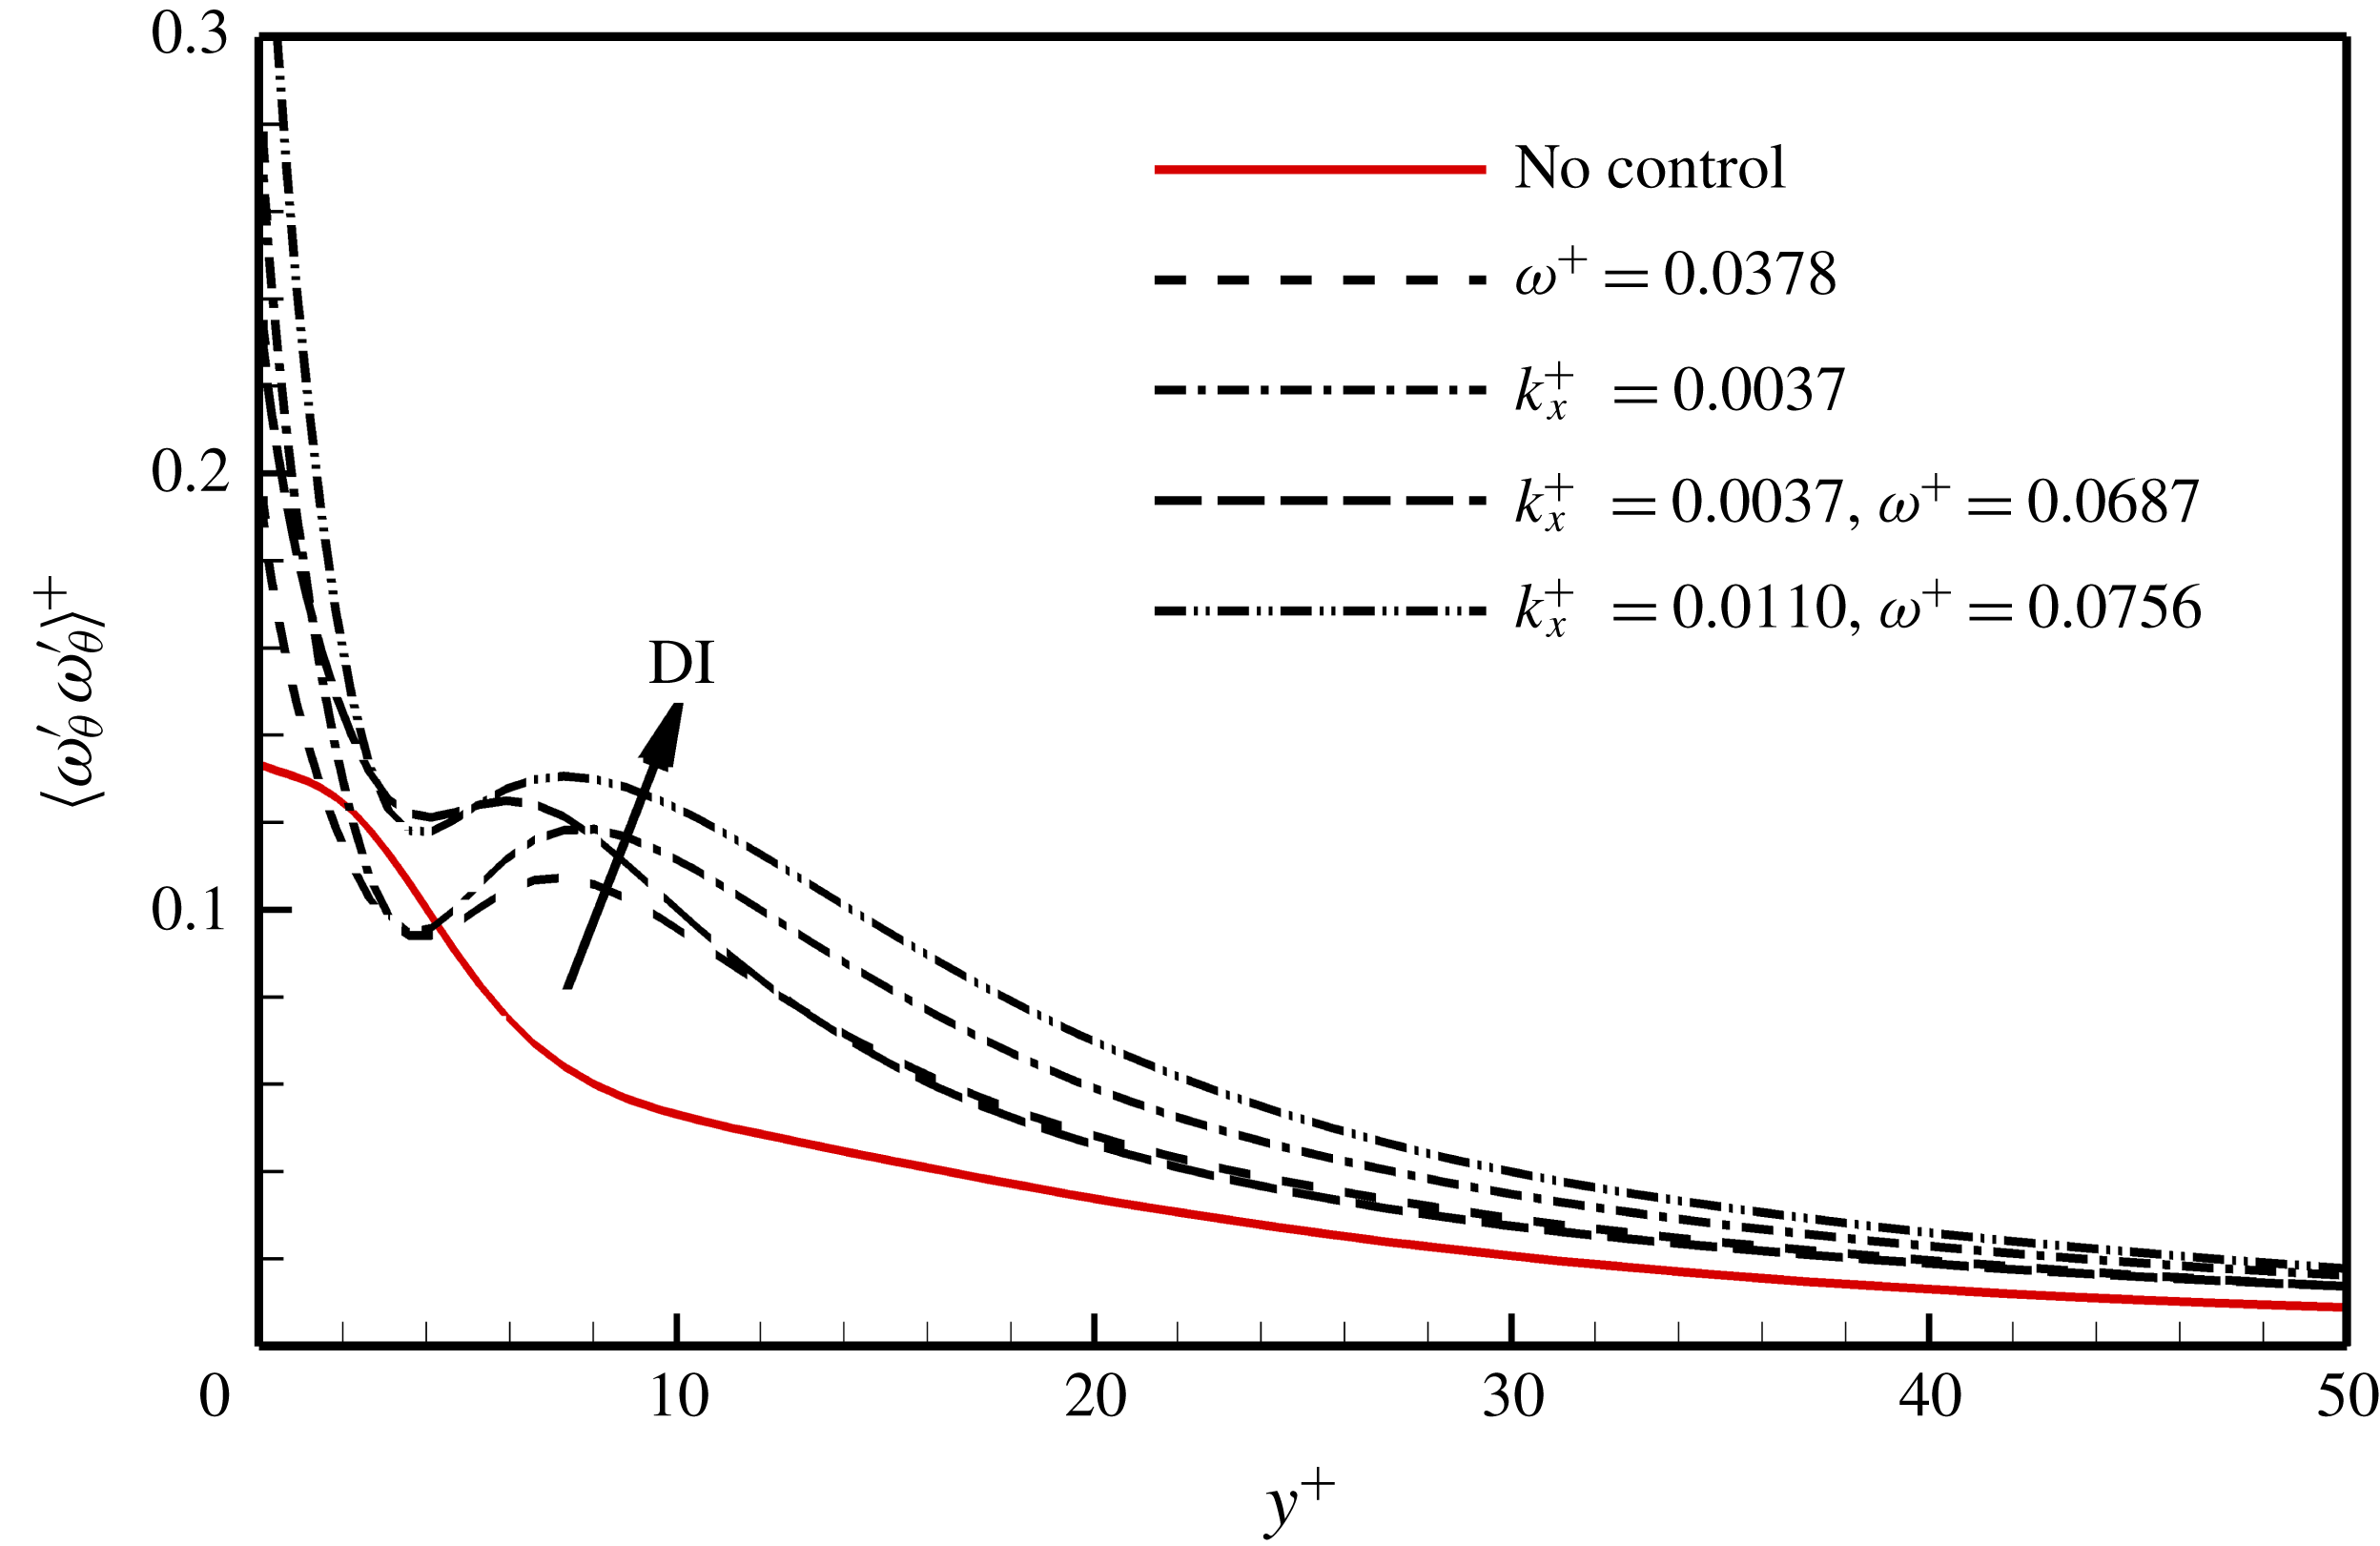
Figure 11 shows the circumferential vorticity fluctuations
 $\langle \unicode[STIX]{x1D714}_{\unicode[STIX]{x1D703}}^{\prime }\unicode[STIX]{x1D714}_{\unicode[STIX]{x1D703}}^{\prime }\rangle ^{+}$
in the near-wall region as a function of
 $y^{+}$
for the four DI cases. The off-wall peak is related to the rotation-induced vortices: the peak value indicates the intensity of the vortices and the peak position can be considered as the averaged location of the vortex cores. The distance between the off-wall maximum and minimum positions corresponds to the average size of the vortices (Kim, Moin & Moser Reference Kim, Moin and Moser1987). It is shown that due to the wall rotation, the circumferential vorticity fluctuations are enhanced in all the DI cases in comparison with the reference uncontrolled flow, especially in the near-wall region of
 $y^{+}<30$
. The off-wall peak value increases with increasing the DI rate, indicating a positive correlation between the intensity of the rotation-induced vortices and the friction drag. The off-wall peak position is at approximately
 $y_{c}^{+}\approx 7$
and the radius of the vortices is approximately
 $r^{+}\approx 4$
, indicating that the rotation-induced vortices are much smaller and located closer to the wall than the streamwise vortices (
 $y_{c}^{+}\approx 20$
and
 $r^{+}\approx 15$
, Kim et al. (Reference Kim, Moin and Moser1987)).
The streamwise energy spectra of radial velocity fluctuation at
 $y^{+}\approx 7$
.

Figure 12 shows the streamwise energy spectra of the radial velocity fluctuations for the four DI cases. For the uncontrolled flow, the energy decays monotonically as the wavenumber increases. However, in all the DI cases, new peaks appear in the spectrum at high wavenumbers, approximately
 $k_{x}H\approx 26$
(
 $k_{x}^{+}\approx 0.0956$
). The peak value is greater at larger DI rates. According to the wavenumber of the new peak, the averaged streamwise spacing of the rotation-induced vortices can be estimated as
 $\unicode[STIX]{x0394}x_{R}/H=0.24$
or
 $\unicode[STIX]{x0394}x_{R}^{+}=65.7$
.
Although the vortices in the four DI cases shown in figures 7–10 are quite different in size, wall-normal position and streamwise distribution from the near-wall streamwise vortices in canonical wall-bounded turbulent flows, it deserves further investigation to elucidate that they originate from the centrifugal instability and not the reorientation due to the circumferential wall motion. We first resorted to the linear stability analysis of the Stokes layer induced by the pure rotation of the cylinder in the literature. Kuwabara & Takaki (Reference Kuwabara and Takaki1975) gave the neutral stability curve in the Reynolds number–wavenumber plane for various ratios of the cylinder radius to the Stokes layer thickness. This can be used to verify the rotation-induced instability in the present flows. To see the influence of the axial flows, which are coupled with the Stokes layer in the present controlled flows, two simulations with the absence of the axial flow are performed for a pure time oscillation case with
 $TU_{m}/H=10$
(the same as DI1) and a pure streamwise oscillation case with
 $k_{x}H=1$
(the same as DI2). They are compared with DI1 and DI2, respectively.
Comparison of the two time oscillation cases with and without axial flow: (a) profiles of
 $u_{\unicode[STIX]{x1D703}}$
at different phases; near-wall instantaneous vortices for the cases (b) without and (c) with axial flow; (d) distribution of
 $\langle \unicode[STIX]{x1D714}_{\unicode[STIX]{x1D703}}^{\prime }\unicode[STIX]{x1D714}_{\unicode[STIX]{x1D703}}^{\prime }\rangle ^{+}$
; (e) streamwise energy spectra of the radial velocity fluctuations; (f) near-wall instantaneous vortices viewed from the cylinder wall to the plane at
 $y^{+}=10$
in the case with axial flow, where the black line shows the orientation of the vortices.

Figure 13 compares the pure time oscillation case with DI1. The influence ranges of the wall oscillation are the same, not affected by the axial flow, as shown in figure 13(a). Figure 13(b,c) shows the near-wall instantaneous vortices, which follow the wall motion in both cases. The vortices are intensified at
 $\unicode[STIX]{x1D719}=0$
but suppressed at
 $\unicode[STIX]{x1D719}=\unicode[STIX]{x03C0}/2$
. In figure 13(d), the maximum positions of the circumferential vorticity fluctuations
 $\langle \unicode[STIX]{x1D714}_{\unicode[STIX]{x1D703}}^{\prime }\unicode[STIX]{x1D714}_{\unicode[STIX]{x1D703}}^{\prime }\rangle ^{+}$
for both cases are located at approximately
 $y^{+}=7\sim 10$
and the distances between the local maximum and minimum are approximately
 $r^{+}=4\sim 6$
, indicating that the axial flow has negligible influence on the size and location of the vortices. Figure 13(e) shows the streamwise energy spectra of the radial velocity fluctuations. When the circumferential oscillation is coupled with axial flow, the peak appears at
 $k_{x}H\approx 26$
, whereas, in pure wall oscillation flow, it appears at
 $k_{x}H\approx 37$
. Considering the inclined angle between the rotation-induced vortices and the streamwise direction is approximately
 $45^{^{\circ }}$
in the case with axial flow, as shown in figure 13(f), the wavenumber perpendicular to the elongation direction of the vortices is also approximately
 $k_{x}H\approx 37$
, which corresponds very well to that in pure wall oscillation flow. In these two cases, the Reynolds number and wavenumber are 1500 and 12.3, respectively, as used in Kuwabara & Takaki (Reference Kuwabara and Takaki1975), and the ratio between the cylinder radius to the Stokes layer thickness is
 $\unicode[STIX]{x1D6FC}=17.3$
. With these parameters, the cases fall into the unstable area, as can be seen from figures 2 and 3 of Kuwabara & Takaki (Reference Kuwabara and Takaki1975).
Comparison of the two streamwise oscillation cases with and without axial flow. Figure captions are the same as in figure 13.

Figure 14 compares the pure streamwise oscillation case with DI2. The profiles of
 $u_{\unicode[STIX]{x1D703}}$
shown in figure 14(a) indicate that the influence ranges of the wall oscillation are very different in these two cases. When there is no axial flow, the wall motion can affect the region very far from the wall. Figure 14(b,c) shows the near-wall instantaneous vortices, which are intensified near the region with large wall velocity and are suppressed in other regions. The distribution of
 $\langle \unicode[STIX]{x1D714}_{\unicode[STIX]{x1D703}}^{\prime }\unicode[STIX]{x1D714}_{\unicode[STIX]{x1D703}}^{\prime }\rangle ^{+}$
shown in figure 14(d) indicates the core location and size of the vortices are similar to those in the time oscillation case. Figure 14(e) shows the streamwise energy spectra of the radial velocity fluctuations. The peaks both appears at the wavenumber
 $k_{x}H\approx 26$
. Considering the inclination angle of the vortices to the streamwise direction is approximately
 $45^{^{\circ }}$
in DI2 as shown in figure 14(f), the wavenumber perpendicular to the elongation direction of the vortices is also approximately
 $k_{x}H\approx 37$
, which also falls into the unstable area according to the neutral stability curve obtained by Kuwabara & Takaki (Reference Kuwabara and Takaki1975). However, this wavenumber does not agree with that in pure streamwise oscillation flow. This discrepancy in wavenumber results from the fact that the ratios of the cylinder radius to the thickness of the Stokes layer are too different in these two cases.
Relationship between DR rate and the effective time period
 $1/\unicode[STIX]{x1D714}_{e}^{+}$
.

For the DI cases near the thick solid line in figure 4 (representing the case with
 $c^{+}=U_{c}^{+}$
), the rotation-induced vortices play a dominant role in the near-wall region to enhance the wall-normal momentum transport. When the wave speed
 $c^{+}$
of the control is closer to the convective velocity
 $U_{c}^{+}$
, the effective wavenumber
 $k_{xe}^{+}$
or frequency
 $\unicode[STIX]{x1D714}_{e}^{+}$
is smaller, and the effective wavelength
 $\unicode[STIX]{x1D706}_{xe}^{+}$
or time period
 $T_{e}^{+}$
is larger, which makes the rotation-induced vortices be fully developed and results in the locally larger DI rate. Therefore, the effective wavenumber
 $k_{xe}^{+}$
or frequency
 $\unicode[STIX]{x1D714}_{e}^{+}$
is a key parameter to scale the DR rate. Figure 5 has shown that the DR rates in the T region and S region collapse well when scaled by the effective thickness of the Stokes layer. Therefore, the transformation
 $$\begin{eqnarray}\unicode[STIX]{x1D714}_{e}^{+}=(k_{xe}^{+})^{2/3}\end{eqnarray}$$
can be used to estimate the effective frequency
 $\unicode[STIX]{x1D714}_{e}^{+}$
in the S region. Figure 15 plots the DR rate as a function of the effective time period
 $1/\unicode[STIX]{x1D714}_{e}^{+}$
for all cases satisfying
 $\unicode[STIX]{x1D6FF}_{e}^{+}>4$
. There is a sudden fall of the DR rate due to the centrifugal instability. When the effective Stokes layer penetrates into the main flow deeper, the rotation-induced vortices enhance the radial component of velocity fluctuations and consequently increase the wall shear stress. The tendency of the DR rate can be regressed by a monotonically decreasing exponential function (red line). When the effective time period
 $1/\unicode[STIX]{x1D714}_{e}^{+}>100$
(corresponding to
 $\unicode[STIX]{x1D6FF}_{e}^{+}>10$
), the DR rate tends to a value of
 $-40\,\%$
. The influence of the rotation-induced vortices on the near-wall flow is saturated.
3.3 Effect of transverse wall curvature
The above discussion is based on the simulated flows in the geometry with
 $R_{2}=4R_{1}$
. To quantitatively understand the effect of transverse wall curvature on the control, we performed some additional direct numerical simulations in the domain with
 $R_{2}=2R_{1}$
. The wall curvature
 $1/R_{1}$
normalised by the momentum thickness
 $\unicode[STIX]{x1D703}$
is denoted as
 $\unicode[STIX]{x1D700}=\unicode[STIX]{x1D703}/R_{1}$
. The geometry with
 $R_{2}=4R_{1}$
used in the above discussions corresponds to
 $\unicode[STIX]{x1D700}=0.25$
, and the cylinder with
 $R_{2}=2R_{1}$
used in this section has the non-dimensionalised curvature of
 $\unicode[STIX]{x1D700}=0.097$
. The DR rates in these two cases are compared with each other and with those in plane channel (Quadrio et al.
Reference Quadrio, Ricco and Viotti2009) corresponding to
 $\unicode[STIX]{x1D700}=0$
.
Variation of DR rates for time oscillation (a) and streamwise oscillation (b) control.

Figure 16 shows the DR rates for time oscillation and streamwise oscillation control in cases of
 $\unicode[STIX]{x1D700}=0.25$
and
 $\unicode[STIX]{x1D700}=0.097$
, respectively. For time oscillation control, the maximum DR rates are around 45 % in both cases and the corresponding optimal oscillation periods are both at
 $T^{+}\approx 120$
, which are slightly higher than that in plane channel flow (
 $T^{+}\approx 100$
, Quadrio et al. (Reference Quadrio, Ricco and Viotti2009)). But the turning points from DR to DI are at
 $T^{+}\approx 250$
when
 $\unicode[STIX]{x1D700}=0.097$
, and at
 $T^{+}\approx 150$
when
 $\unicode[STIX]{x1D700}=0.25$
. The maximum DR rates in the streamwise oscillation controls are also around 45 % with both curvatures, but are achieved at
 $\unicode[STIX]{x1D706}_{x}^{+}\approx 425$
when
 $\unicode[STIX]{x1D700}=0.25_{}$
and at
 $\unicode[STIX]{x1D706}_{x}^{+}\approx 842$
when
 $\unicode[STIX]{x1D700}=0.097$
. The turning point from DR to DI moves from
 $\unicode[STIX]{x1D706}_{x}^{+}\approx 1000$
to
 $\unicode[STIX]{x1D706}_{x}^{+}\approx 2500$
when the curvature decreases. As discussed in § 3.2, the centrifugal instability due to the transverse wall curvature has a strong effect on drag increase. Figure 16 also verifies that as the wall curvature increases, the DI rate also increases. The turning period and wavelength reduces at larger curvature because the centrifugal instability is stronger and the rotation-induced vortices grow faster as compared with those at smaller curvature.
Figure 17 shows the DI regions in the
 $(\unicode[STIX]{x1D714}^{+},k_{x}^{+})$
plane for
 $\unicode[STIX]{x1D700}=0.25$
,
 $\unicode[STIX]{x1D700}=0.097$
and
 $\unicode[STIX]{x1D700}=0$
(Quadrio et al.
Reference Quadrio, Ricco and Viotti2009). As the wall curvature decreases (from a to c in figure 17), the area of DI region also decreases and the point of
 $\text{DR}=0_{}$
on the axis moves closer to the origin of the coordinates. This fact means that in turbulent flows along a cylinder with circumferential wall movements, the instability-induced vortices need more time (
 $1/\unicode[STIX]{x1D714}_{e}^{+}$
) or a larger space (
 $1/k_{xe}^{+}$
) to develop when the wall curvature decreases. In addition, at
 $\unicode[STIX]{x1D714}^{+}=0.038$
and
 $k_{x}^{+}=0.0037$
, where the phase speed is
 $c^{+}=10.3$
, nearly the same as the convective velocity in the near-wall region, the DI rate decreases dramatically when the wall curvature decreases, which is also owing to the weakening or even the disappearance of centrifugal instability.
DI region in
 $(\unicode[STIX]{x1D714}^{+},k_{x}^{+})$
plane for
 $\unicode[STIX]{x1D700}=0.25$
(a),
 $\unicode[STIX]{x1D700}=0.097$
(b) and
 $\unicode[STIX]{x1D700}=0$
(Quadrio et al.
Reference Quadrio, Ricco and Viotti2009) (c). The number in the circle indicates the DR or DI rate, the empty circle implies drag reduction and the filled circle implies drag increase.

3.4 Net energy saving
The above discussion is only from the viewpoint of the drag-reduction rate, and it is necessary to consider the net energy saving in the evaluation of the control.
In an ideal actuation system that only takes into account the energy expenditure due to viscous stresses, the power cost of the control normalised by the power driving the uncontrolled main flow can be calculated by
 $$\begin{eqnarray}P_{spend}=\frac{1}{2\unicode[STIX]{x03C0}\unicode[STIX]{x1D70F}_{w}U_{m}L_{x}T_{T}}\int _{0}^{L_{x}}\int _{0}^{2\unicode[STIX]{x03C0}}\int _{0}^{T_{T}}u_{\unicode[STIX]{x1D703}wall}\unicode[STIX]{x1D70F}_{r\unicode[STIX]{x1D703}wall}\,\text{d}t\,\text{d}\unicode[STIX]{x1D703}\,\text{d}x,\end{eqnarray}$$
where
 $T_{T}$
is the total sampling time,
 $\unicode[STIX]{x1D70F}_{w}=\unicode[STIX]{x1D707}(\text{d}\langle u_{x}\rangle /\text{d}r)_{wall}$
is the mean wall shear stress in the streamwise direction and
 $\unicode[STIX]{x1D70F}_{r\unicode[STIX]{x1D703}wall}=\unicode[STIX]{x1D707}(\unicode[STIX]{x2202}u_{\unicode[STIX]{x1D703}}/\unicode[STIX]{x2202}r-u_{\unicode[STIX]{x1D703}}/r)_{wall}$
is the instantaneous wall shear stress in the circumferential direction,
 $\unicode[STIX]{x1D707}$
is the kinetic viscosity of the fluid,
 $\langle \,\rangle$
denotes averaging in time as well as in the
 $x$
and
 $\unicode[STIX]{x1D703}$
directions. The normalised saving of power due to the reduced friction drag equals the DR rate, i.e.
 $$\begin{eqnarray}P_{save}=\text{DR}.\end{eqnarray}$$
Therefore, the net energy saving is
 $$\begin{eqnarray}P_{net}=P_{save}-P_{spend}.\end{eqnarray}$$
Since
 $P_{spend}$
is directly related to the control amplitude
 $A$
, therefore we performed additional direct numerical simulations with
 $A=0.5U_{m}$
(
 $A^{+}=8$
) and
 $A=0.25U_{m}$
(
 $A^{+}=4$
) in addition to the above
 $A=U_{m}$
(
 $A^{+}=16$
) cases at the maximum DR rate for the three kinds of control under the condition of
 $A=U_{m}$
, that is, for time oscillation control at
 $\unicode[STIX]{x1D714}^{+}=0.0504$
, for streamwise oscillation control at
 $k_{x}^{+}=0.0148$
and for streamwise-travelling wave control at
 $(k_{x}^{+},\unicode[STIX]{x1D714}^{+})=(0.0147,0.0126)$
. As shown in figure 18,
 $P_{spend}$
is much higher than
 $P_{save}$
at
 $A=U_{m}$
for all the three kinds of control, therefore no net energy saving can be obtained in these cases. When the control amplitude is reduced to
 $A=0.5U_{m}$
,
 $P_{spend}$
decreases sharply but
 $P_{save}$
just drops slightly, so
 $P_{net}$
can be positive. For example,
 $P_{net}$
is still negative for time oscillation control (
 $-3.3\,\%$
), and becomes positive for streamwise oscillation control and streamwise-travelling wave control (
 $5.8\,\%$
and
 $10.6\,\%$
, respectively). If further reducing the control amplitude to
 $A=0.25U_{m}$
,
 $P_{net}$
is further increased to 10.2 %, 13.7 % and 18.1 % for the time oscillation, streamwise oscillation and streamwise-travelling wave controls, but with a lower DR rate of 19.2 %, 21.7 % and 25.2 %, respectively. The net energy saving in the present cylinder flows is also compared with that in channel flows. For the time oscillation cases shown in figure 18(a),
 $P_{net}$
is approximately 10.3 %,
 $-$
3.3 % and
 $-$
100 % at
 $A/U_{m}=\quad 0.25$
,
 $0.5$
and
 $1$
respectively, which is almost the same as that in channel flow (Baron & Quadrio Reference Baron and Quadrio1996). However, for the streamwise travelling wave controls shown in figure 18(c),
 $P_{net}$
in the present cylinder flow is apparently lower than that in channel flow (Quadrio et al.
Reference Quadrio, Ricco and Viotti2009). This difference may be attributed to the different optimal control parameters between the present flow with
 $(k_{x}^{+},\unicode[STIX]{x1D714}^{+})=(0.0147,0.0126)$
and the channel flow with
 $(k_{x}^{+},\unicode[STIX]{x1D714}^{+})=(0.0083,0.0192)$
.
Variation of
 $P_{spend}$
,
 $P_{save}$
and
 $P_{net}$
with control amplitude
 $A$
at the maximum DR rates for time oscillation (a), streamwise oscillation (b) and streamwise-travelling wave controls (c), respectively.

4 Conclusion
The drag reduction in turbulent flows along a cylinder is studied by direct numerical simulations. Three forms of circumferential wall motion are considered: the time oscillation, the streamwise oscillation and the streamwise-travelling wave.
A map of DR rate varying with control frequency
 $\unicode[STIX]{x1D714}^{+}$
and wavenumber
 $k_{x}^{+}$
is obtained at the control amplitude
 $A^{+}=16$
and the reference friction Reynolds number
 $Re_{\unicode[STIX]{x1D70F}}=272$
with the cylinder wall curvature of
 $\unicode[STIX]{x1D700}=0.25$
. The maximum DR rate and the maximum DI rate are both around 48 %. The former is similar to that obtained in channel flow (Quadrio et al.
Reference Quadrio, Ricco and Viotti2009), but the latter is almost twice of that of channel flow. The maximum DI is achieved at a wave speed
 $c^{+}$
very close to the convection velocity of near-wall coherent structures
 $U_{c}^{+}$
. The line crossing the origin with the slope of
 $U_{c}^{+}=10$
demarcates the DR map into the S region and T region. By transforming the streamwise-travelling wave control into streamwise oscillation control in the S region and time oscillation control in the T region, the effective wavenumber and effective frequency are respectively introduced and the effective thickness of the Stokes layer is defined. The DR rates collapse well as a function of the effective thickness of the Stokes layer.
In DI cases, the rotation-induced vortices become the primary coherent structures in the near-wall region, which are responsible for the increase of wall skin friction. The averaged core location of the rotation-induced vortices is at
 $y_{c}^{+}\approx 7$
and their radius is
 $r^{+}\approx 4$
. The rotation-induced vortices are much closer to the wall and much smaller than the streamwise vortices. The mean streamwise spacing of the vortices is approximately 65 wall units. To scale the DI rate in the centrifugal instability-dominated cases (cases satisfying
 $T_{s}^{+}>120$
), the present work attributes the drag increase to the spreading of rotation-induced vortices; that is, the wall skin friction is increased more for cases with more developed vortices. An exponential regression is obtained perfectly for all of the
 $\unicode[STIX]{x1D6FF}_{e}^{+}>4$
cases.
The effect of the transverse wall curvature on drag-reduction behaviour is also examined by performing additional DNSs to time oscillation control and streamwise oscillation control with the cylinder wall curvature of
 $\unicode[STIX]{x1D700}=0.097$
. The results are compared with those of the
 $\unicode[STIX]{x1D700}=0.25$
and
 $\unicode[STIX]{x1D700}=0$
(channel) cases. As the wall curvature increases, the maximum DR rate is almost unchanged, but the turning from DR to DI happens earlier with smaller
 $T^{+}$
and
 $\unicode[STIX]{x1D706}_{x}^{+}$
for time oscillation and streamwise oscillation controls respectively. The DI rates are also considerably increased in both controls. The DI region in the (
 $\unicode[STIX]{x1D714}^{+},k_{x}^{+}$
) plane shrinks when the wall curvature decreases, and consequently, the map of DR rate converges to that of plane channel flow.
Additional DNSs with
 $A^{+}=8$
and
 $A^{+}=4$
are conducted to evaluate the net energy saving of the controls. At
 $A^{+}=16$
,
 $P_{spend}$
is much higher than
 $P_{save}$
for all the three kinds of control, while when the control amplitude is reduced to
 $A^{+}=8$
,
 $P_{net}$
becomes positive for streamwise oscillation and streamwise-travelling wave controls. At
 $A^{+}=4$
,
 $P_{net}$
values of 10.2 %, 13.7 % and 18.1 % could be achieved for the time oscillation, streamwise oscillation and streamwise-travelling wave controls with DR rates of 19.2 %, 21.7 % and 25.2 %, respectively. Compared with channel flows (Baron & Quadrio Reference Baron and Quadrio1996; Quadrio et al.
Reference Quadrio, Ricco and Viotti2009), the net energy saving in the present cylinder flow is almost unchanged for time oscillation controls, but becomes apparently lower for streamwise-travelling wave controls.
Acknowledgement
The work is supported by the National Natural Science Foundation of China (grant nos 91752205, 11490551, 11472154 and 11772172).



