

Background
Head and neck (HN) cancer treatment is one of the most difficult treatments to plan, due to target volume shape, high dose prescription, complex patient anatomy, as well as to several organs at risk (OARs) surrounding the target volume. Thus, planning has to balance between the dose coverage of planning target volumes (PTVs) and the dose constraints to OARs.
To overcome planning difficulties, highly sophisticated techniques, such as fixed-gantry intensity-modulated radiation therapy (IMRT), rotating-gantry intensity-modulated arc therapy or volumetric-modulated arc therapy, have been developed improving significantly the resulting dose distribution in HN cancer treatment.Reference Bär, Schwarz and Alber 1 – Reference White, Chan, Cheng, Chan and Chau 4 The use of IMRT beams, together with inverse planning, allows increasing the dose to the PTVs while minimising the irradiation to OARs and normal tissue. Several studies have been performed for HN cancer treatment and proved that a partial sparing of parotid glands results in preservation of salivary flow, greatly improving the quality of life for patients.Reference Eisbruch, Ten Haken, Kim, Marsh and Ship 5 , Reference Parliament, Scrimger and Anderson 6 As an example, Marta et al.Reference Marta, Silva and de Andrade Carvalho 7 found that IMRT could reduce the incidence of grade 2–4 xerostomia in patients with HN cancers without compromising loco-regional control and overall survival, when compared with two-dimensional or three-dimensional conformal radiation therapy.
In IMRT plans of HN cancer, five to nine beams are sufficient to reach clinically acceptable doses within target volumes, with a good protection of parotid glands.Reference Van Asselen, Dehnad, Terhaard, Lagendijk and Raaijmakers 8 , Reference Samuelsson and Johansson 9 Wu et al.Reference Wu, Manning, Schmidt-Ullrich and Mohan 10 report that the quality of plans improves with the number of beams, but reaches a saturation level, which for those plans was found to be nine. According to Popple et al.,Reference Popple, Fiveash and Brezovich 11 who investigated the effect of IMRT beam number on OAR sparing in complex HN plans from 5 to 27, the optimal trade-off seems to be seven to nine equispaced beams, although beam geometry optimisation may reduce the number of beams required to provide adequate target coverage.
As for advanced laryngeal cancer, few studies have focused on IMRT treatment, but it is thought that, as for other HN cancer sites, IMRT can be advantageous over conventional radiotherapy techniques, which often need a troublesome low-neck junction to cover the lower extent of the caudal PTV.Reference Merlotti, Alterio and Vigna-Taglianti 12 A recent paperReference Dobler, Obermeier, Hautmann, Khemissi and Koelbl 13 compared IMRT plans for the treatment of hypopharynx/larynx cancer, delivered in the two irradiation modes with and without flattening filter; in both cases, nine equispaced beams were used.
In this study, we aimed at optimising treatment with seven equispaced IMRT beams, a number which could be a compromise between ensuring a good clinical quality and keeping an acceptable delivery time. Optimisation was pursued by varying the beam entrance angles or by splitting the treatment into two phases, each using different beam entrance angles. Thus we investigated three different IMRT planning techniques, used for each patient by the same equipment, in order to compare their performance and their effect on OARs sparing and target volume coverage. The first technique (IMRT-0) comprised seven equally spaced beams, which started from 0° and ended at 312°. The same beam numbers are used in the second technique (IMRT-26) but shifted to an angle of 26° (this shift could be slightly different depending on patients anatomy) with respect to the first technique. The third technique (IMRT-CT) is obtained by the combination of the first and second techniques in the same plan. This permits the increase of beam entries to PTVs, and thus an improvement of dose distribution. Spearing of OARs (parotid glands, spinal cord, mandible, brainstem) and healthy tissue (PTVs subtracted from the body) was statistically significant. The objective is to find which technique is the most advantageous with respect to plan quality (homogeneity/conformity of PTV dose), minimisation of OAR doses and delivery time.
Methods
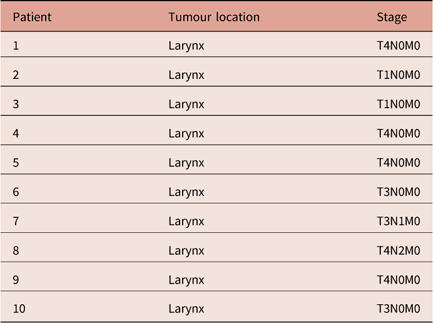
A retrospective planning study was conducted on a sample of 10 consecutive patients who had been treated for larynx cancer in our Department. Most patients presented an advanced cancer stage as detailed in Table 1.
Sample Patient characteristics

All patients were immobilised in supine position, with HN thermoplastic mask attached at five fixation points to a carbon-fibre plate support.
CT simulation was performed in 3-mm slices using Siemens Somatom Sensation Open CT (Siemens, Erlangen, Germany). Target volumes and OARs were delineated using Varian SOMAVISION Focal workstations v.10.0.28 (Varian, Palo Alto, CA, USA). PTVs delineation for two different dose levels (PTV boost and PTV elective) was made on transverse CT datasets. The primary gross tumour volume (GTV) and clinical target volume (CTV) were contoured by radiation oncologists. The GTV was defined as the gross extent of the tumour. The boost CTV included the GTV and potential direct routes of microscopic spread; the elective CTV included the elective nodes according to internationally accepted guidelines. PTV was defined as CTV with a uniform margin of 5 mm, thus taking into account organ motion and set-up errors.
OARs included parotid glands, spinal cord, mandible, brainstem. An additional volume, the ‘healthy tissue’, defined as the body covered by the CT scan minus the PTVs, was introduced to help to minimise the dose outside PTVs and OARs during the inverse planning and to have a metrics for low-dose distribution in the patient.
Dose optimisation and calculation were performed in a Varian Eclipse treatment planning system by using the AAA Algorithm (v.10.0.28) and 6 MV beams from a Varian Clinac 2300 DHX (Varian) linear accelerator equipped with an 80-leaf dynamic MLC, with 1-cm leaf width projected at the isocenter. Two different dose levels of 2·12 Gy/fraction to the PTV-boost and 1·65 Gy/fraction to the PTV-elective were prescribed for a total dose of 69·96 Gy and 54·45 Gy, respectively, delivered in 33 fractions with a simultaneously integrated boost (SIB) IMRT technique.
Three sets of plans were generated and compared for this study by applying to each patient three IMRT techniques, differing in geometrical beam configuration. All techniques used coplanar equally spaced beams as the 3D geometry of PTVs does not allow to choose preferential entrance angles straightly. Moreover, as shown by Stein et al.,Reference Stein, Mohan and Wang 14 optimising beam orientations is most valuable for a small number of beams (≤5) and the gain diminishes rapidly for higher numbers of beams.
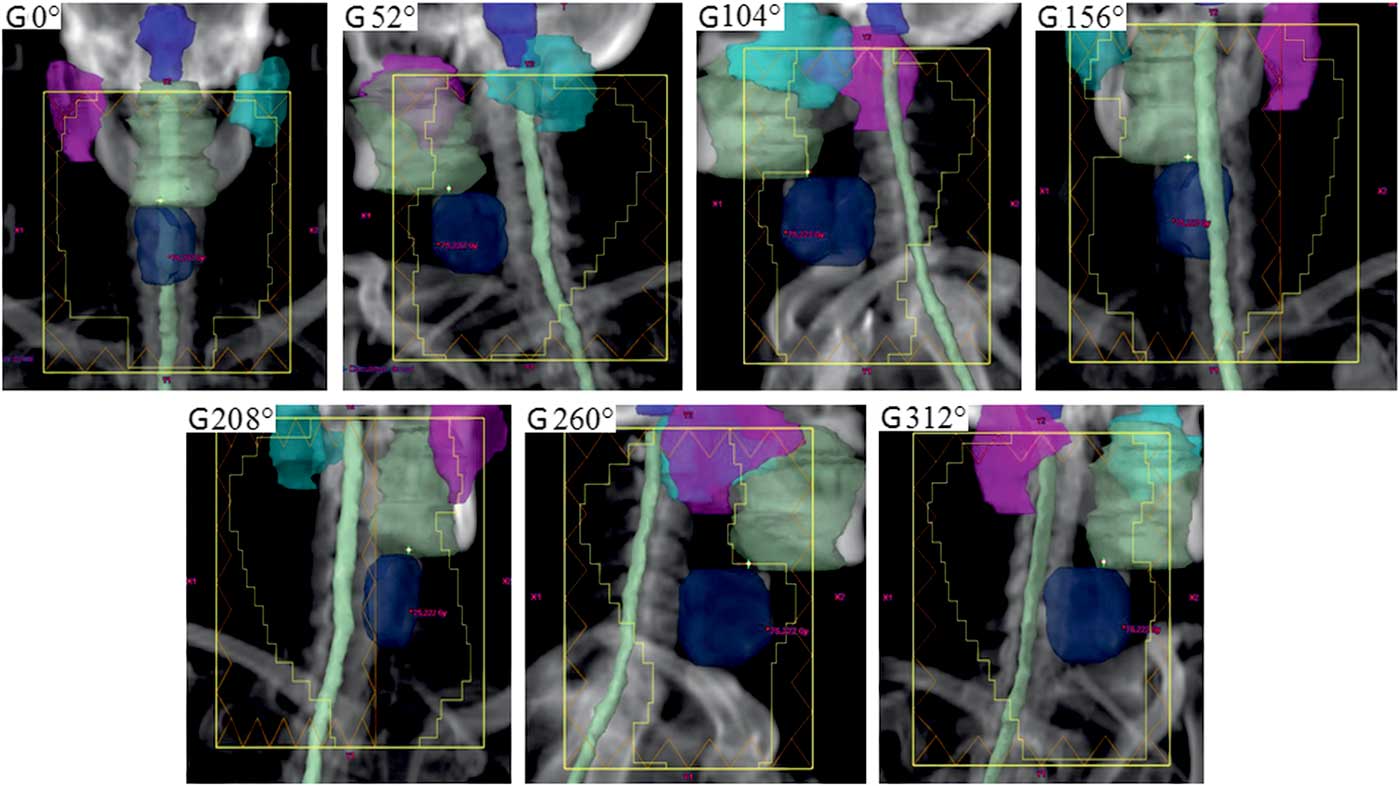
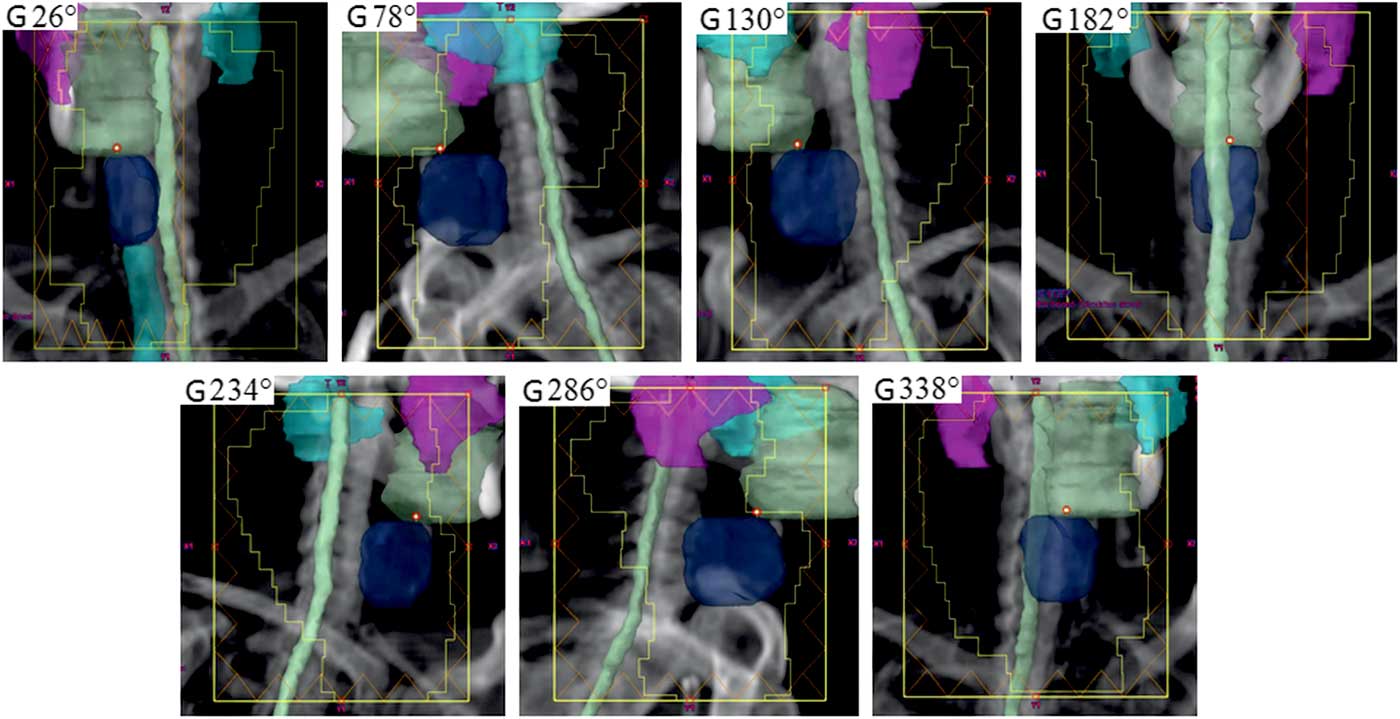
In the first technique (IMRT-0), beam geometry consisted of 129 seven equally spaced fields (gantry angles: 0°, 52°, 104°, 156°, 208°, 260°, 312°). In the second technique (IMRT-26), beam angles are shifted by 26° with respect to the first technique (gantry angles: 26°, 78°, 130°, 182°, 234°, 286°, 338°). The rationale for this angle shift is to exploit the observation of OARs partially enclosed by the target volume (parotids, in our case), whose the beams coming from their direction allow greater control on dose distributions.Reference Stein, Mohan and Wang 14
The third technique (IMRT-CT) consists in delivering the first 17 fractions using the IMRT-0 technique and the last 16 fractions using the IMRT-26 technique. Figures 1 and 2 show the beam’s eye view at the seven gantry angles of the IMRT-0 and IMRT-26 techniques, respectively, for a sample patient, with the contoured PTVs and OARs highlighted.
Beam’s eye view at the seven gantry angles of the IMRT-0 planning technique (0°, 52°, 104°, 156°, 208°, 260°, 312°). Note: The planning target volume-boost is in light green colour, spinal cord in light grey, brainstem in solid blue, left parotid in blue-sky, right parotid in purple and mandible in white. Abbreviation: IMRT, intensity-modulated radiation therapy.

Beam’s eye view at the seven gantry angles of the IMRT-26 planning technique (26°, 78°, 130°, 182°, 234°, 286°, 338°). Note: The planning target volume-boost is in light green, spinal cord in light grey, brainstem in solid blue, left parotid in blue-sky, right parotid in purple and mandible in white. Abbreviation: IMRT, intensity-modulated radiation therapy.

As a planning objective for PTV coverage, at least the 95% of the prescribed dose was requested to cover 98% of the target volume (near-minimum dose D 98%>95%) for both boost and elective PTVs. In addition, 107% of the prescribed dose was set as an upper limit on the near-maximum dose D 2%, that is the dose to the ‘hottest’ 2% volume of each PTV (D 2%<107%).
As for OARs and healthy tissue, the main planning objective was to minimise the dose as much as possible while keeping the maximum homogeneity and conformity of the dose to the PTVs. The mean dose of each parotid should be <26 Gy as suggested in Eisbruch et al.Reference Eisbruch, Ten Haken, Kim, Marsh and Ship 5 When both parotids are exposed to higher doses, noxious effects can affect patient quality of life.Reference Huguenin, Taussky and Moe 15 – Reference Eisbruch, Marsh and Martel 17 For the other OARs, the maximum (point) dose D max was constrained to be <45 Gy for the spinal cord, 54 Gy for the brainstem, 70 Gy for the mandible.
After the completion of treatment planning, plan quality was assessed by analysing the dose–volume histograms (DVH) of PTVs and OARs, and comparing results with the planning objectives and constraints.
The homogeneity index (HI) was used to evaluate the homogeneity of the dose in each PTV, as defined by the formula:
 $${\rm HI{\equals}}\left( {D_{{{\rm 2\,\%\,}}} {\minus}D_{{{\rm 98\,\%\,}}} } \right){\rm \,/\,}D_{{\rm 1}} ,$$
where D 1 is the prescribed dose to PTV.Reference Kataria, Sharma, Subramani, Karrthick and Bisht 18 , Reference Yoon, Park and Shin 19 The ideal value of HI is 0 as it decreases by increasing the dose homogeneity inside the volume of interest.
Moreover, the conformity index (CI) was calculated to estimate the degree of the conformity of the dose to the PTV volume, according to the Radiation Therapy Oncology Group (USA) definition:
 $${\rm CI{\equals}}V_{{{\rm RI}}} {\rm \,/\,}V_{{{\rm TV}}} ,$$
where V RI is the volume of 95% of the prescribed dose and V TV the total volume of the PTV. With this definition, CI=1 corresponds to the ideal conformity. If CI is larger than 1, healthy tissues are irradiated. If CI is less than 1, the target volume is only partially irradiated.
For plan efficiency evaluation, the number of monitor units was considered.
Statistical differences among the plans obtained for the three techniques were analysed using the t-test for matched pairs. A statistical significance level of 0·05 was used (p<0·05).
Results
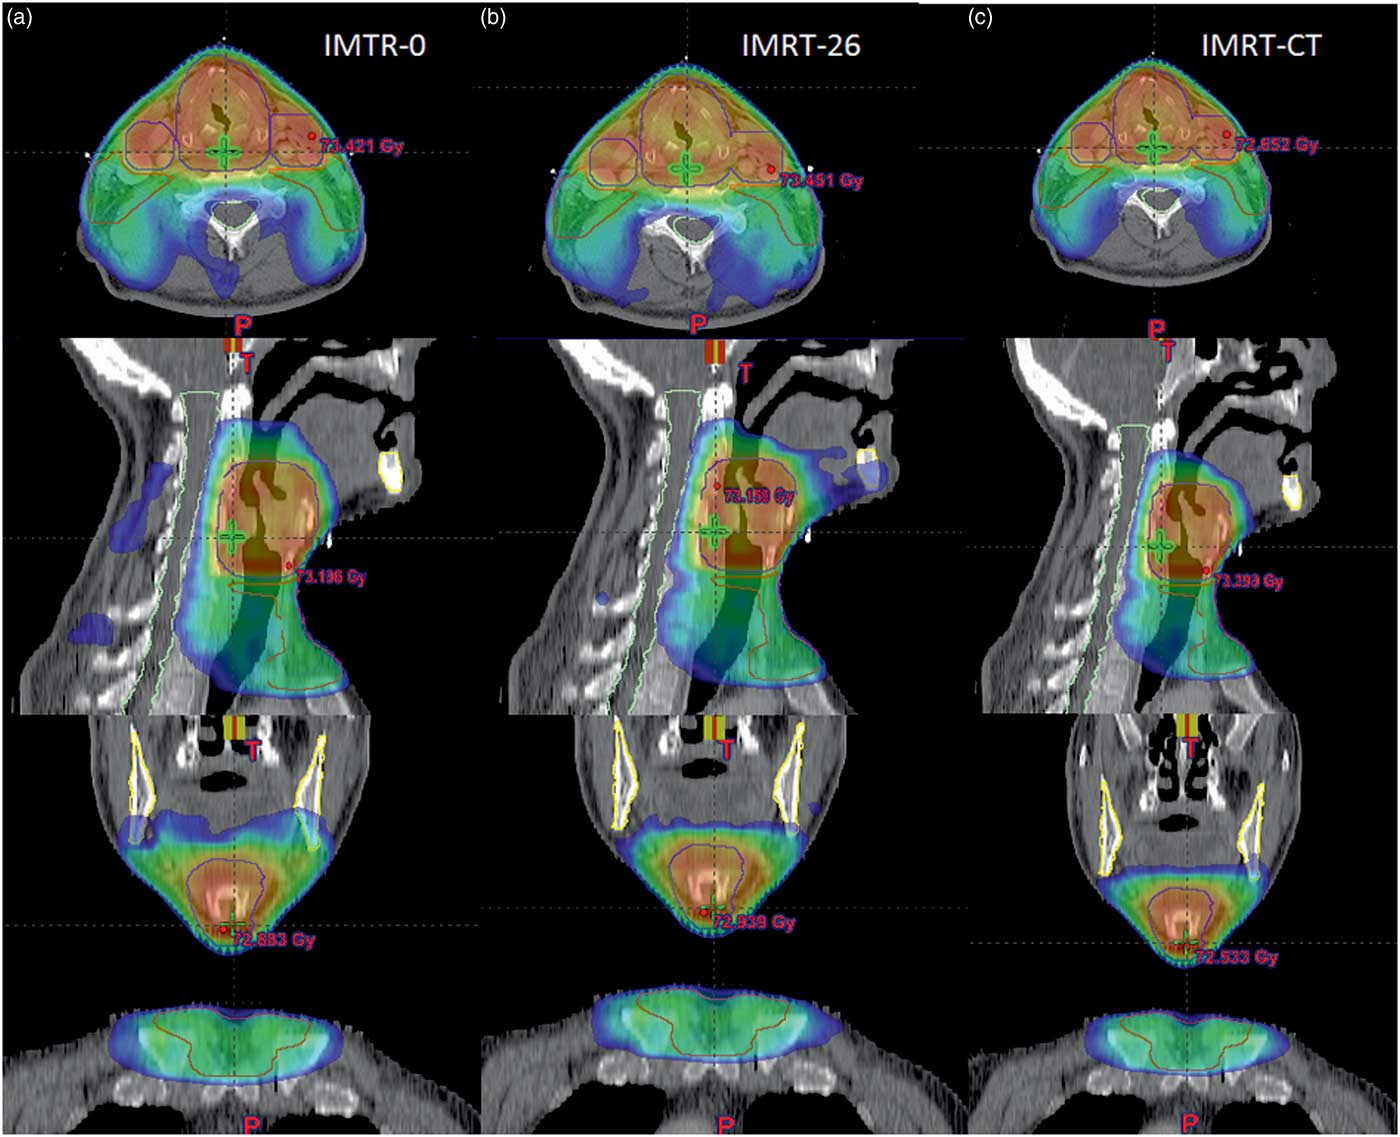
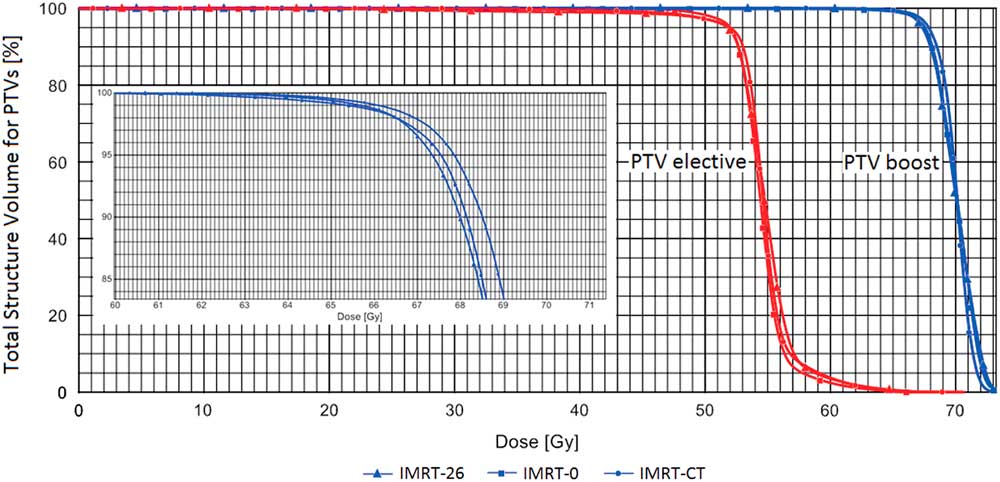
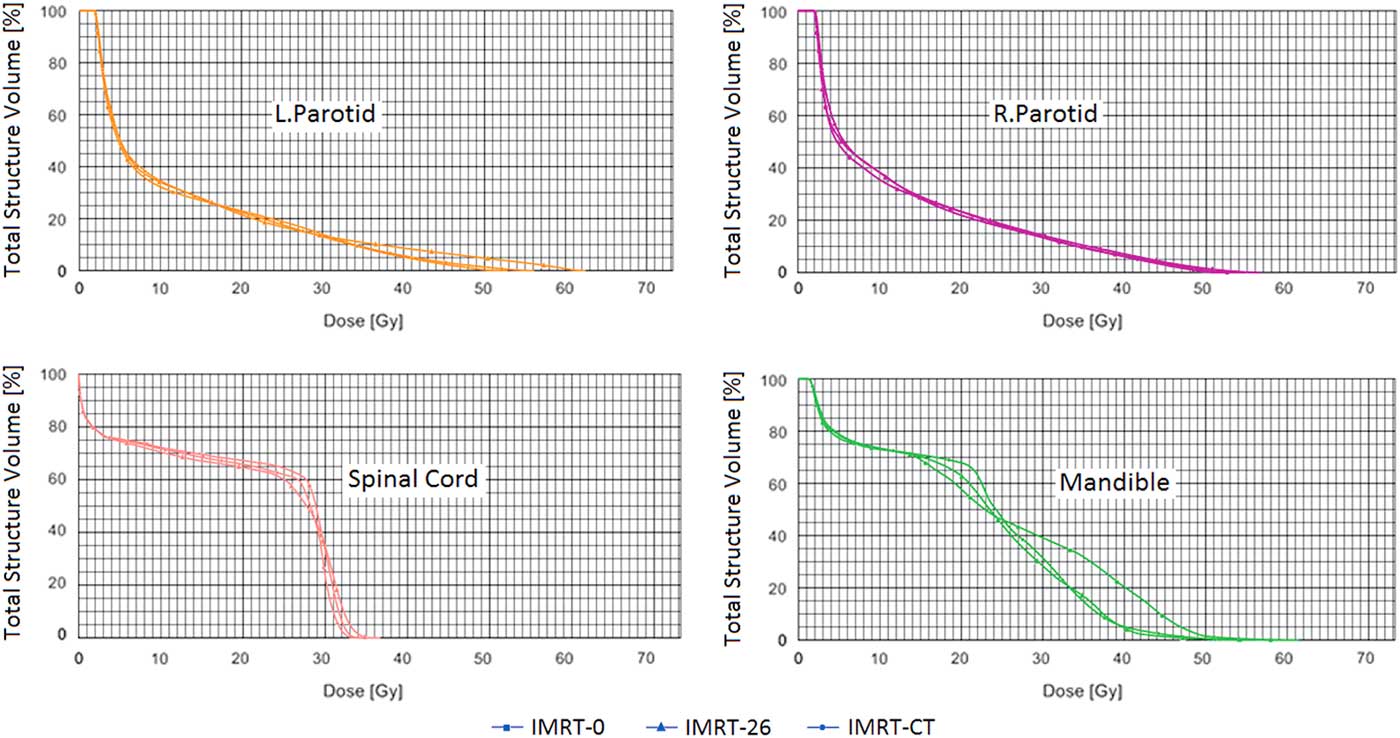
All treatment techniques produced clinically acceptable plans for all the patients. As an example, Figure 3 shows the dose distributions obtained with the three planning techniques, in the three orthogonal planes through the isocenter, for one patient of the sample, while Figures 4 and 5 show the corresponding DVHs for PTVs and OARs, respectively.
Comparison of the dose distributions obtained with the three techniques (a, b, c) in axial, sagittal and coronal planes at the beams isocenter for a patient from the studied sample. Only doses higher than 36 Gy are shown in order to evidence the dose fall-off for each technique.

Comparison of planning target volumes (PTVs) dose–volume histogram’s of the sample patient shown in Figure 3. Abbreviation: IMRT, intensity-modulated radiation therapy.

Comparison of organ at risks dose–volume histogram’s of the sample patient shown in Figure 3. Abbreviation: IMRT, intensity-modulated radiation therapy; L-parotid, left parotid; R-parotid, right parotid.

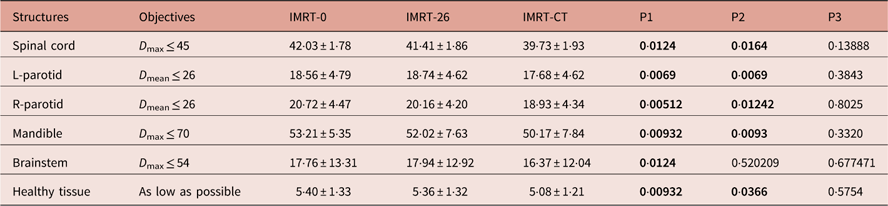
Mean and standard deviation values of the main results obtained in the patient sample from DVH analysis are given in Tables 2 and 3 for PTVs and in Table 5 for OARs and healthy tissue. Each table also shows the results of the t-test performed to assess the statistical significance of the differences observed for each pair of techniques. The results are expressed in terms of p, that is the probability that the differences are random in nature and not due to the techniques.
Dosimetric results for planning target volume-boost in the sample patients

Note: Mean±SD are given for each technique, together with the statistical significance of the observed differences (p-value). Dose values are given in Gy. Bold values of p indicate statistically significant differences.
Abbreviations: IMRT, intensity-modulated radiation therapy; HI, homogeneity Index; CI, Conformity Index; P1, p-value: IMRT-CT versus IMRT-0; P2, p-value: IMRT-CT versus IMRT-26; P3, p-value: IMRT-26 versus IMRT-0.
Dosimetric results for the planning target volume-elective

Note: Mean±SD are given for the sample patients, together with the statistical significance of the observed differences (p-value). Dose values are given in Gy. Bold values of p indicate statistically significant differences.
Abbreviations: IMRT, intensity-modulated radiation therapy; HI, homogeneity Index; CI, Conformity Index; P1, p-value analysis: IMRT-CT versus IMRT-0; P2, p-value analysis: IMRT-CT versus IMRT-26; P3, p-value analysis: IMRT-26 versus IMRT-0.
PTVs dosimetric evaluations
Table 2 shows that on the average D 98% of PTV-boost complies with the objective of being ≥95% of the prescription dose (i.e., 66·46 Gy) for all the techniques. While no significant difference is observed for the first two techniques, a small statistically significant increase is observed for IMRT-CT with respect to IMRT-0 (68·05 versus 67·67 Gy, p=0·0366). Also the average of the near-maximum dose D 2% complies with the objective of being ≤107% of the prescription dose (i.e., 74·86 Gy) for all the techniques, without any significant difference.
The best (lowest) HI for PTV-boost corresponds to IMRT-CT, with HI=0·085±0·019, but results in significantly different only from that of IMRT-26 technique (p=0·03236).
As for CI, the best (lowest) results were achieved in IMRT-26 and IMRT-CT with (1·02±0·13) and (1·03±0·04), respectively; however, only the difference between IMRT-0 and IMRT-CT is statistically significant with p=0·025.
For the PTV-elective, Table 3 shows also that, in this case, all the average values of parameters D 98% and D 2% comply with the planning objectives and that their differences across the techniques have no statistical significance. The HI observed for the IMRT-CT technique (0·095±0·014) is significantly better than for IMRT-0 and IMRT-26. The same trend is found for the CI, which is significantly better than the results of the other two techniques (CI=1·11±0·05).
Thus it can be concluded that, as far as PTVs are concerned, differences among the three techniques are significant only for the homogeneity and conformity of the dose, with the IMRT-CT providing best results.
This trend is evidenced for one sample patient in Figure 3, which clearly shows that IMRT-CT achieves a better dose fall-off outside PTVs than the other two techniques. Figures 4 and 5 provide the DVHs of PTVs and OARs, respectively, comparing the three plans for this patient. Figure 4 shows clearly that both PTVs elective and boost achieved the best dose coverage (D 98%) with IMRT-CT compared with IMRT-0 and IMRT-26, and the lowest maximum dose, which yields a better dose homogeneity in the target volumes. Figure 5 shows that IMRT-CT also provides the best sparing of OARs.
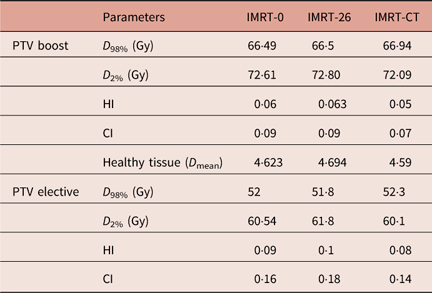
Table 4 gives for the PTVs of the same patient the relevant DVH parameters and quality indexes, HI and CI. It can be seen that PTVs coverage is clinically acceptable and almost the same for all the techniques. A slight improvement in dose homogeneity and conformity is obtained with IMRT-CT, which could explain the least value of the mean dose observed for the ‘healthy tissue’.
Comparison of planning target volume (PTVs) dosimetric results of the sample patient shown in Figure 3

Abbreviations: IMRT, intensity-modulated radiation therapy; HI, homogeneity Index; CI, Conformity Index.
OAR dosimetric evaluations
Spinal cord
All techniques respect the dose constraint for the spinal cord, that is D max<45 Gy as shown in Table 5. By using IMRT-CT, D max is reduced by 5·8% compared with IMRT-0 and 4·2% to IMRT-26 (statistically significant differences, with p-values of 0·0124 and 0·0164, respectively).
Dosimetric results for organ at risks (OARs) and healthy tissue

Note: Mean±SD are given for the sample patients, together with the statistical significance of the observed differences (p-value). Dose values are given in Gy. Bold values of p indicate statistically significant differences.
Abbreviations: IMRT, intensity-modulated radiation therapy; L-parotid, left parotid; R-parotid, right parotid; P1, paired t-test analysis: IMRT-CT versus IMRT-0; P2, paired t-test analysis: IMRT-CT versus IMRT-26; P3, paired t-test analysis: IMRT-26 versus IMRT-0.
Parotids
All plans achieved clinically acceptable results, with respect to the constrained dose value of D mean≤26 Gy.
By using IMRT-CT, D mean is reduced on average by 4·8 and 8·6% in the left and right parotid, respectively, compared with IMRT-0, and by 5·6 and 6·1% when compared with IMRT-26. All these differences are statistically significant (p<0·01).
Mandible
All techniques keep the maximum dose fairly under the constraint of 70 Gy. Also, in this case, IMRT-CT achieved the best results for mandible D max, with statistically significant differences with the other techniques (p<0·01).
Brainstem
In this case, the constraint value of D max<55 Gy is easily respected for all the techniques because of the fair distance of the brainstem from the PTVs. Thus the mean D max results as low as 16·37, 17·76 and 17·94 Gy for IMRT-CT, IMRT-0 and IMRT-26, respectively. Difference between IMRT-CT and IMRT-0 is statistically significant (p=0·0124).
Healthy tissue
Table 5 shows that IMRT-CT achieves the lowest value of the mean dose to the tissues outside the PTVs, with differences statistically significant (p=0·009 and 0·037 when compared with IMRT-0 and IMRT-26, respectively).
Discussion
The present work investigated three IMRT techniques (IMRT-CT, IMRT-0 and IMRT-26), differing for beam configuration, with the objective of improving plan quality for the treatment of advanced laryngeal cancer.
All techniques obtained an excellent PTV coverage (as expressed by the near-minimum dose D 98%) with clinically insignificant differences among them. However, the best plan quality, in terms of dose homogeneity and conformity, was achieved with the technique IMRT-CT, that combines the other two techniques by delivering them sequentially in two treatment phases. This, in turn, translated into the best sparing of OARs and the healthy tissue.
The suggested technique takes advantage of using 14 entrance beams in total, increasing the number of freedom degrees in optimisation, while delivering only seven per fraction in order to reduce the delivery time. Beam configuration can be changed after the first half of the treatment, or on alternate days, as it is more comfortable. In this way, the resulting treatment will achieve both good plan quality and OAR sparing.
Comparison with the results obtained by other authors is difficult due to different dose prescription or different metrics used to report the results. As an example, Dobler et al.Reference Dobler, Obermeier, Hautmann, Khemissi and Koelbl 13 used V 95% (i.e., the volume enclosed by the 95% isodose) to express the PTV coverage, while we constrained D 98% to be larger than 95%. As they obtained V 95%=93·7±1·2% for the SIB PTV in the IMRT treatment, our IMRT-CT result of D 98%=68·05±0·92 Gy (i.e., 97·3±1·4% of the prescription dose) indicates a better coverage of the volume. On the contrary, no comparison is allowed for the HI and CI due to the different definitions.
Also for OARs such as spinal cord and brainstem, the comparison is not direct as they expressed D max=D 1ccm while we considered the maximum point dose. Anyway, we can reasonably assume that maximum point dose can be larger than D 1ccm. In this way, our IMRT-CT D max=39·73±1·93 Gy obtained for the spinal cord and D max=16·37±12·04 Gy obtained for the brainstem should be consistent with their corresponding values D 1ccm=31·7±2·1 Gy and D 1ccm=34·6±4·7 Gy.
As for the parotids, in our study, the mean dose was considered, while in Dobler et al.Reference Dobler, Obermeier, Hautmann, Khemissi and Koelbl 13 D 50%, that is, the median dose. After looking at a typical parotid DVH obtained in our study, as shown in Figure 5, we can infer that D 50% should be less than D mean. Thus, our IMRT-CT results of D mean=17·68±4·62 Gy for the left parotid and D mean=18·93±4·34 Gy for the right parotid seem better than the corresponding D 50%=29·0±4·8 Gy and D 50%=30·5±4·8 Gy.
Limitations of our study include no specification of the anatomical subsite of the tumours (supraglottis, glottis or subglottis), which can possibly affect the extension of PTVs.Reference Merlotti, Alterio and Vigna-Taglianti 12 In addition, OARs such as oral mucosa, thyroid gland, carotid arteries, submandibular glands and constrictor muscles were not contoured for dose evaluation, though most of them are usually not constrained in planning.Reference Merlotti, Alterio and Vigna-Taglianti 12
Conclusion
The IMRT-CT technique, combining two different seven-beam setups, delivered in two treatment phases, improves dose distribution for the treatment of larynx cancer, with respect to plan quality (dose homogeneity and conformity in PTVs) and to the reduction of dose in OARs and peripheral tissues. This latter result could be of clinical interest as it could potentially reduce the toxicity associated with this HN treatment and improve quality of life especially for patients with a good prognosis.
Financial Support
This research received no specific grant from any funding agency, commercial or not-for-profit sectors.