


Introduction
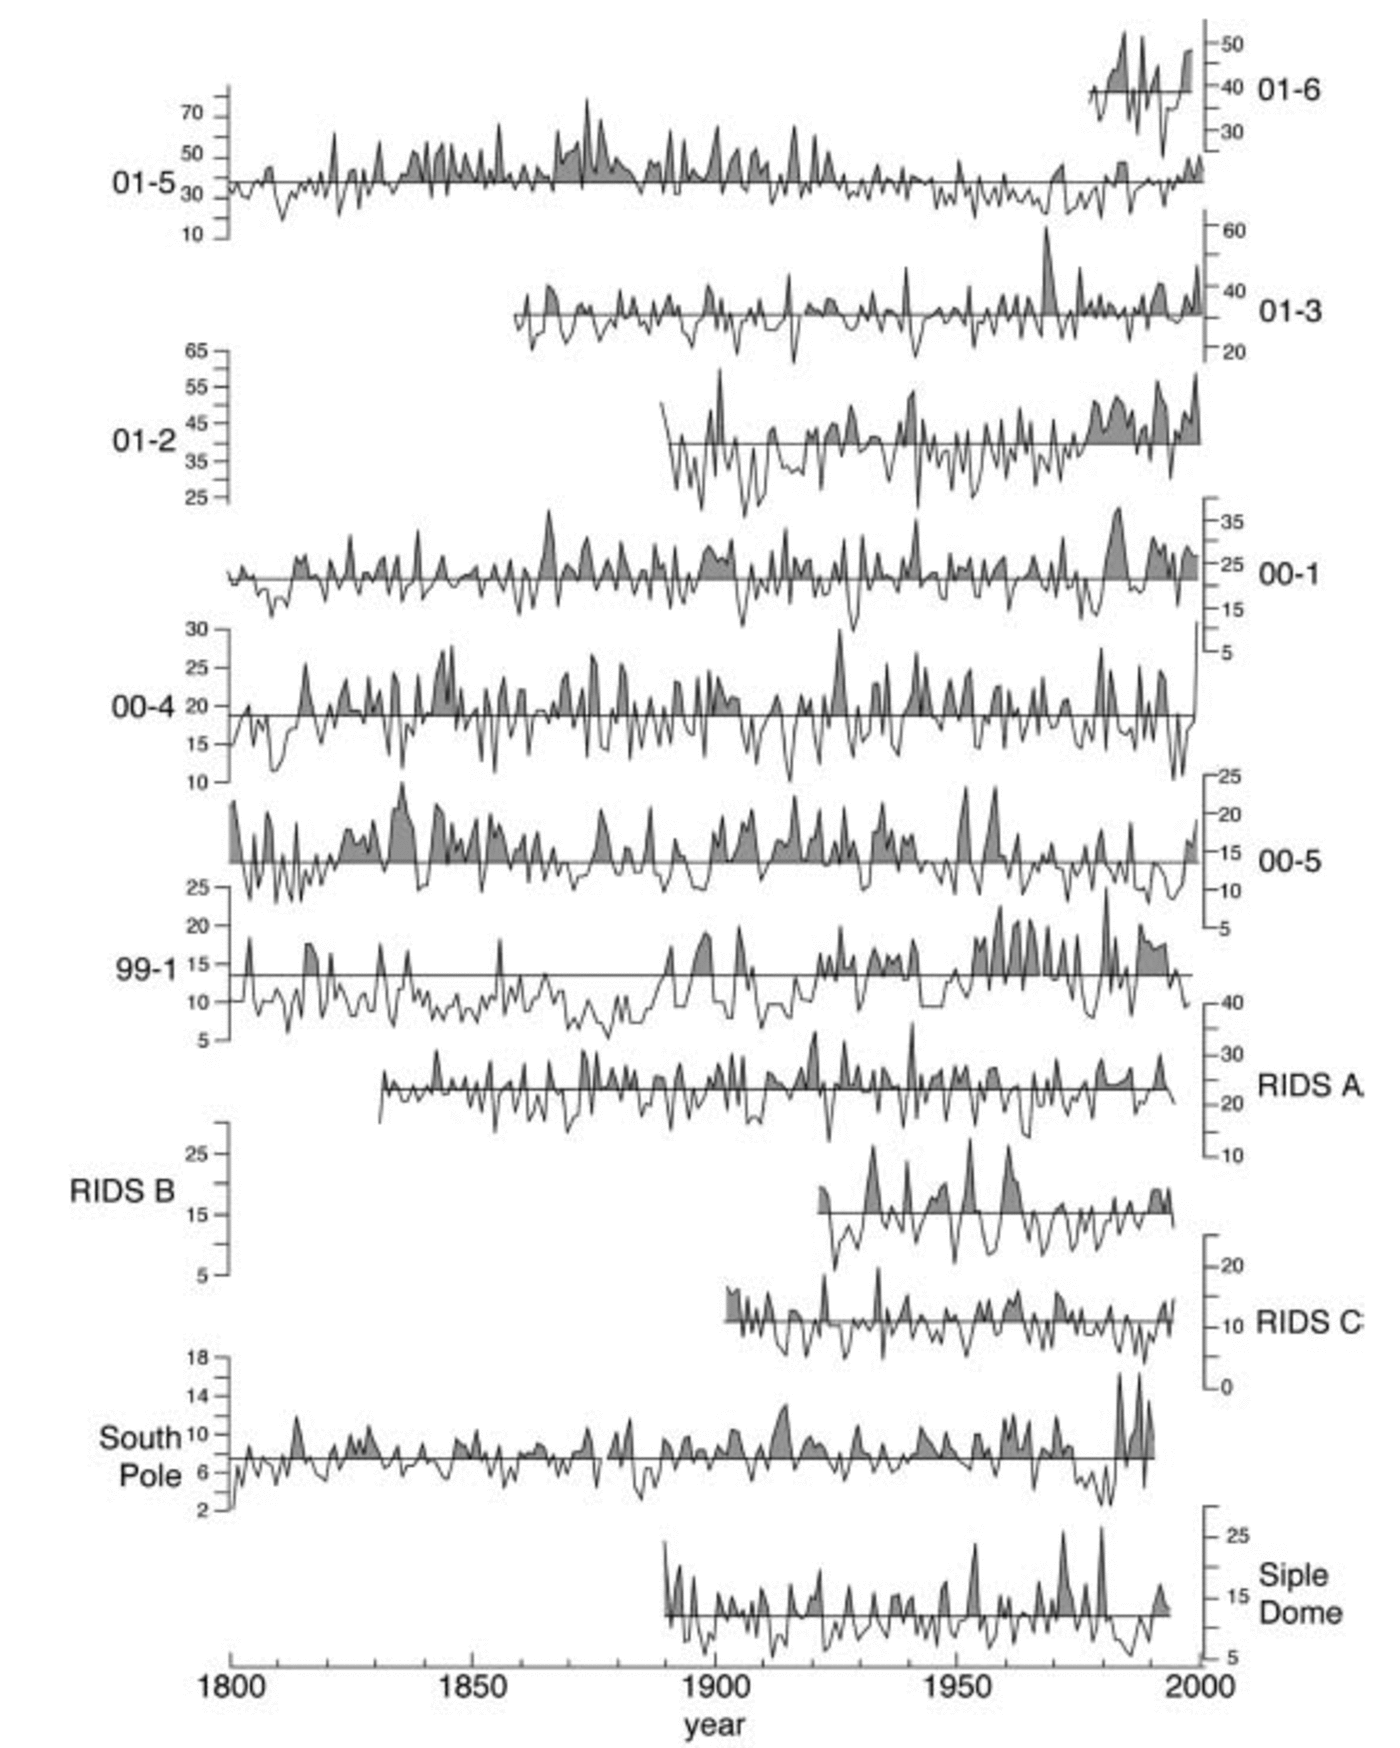
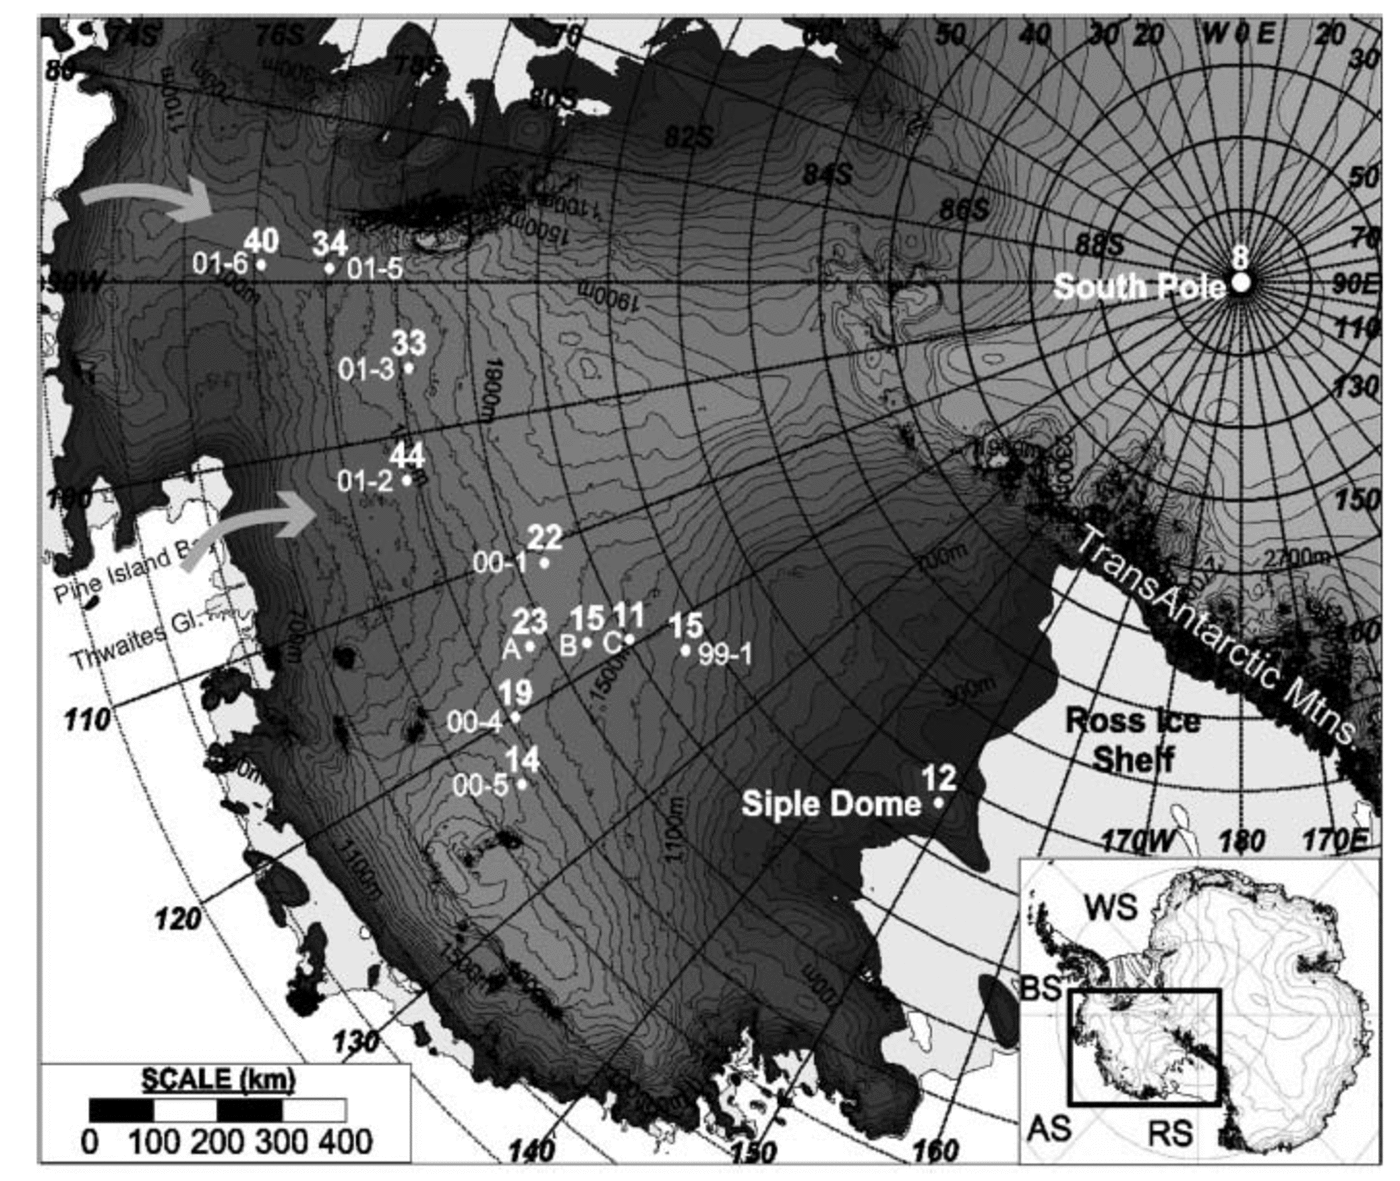
Annual layers from Antarctic firn and ice cores provide detailed accumulation-rate records that can be used to examine climate variability through time, and changes in the mass balance of the ice sheet that contribute to fluctuations in global sea level (Zwally and others, 1989; Reference Vaughan, Bamber, Giovinetto, Russell and CooperVaughan and others, 1999). The mean accumulation rate at a location is partially related to the topography of the ice sheet and the distance from contributing moisture sources, while temporal variability in these records reflects changes in atmospheric moisture transport, cyclonic position and intensity, seasonality of precipitation, and temperature. Until recently, the sparse distribution of ice cores available from West Antarctica made it difficult to characterize accumulation-rate variability over the entire region and through time. Here 13 high-resolution accumulation-rate records are presented to examine spatial and temporal variability in accumulation over the Pine Island–Thwaites drainage system and Ross drainage system in West Antarctica and at South Pole over the last ∼200 years (Fig. 1 and 2). Analysis includes examination of topographic controls, accumulation-rate trends, correlations of the accumulation-rate records with the Southern Oscillation Index (SOI) and Southern Hemisphere sea-level pressure (SLP), and the dominant periodicities present in the records.
The 13 annual accumulation-rate records in w.e. (cm a–1), 1800–2001. The line through each record denotes the mean for the full record, and the shading indicates accumulation above the mean.
Ice-core locations and mean accumulation rates, 1922–91. Core site locations: 01-06, 01-5, 01-3 and 01-2 in the Pine Island– Thwaites drainage system; 00-1, RIDS A, 00-4 and 00-5 near the ice divide; and RIDS B, RIDS C, 99-1 and Siple Dome in the Ross drainage system. The arrows indicate dominant moisture pathways. WS, Weddell Sea; BS, Bellingshausen Sea; AS, Amundsen Sea; RS, Ross Sea; A, RIDS A; B, RIDS B; C, RIDS C. A digital elevation model was used to produce the shaded relief map (Reference Liu, Jezek, Li and ZhaoLiu and others, 2001).
Precipitation is the dominant component of the accumulation signal (Reference BromwichBromwich, 1988), but the amount of snow sublimated, eroded or drifted can contribute to interannual accumulation variability. The moisture-holding capacity of air increases rapidly and non-linearly with increasing temperatures, so warmer temperatures should correspond to increased precipitation. This is true for spatial distributions of precipitation (Reference King and TurnerKing and Turner, 1997), but previous studies show that the majority of accumulation occurs in the non-summer months (Reference BromwichBromwich, 1988) and that cyclonic systems control accumulation more than air temperature (Reference King and TurnerKing and Turner, 1997).
Changes in cyclonic frequency, relative path (Reference EnomotoEnomoto, 1991), timing and strength (Reference King and TurnerKing and Turner, 1997) contribute to accumulation-rate variability. The intensification of cyclonic activity, particularly for coastal regions, is considered one of the primary causes of accumulation-rate increase (Reference Morgan, Goodwin, Etheridge and WookeyMorgan and others, 1991). Annual precipitation can be dominated by a few cyclonic events. For example, one study indicates that a single 3 day cyclone at Byrd Station (near RIDS C) was the source of ∼20% of the annual total accumulation (Reference LettauLettau, 1969). Cyclonic patterns of this sort can occur numerous times in one season, or not at all in a year, and are potentially a large to minimal contributor to variability in the accumulation-rate record. Shifts in the mean latitude of the circumpolar trough can also contribute to interannual accumulation-rate variability (Reference Turner, Colwell and HarangozoTurner and others, 1997).
Accumulation-Rate Records
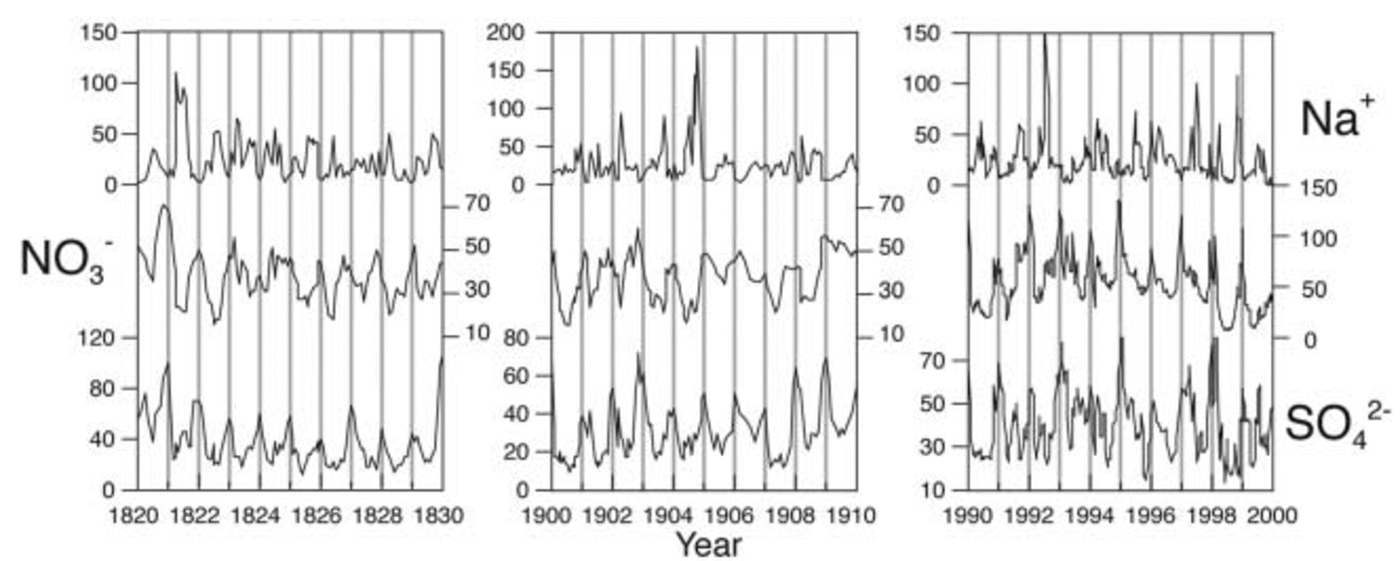
Eight of the ice cores (99-1, 00-1, 00-4, 00-5, 01-2, 01-3, 015 and 01-6) were collected during the 1999–2003 phase of the United States portion of the International Trans-Antarctic Scientific Expedition (ITASE), and the remaining ice cores were collected as part of earlier ITASE activities (RIDS A, RIDS B, RIDS C (Reference Kreutz and MayewskiKreutz and Mayewski, 1999; Reference KreutzKreutz and others, 1999, Reference Kreutz, Mayewski, Meeker, Twickler and Whitlow2000), South Pole (Reference Meyerson, Mayewski, Kreutz, Meeker, Whitlow and TwicklerMeyerson and others, 2002) and Siple Dome (Reference KreutzKreutz and others, 1999)). Cores from sites 01-6, 01-5, 01-3 and 01-2 are located in the Pine Island– Thwaites drainage system; RIDS B, RIDS C, 99-1 and Siple Dome are located in the Ross drainage system; 00-1, RIDS A, 00-4 and 00-5 are located near the ice divide between the two drainage systems; and one core is from the South Pole (Fig. 1; Table 1). The high-resolution (∼2–3cm sample–1; ∼15–50 samples a–1 at high accumulation sites, ∼6–12 samples a–1 at South Pole) cores were sub-annually dated using seasonal maxima from chemical species (Na+, K+, Mg2+, Ca2+, Cl–, NO3 –, SO4 2–, Cl/Na) (Reference Whitlow, Mayewski and DibbWhitlow and others, 1992) determined using ion chromatography (Reference Buck, Mayewski, Spencer, Whitlow, Twickler and BarrettBuck and others, 1992). A clear seasonal signal is formed from peaks in sea salt (Na+) in the winter–spring, and SO4 2– and NO3 – in the summer (Fig. 3). The dating of the records is calibrated to known volcanic horizons, and the dating accuracy for annual layers between the volcanic horizons is ≤1 year. Ice-core densities (1m resolution) were calculated from field measurements of the core diameter, length and mass, and annual thickness layers were calculated from the chemical dating of the ice cores. Annual accumulation rates (cm a–1) in water equivalent (w.e.) (Fig. 1) were calculated by multiplying annual thickness layers by density.
Annual chemistry layers (μgL–1) from the 00-1 ice core used for dating. Detailed 10 year sections (1820–30, 1900–10, 1990–2000) display winter–spring (Na+) and summer (NO3 –, SO4 2–) maxima. Clear seasonal signals are present in all records.
Site information and mean accumulation
Topographic Control
Ice-sheet topography influences the accumulation of snow on large (continental), medium (undulations) and small (sastrugi) scales:
Large scale
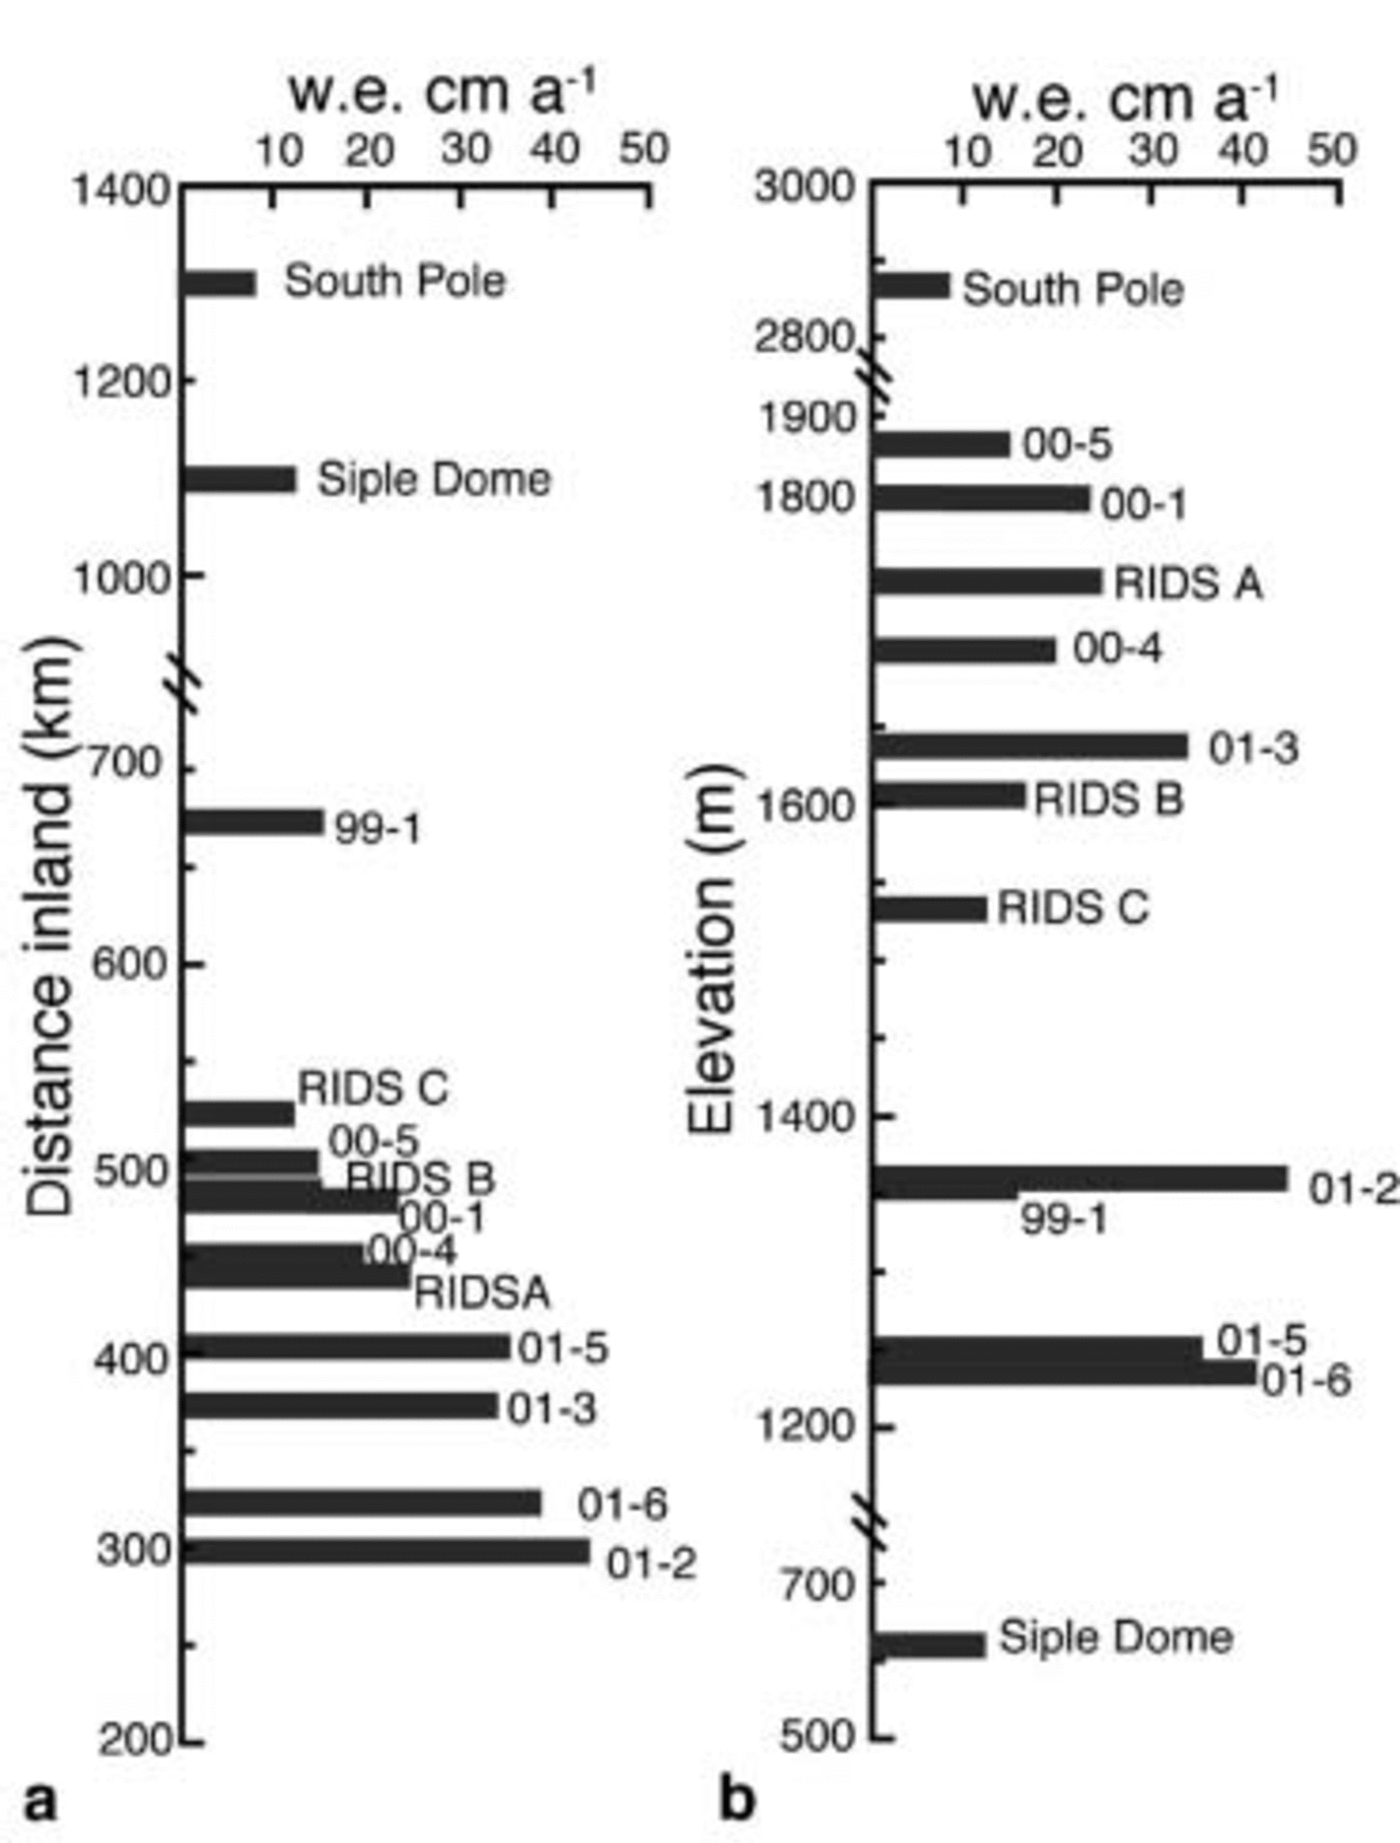
Distance inland from the predominant moisture source and elevation in part determines the mean accumulation rate at a location. A comparison of mean annual accumulation rates (1922–91, the period of overlap for all records except for 01-6) from core sites (Fig. 1) shows that those closest to the coast have the highest accumulation, while those farther from the coast receive less precipitation (Fig. 4a). Additionally, low-elevation sites generally have higher accumulation rates than high-elevation sites (Fig. 4b). RIDS B, RIDS C, 99-1 and Siple Dome are exceptions to this trend because they are located on the leeward side of the ice divide relative to the dominant moisture sources for this region (Amundsen and Bellingshausen Seas) (Fig. 2). The ice divide between the Pine Island–Thwaites and Ross drainage systems partially blocks moisture transport further inland, causing lower accumulation rates in the Ross drainage system (Fig. 2).
Accumulation rates vs (a) distance inland (km), and (b) elevation (m).
Medium scale
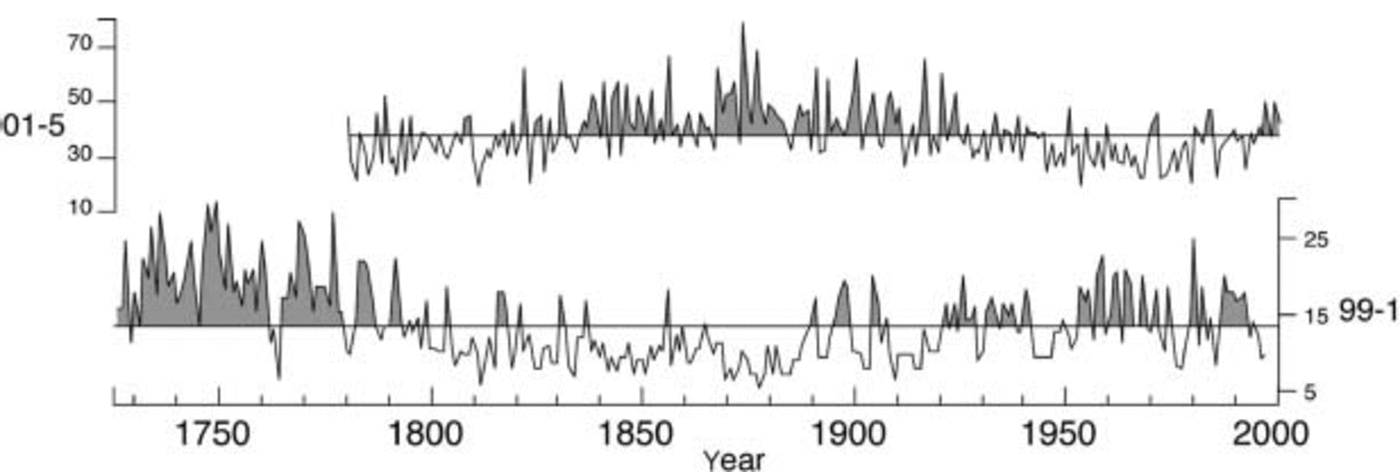
Medium-scale undulations (wavelengths <20 km) in surface topography can cause variations in accumulation rates. Accumulation in troughs can be 30–50% more than at exposed surface crests (Reference GowGow and Rowland, 1965). These topographic features, if located up-glacier of an ice-core site, generate decadal to centennial long periods of accumulation consistently above or below the long-term mean (Fig. 5) because layers deeper in the record will have been deposited at these topographic troughs and crests. The wind direction at a site will also affect how snow is deposited across troughs and crests.
Accumulation-rate records in cm a–1w.e. for the full record for sites 01-5 and 99-1. The line through the record denotes the mean accumulation, and the shaded portions of the record are above mean accumulation. The trends may be due to topographical effects.
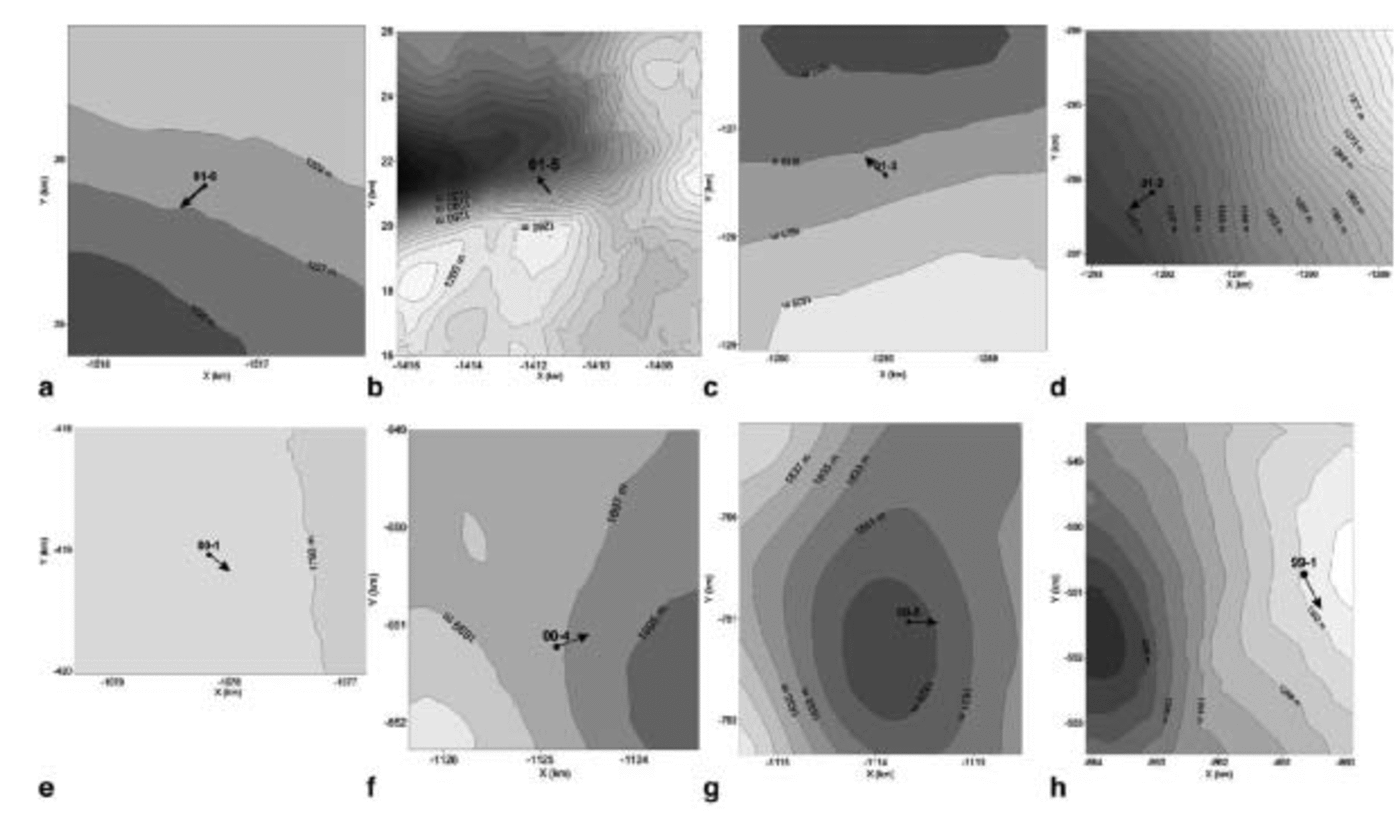
The influence of surface topography on the accumulation-rate records is investigated using maps of up-glacier topography and ice-flow vectors derived from global positioning system (GPS) surveys. Figure 6 shows polar stereographic projections of the surface topography at the eight ITASE sites (01-6, 01-5, 01-3, 01-2, 00-1, 00-4, 00-5 and 99-1). There are only subtle hints of medium-scale undulations up-glacier at sites 01-6, 01-3, 01-2, 00-1, 00-4 and 00-5 (Fig. 6) that could cause variations in the accumulation-rate records, so the variations in accumulation at these sites are interpreted as being largely a function of climate. Previous work also indicates that up-glacier topography does not convolute the Siple Dome (Reference HamiltonHamilton 2002), South Pole (Reference HamiltonHamilton 2004) or RIDS C (Reference Hamilton, Whillans and MorganHamilton and others, 1998) records on the ∼200 year time-scale. Topographic maps of the area surrounding RIDS A and RIDS B are not available at the scale necessary to determine if undulations exist up-glacier from these core sites. However, ice velocities are slow at RIDS A (∼1.5ma–1) and RIDS B (∼5.0ma–1) (Hamilton, unpublished information), and inspection of the accumulation records does not show trends that would suggest topographical influences.
Polar stereographic projections of the surface topography at sites (a) 01-6, (b) 01-5, (c) 01-3, (d) 01-2, (e) 00-1, (f) 00-4, (g) 00-5, (h) 99-1. Contour labels are in m at 2 m intervals. Arrows indicate ice flow vectors. Note: the area covered by the projections differs between sites.
Prolonged periods of accumulation above the mean (1724–1800 at 99-1 and 1835–1925 at 01-5) and below the mean (1800–90 at 99-1 and 1925–2001 at 01-5) may be caused by long-term climatic variations or the presence of surface undulations up-glacier of 99-1 and 01-5 (Fig. 5). The ice velocity at 01-5 is 24.3 ma–1, so ice from 200 years ago originated from ∼4860m up-glacier. The origin of deeper layers in the core has been estimated according to the ice-flow vector. The surface topography surrounding 01-5 is likely complicated enough to cause spatial variability in accumulation, but the accumulation variations identified in the core do not precisely correlate with the medium-scale undulations that exist up-glacier of the core site. However, accumulation around crests and ridges is mostly controlled by wind redistribution in line with prevailing wind directions (Reference WhillansWhillans, 1975). Thus, to make topographic corrections on an ice-core record requires information about the surface slopes that are parallel with ice-flow vectors and the dominant wind directions. This level of deconvolution is beyond the scope of this study, but the above analysis does suggest that topography, rather than climate, may cause the long-term accumulation trends in the 01-5 record. The topographic map at 99-1 does not extend far enough up-glacier to confirm if complicated topography is the cause for the trends in the 99-1 accumulation-rate record (flow at 99-1 is ∼20ma–1). However, 99-1 is located on the margin of the onset region for Bindschadler Ice Stream (former Ice Stream D) and it is feasible that complicated flow could be affecting the accumulation-rate record. Comparison of the accumulation records from 99-1 and 01-5 (Fig. 5) shows what appears to be an inverse relationship. If the topography surrounding the core sites were not considered, these two records could be misinterpreted as indicating an inverse relationship in accumulation between the Pine Island– Thwaites and Ross drainage systems. The spatial distribution of the 13 accumulation records presented in this study further clarifies that no such inverse relationship exists.
Small scale
Wind redistribution of snow forms small-scale topographic features called sastrugi (Reference Venteris and WhillansVenteris and Whillans, 1998). Sastrugi roughness could contribute to annual accumulation-rate variability at the top of an ice core depending upon whether the core is drilled at the trough or crest of a sastrugi. However, a study at the South Pole indicates that sastrugi are leveled by a summer sublimation–deflation process that eliminates most of the irregularities in horizontal layering below the surface (Reference GowGow, 1965). Stratigraphic analysis of the ITASE ice cores also indicates that the stratigraphic layering is horizontal (personal communication from A. J. Reference Gow and RowlandGow, 2003). Thus, with the possible exception of the top surface of an ice-core record, the contribution from sastrugi to the interannual accumulation-rate variability should be minimal.
Accumulation-Rate Trends
Studies of accumulation-rate trends over the last ∼30 years have provided varying results. Records from near Dome C on the East Antarctic plateau (Reference Petit, Jouzel, Pourchet and MerlivatPetit and others, 1982), Wilkes Land (Reference Morgan, Goodwin, Etheridge and WookeyMorgan and others, 1991), inland Dronning Maud Land (Reference Isaksson, Karlén, Gundestrup, Mayewski, Whitlow and TwicklerIsaksson and others, 1996), the Antarctic Peninsula region (Reference Peel, Bradley and JonesPeel, 1992) and South Pole (Reference Mosley-Thompson, Paskievitch, Gow and ThompsonMosley-Thompson and others, 1999) indicate a recent increase in accumulation. No long-term accumulation trends were evident in the Dyer Plateau core (Reference ThompsonThompson and others, 1994; Reference Raymond, Weertman, Thompson, Mosley-Thompson, Peel and MulvaneyRaymond and others, 1996) or the Siple Station core (Reference Mosley-Thompson, Bradley and JonesMosley-Thompson, 1992) in the Antarctic Peninsula region, while a record from coastal Dronning Maud Land (Reference Isaksson, Karlén, Gundestrup, Mayewski, Whitlow and TwicklerIsaksson and others, 1996) indicates an accumulation-rate decrease. The high-resolution spatially distributed records presented in this study help to resolve the spatial and temporal accumulation-rate variations that are pertinent to understanding West Antarctic climate variability and ice-sheet mass balance.
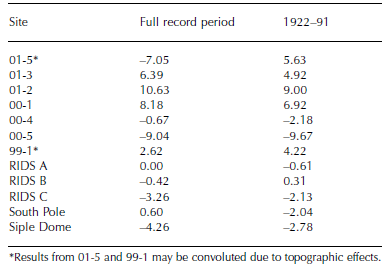
The ice cores from this study were analyzed to look for recent changes in accumulation rates. The period 1970– present was chosen due to numerous previous studies reporting changes in accumulation during this same time period. Mean accumulation since 1970 for each site was compared to the long-term mean and, due to the different time period covered by each record, the mean from 1922 to 1991 (the period of overlap between records) (Table 2). Results for cores 01-5 and 99-1 are disregarded because of the possible need for topographic corrections (see previous section). The results indicate a slight decrease (∼1–4%) in accumulation at sites 00-4, RIDS C and Siple Dome, and a larger decrease (∼9%) at site 00-5. Accumulation increased (∼5–10%) at sites 01-3, 01-2 and 00-1. The geographical clustering of these sites suggests that there has been an increase in accumulation since 1970 in the western sector of the Pine Island–Thwaites drainage system (00-1, 01-2, 01-3) (Fig. 2; Table 2).
Change in accumulation (%). 1970–present mean accumulation compared to full record period mean and 1922–91 mean
Southern Oscillation Index
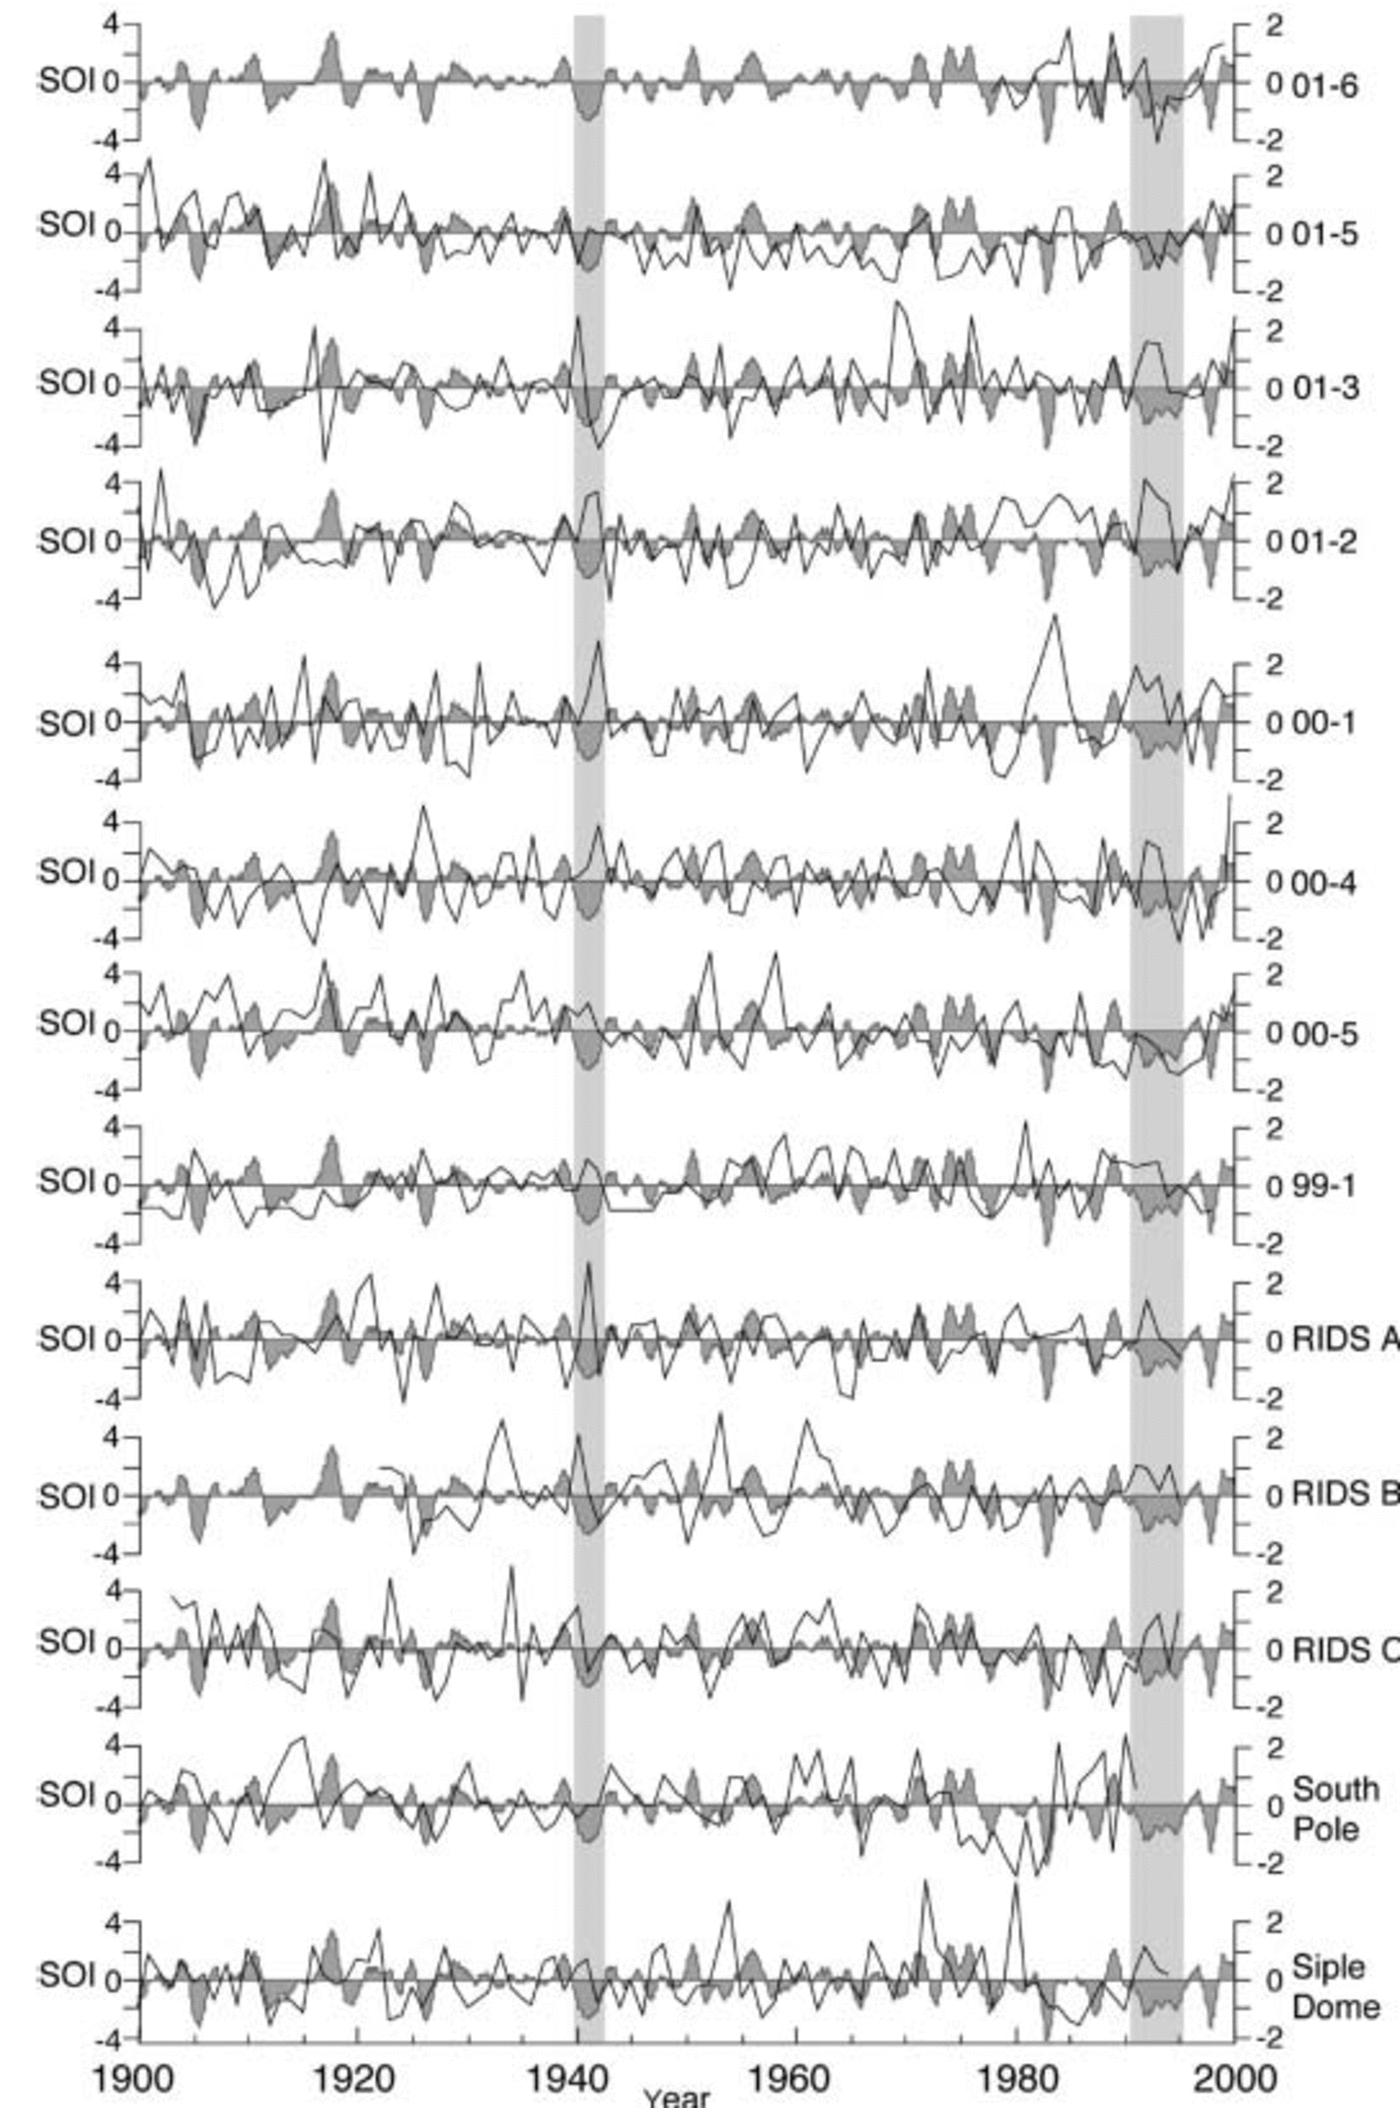
The El Niñño–Southern Oscillation (ENSO) is the most widely recognized source of global climatic variations (Reference Diaz, Markgraf, Diaz and MarkgrafDiaz and Markgraf, 1992). ENSO is centered in the tropical and subtropical latitudes of the South Pacific Ocean, but has global teleconnections (Reference Trenberth, Glantz, Katz and NichollsTrenberth, 1991). Studies using operational numerical analyses (Reference Cullather, Bromwich and van WoertCullather and others, 1996; Reference Bromwich, Rogers, KÃ¥llberg, Cullather, White and KreutzBromwich and others, 2000) found high interannual net precipitation variability for Antarctica, and that net precipitation is correlated with ENSO from 1980 to 1990, and anticorrelated after 1990 in their study region (75–90˚ S, 120–180˚ W) inWest Antarctica. Figure 7 shows normalized accumulation records (anomaly from the mean divided by the standard deviation) and the SOI (defined as the standard Tahiti minus Darwin sea-level pressure anomaly) obtained from the US National Center for Atmospheric Research (NCAR) smoothed with a 12-point running mean. A linear correlation of the accumulation records with the SOI for 1980–90 and 1990–present does not result in consistent significant relationships (Fig. 7).
The normalized (anomaly from the mean divided by the standard deviation) accumulation-rate records (black line) and the SOI (shaded grey) smoothed with a 12-point running mean, from 1900 to 2000. The highlighted periods 1940–42 and 1991–95 indicate above-mean accumulation during the two most sustained periods of negative SOI during the 100 year record.
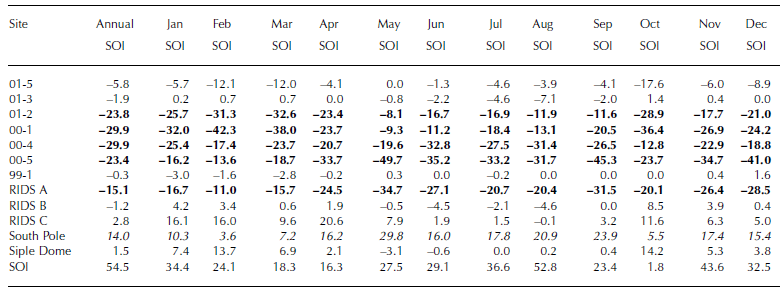
Empirical orthogonal function (EOF) decomposition analysis is applied to the 12 annual accumulation-rate (01-6 is omitted because of the short record span) and annual and monthly SOI records to statistically identify the associated variances in the Antarctic–ENSO–accumulationrate system from 1922 to 1991. Table 3 shows the first EOF for annual accumulation rate at all sites (except 01-6) and the annual and monthly SOI. The variance explained by the first EOF consistently represents ∼15% of the total variability in the 13-dimensional system, and reveals geographic clustering verifying the associated relationships inferred by the EOF analysis. A consistent year-round inverse relationship exists between the SOI and annual accumulation in the region near the ice divide (00-1, 00-4, 00-5 and RIDS A) and western part of the Pine Island–Thwaites drainage system (01-2). In this region, negative periods of the SOI (El Niño) are associated with periods of increased accumulation, and positive periods of the SOI (La Niña) with periods of decreased accumulation. A positive association exists between South Pole and the SOI, indicating that accumulation increases during La Niñña periods and decreases during El Niñño periods; however, the SOI–South Pole relationship is not strongly correlated. The different SOI–accumulation associations that exist between the area near the ice divide and South Pole suggest the presence of a climate boundary between these two regions. Additionally, EOF analysis was run with the SOI leading the accumulation-rate records by 1 year to explore potential lags between ENSO and accumulation, but no significant statistical or spatial relationship was found.
The first EOF from analyses of the annual and monthly SOI and the annual accumulation-rate records from each site – variance associated with decomposition (%). Values in bold are inversely associated with SOI; values in italic are associated with SOI
The propagation of ENSO to Antarctica varies in strength and spatial extent through time, so the regional response to ENSO is not stable from event to event (Reference Elliot and AngellElliot and Angell, 1988), and the timing can vary with respect to the seasons. In addition, correlations of SOI to pressure and temperature show leads and lags depending on location (Reference S.R. and StearnsSmith and Stearns, 1993). A comparison of the accumulation-rate records to the SOI shows that some El Niño events have a consistent association with accumulation (Fig. 7). The 1940– 42 El Niñño event corresponds to periods of above-mean accumulation for all sites except for South Pole and 01-5, and above 1σ accumulation for sites 01-3, 01-2, 00-1, 00-4, RIDS A, RIDS B and RIDS C. The 1991–95 El Niñño also corresponds to periods of above-mean accumulation for all sites except for 01-6, 01-5 and 00-5 (data are unavailable for South Pole), and periods of above 1σ accumulation for sites 01-3, 01-2, 00-1, 00-4, RIDS A, RIDS C and Siple Dome. The 1940–42 and 1991–95 El Niñño events are two of the most sustained periods of negative SOI in the 100 year record and are the most negative of the SOI events that span longer than 2 years. Notably, a comparably long, but weaker, El Niñño event covering the period 1911–14 does not correspond to an increase in accumulation across the study region. This suggests that the ENSO teleconnection with West Antarctic precipitation is most widespread during prolonged periods of strongly negative SOI, but the relationship in general is highly variable.
Sea-Level Pressure Correlations
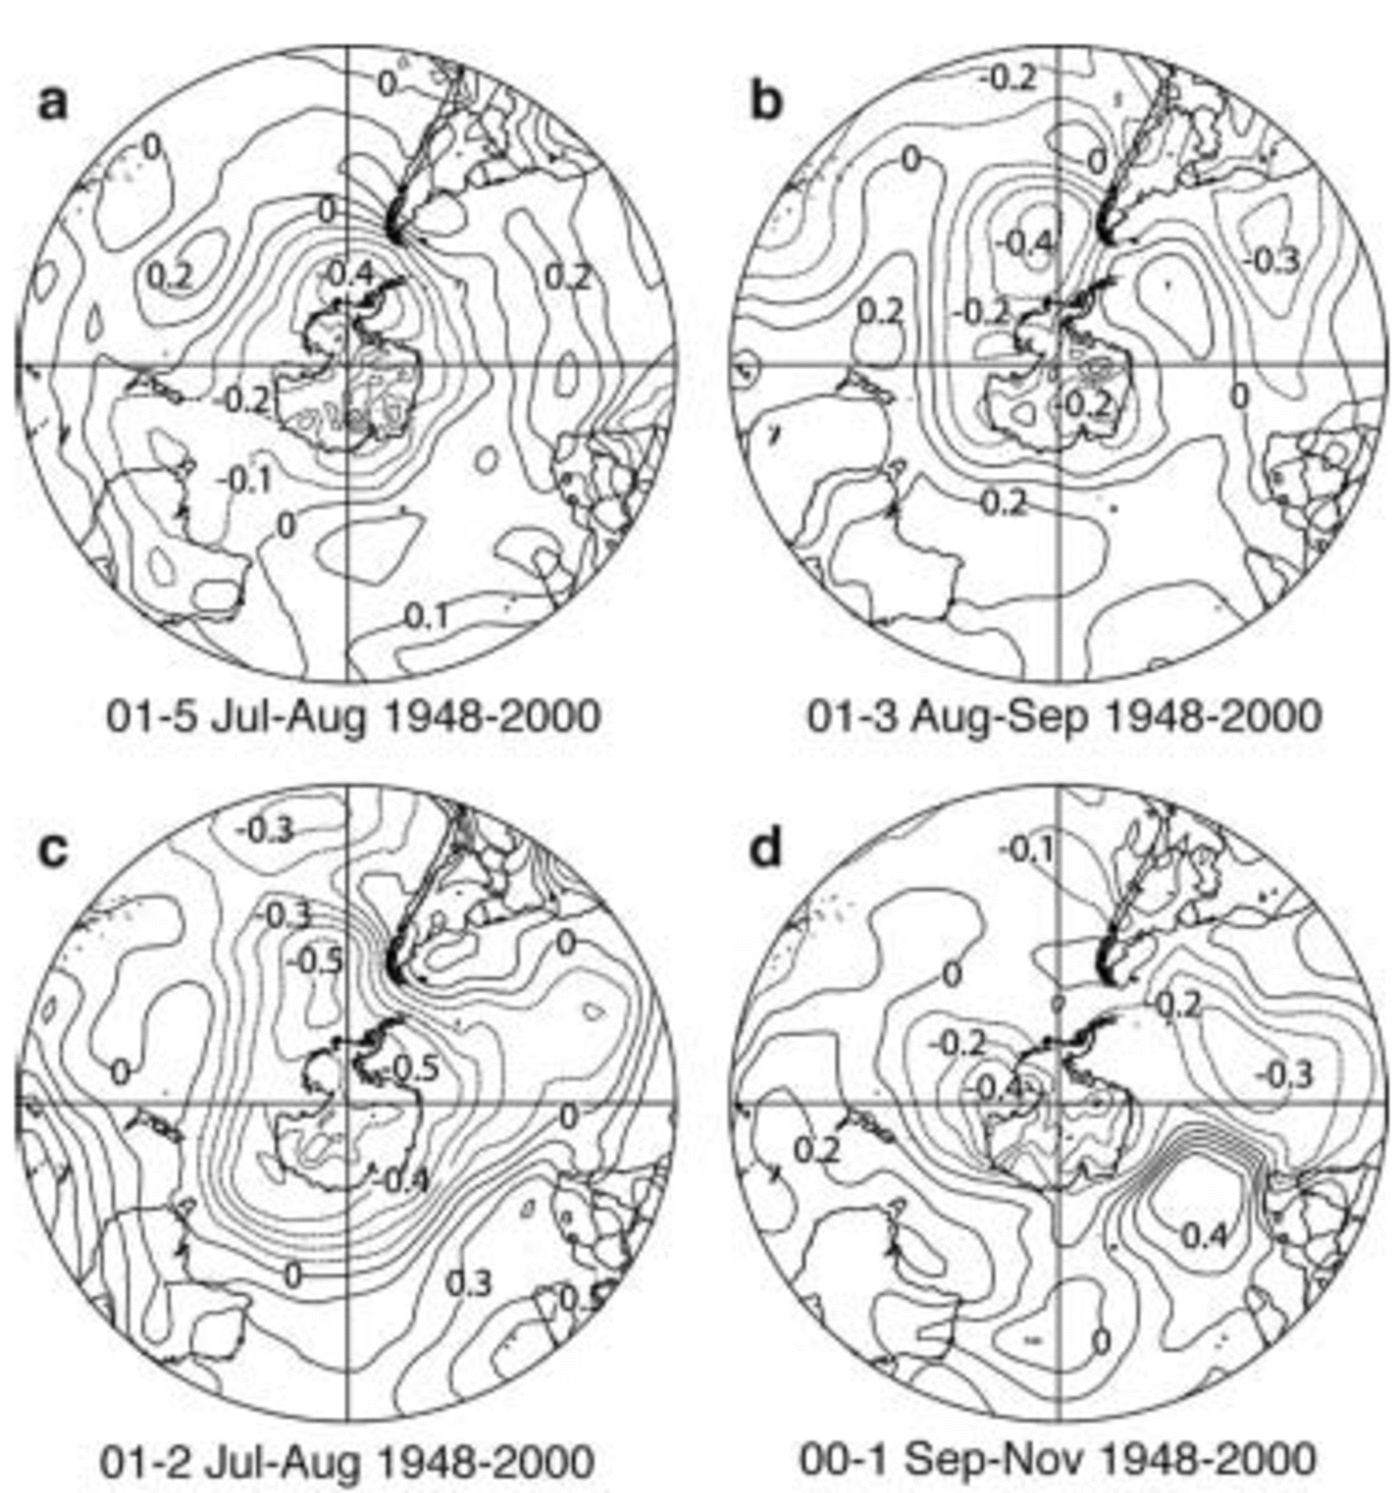
Higher accumulation in the non-summer seasons results from increased intensity of cyclonic activity (Reference BromwichBromwich, 1988), which can dominate the effect of temperature and moisture transport (Reference Morgan, Goodwin, Etheridge and WookeyMorgan and others, 1991). The accumulation-rate records were correlated with monthly averaged SLP from the US National Centers for Environmental Prediction (NCEP) re-analysis (Reference KalnayKalnay and others, 1996) from 1948 to the present (r =±0.345; p < 0.01). Sites located in the Pine Island–Thwaites drainage basin (01-5, 01-3, 01-2, 00-1) (Fig. 2) are most strongly correlated with SLP near the coast (Fig. 8). Significant inverse correlations between SLP and accumulation exist at: 01-5 from July to August in the Weddell and Bellingshausen Seas (Fig. 8a); 01-3 from August to September in the Bellingshausen Sea (Fig. 8b); 01-2 from July to August in the Bellingshausen Sea (Fig. 8c); and 00-1 from September to November in the Ross Sea (Fig. 8d). These results suggest that accumulation variability in the Pine Island–Thwaites drainage system is correlated to localized, low-pressure systems. The strongest SLP–accumulation-rate correlations occur between July and November, coincident with snow accumulation occurring mainly in the winter or non-summer seasons.
Correlations of the annual accumulation-rate records from sites 01-5 (a), 01-3 (b), 01-2 (c) and 00-1 (d) and SLP from the NCEP re-analysis. Images created on the US National Oceanic and Atmospheric Administration (NOAA)–Cooperative Institute for Research in Environmental Sciences (CIRES) Climate Diagnostics Center web site at http://www.cdc.noaa.gov/.
Accumulation-rate–SLP correlation analysis was repeated for sites located near the ice divide and in the Ross drainage system (RIDS A, RIDS B, RIDS C, 00-4, 00-5, 99-1, Siple Dome) and at the South Pole, all of which did not show the local SLP correlation. Rather, the ice-divide and Ross drainage-system–SLP correlations are strongest at the mid-latitudes, but are more variable in timing and strength than the Pine Island–Thwaites drainage-system–SLP correlations. These results, though not definitive, may suggest that accumulation at higher, more inland sites is associated with processes occurring in the mid-latitudes. This is consistent with one study that found SLP–accumulation-rate correlations in the 40–50˚ S latitude zone in East Antarctica (Reference EnomotoEnomoto, 1991), and with previous studies that indicate a mid-latitude moisture source for Antarctic precipitation (Reference Petit, White, Young, Jouzel and KorotkevichPetit and others, 1991; Reference Ciais, White, Jouzel and PetitCiais and others, 1995; Reference Reijmer, van den Broeke and ScheeleReijmer and others, 2002).
Periodicities
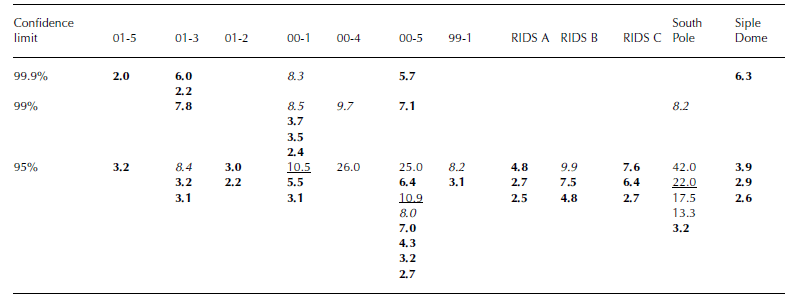
Spectral analyses of critical limits (for both red- and white-noise null hypotheses) using modified discrete Daniel smoothing (Reference BloomfieldBloomfield, 1976) were run on the accumulation-rate records (except for 01-6 because of the short record length) to determine the dominant spectral periods (Table 4). All records except for 00-4 have ENSO-like periodicities of 2–7 years above the 95% confidence limit, and the higher-elevation sites 01-3, 00-1, 00-5 and South Pole have ENSO-like periodicities above the 99% confidence limit. Periodicities of ∼11 and 22 years above the 95% confidence level for the three highest-elevation sites (00-1, 00-5 and South Pole) may be associated with the 11 year sunspot cycle, although no apparent mechanism is currently known for the link. Periodicities of 8–10 years at 01-3, 00-1, 00-4, 00-5, 99-1, RIDS B and South Pole are comparable to that of the Antarctic Circumpolar Wave (Reference White and PetersonWhite and Peterson, 1996). The higher-elevation (generally lower-accumulation) sites have more strongly expressed periodicities than the lower-elevation (generally higher-accumulation) sites. The lower-elevation sites may be being inundated by more frequent cyclones related to local climatic patterns that may dominate signals from external forcing mechanisms such as solar variability reflected in the sunspot cycles.
Accumulation-rate spectral analysis. Confidence limits are for both red and white noise. Values in bold: 2–7 year ENSO-like periodicities; underlined values: 11 year sunspot cycle-like periodicities; values in italic: 8–10 year Antarctic Circumpolar Wave-like periodicities
Conclusions
Long-term mean accumulation is largely a function of distance inland and elevation. Undulating topography in the region surrounding a core site can cause long-term (decade–century) trends in the accumulation record, and thus, for ice cores drilled in areas with complicated topography, efforts should be made to deconvolute these effects from the record. The temporal accumulation-rate variability at a site is largely controlled by climatic variations that control the delivery of precipitation. In regions where cyclones can penetrate inland (particularly the Pine Island– Thwaites drainage system in this study), changes in cyclonic intensity, frequency, seasonality and relative pathways contribute to interannual accumulation variability.
The accumulation decrease at sites 00-4, 00-5, RIDS C and Siple Dome and increase at sites 00-1, 01-2 and 01-3 since 1970, compared to the long-term record mean, may indicate an eastward shift in the dominant position of low-pressure systems along the coast of West Antarctica. The location of the SLP correlations at sites 00-1, 01-2 and 01-3 coupled with the increase in accumulation at these sites further suggests an intensification of cyclonic activity in the Pine Island–Thwaites drainage system since 1970. This could be an indication of change in lower-tropospheric circulation coincident with changes in temperature in other parts of the world, and perhaps associated with increased greenhouse gases and Antarctic ozone depletion over the last few decades.
The location of the SLP–accumulation-rate correlations for sites near the ice divide and in the Ross drainage system, coupled with the SOI correlation from the EOF analysis for the ice-divide sites, suggests that accumulation at sites further inland and at higher elevation is partially related to mid-latitude processes. This is consistent with previous studies showing a mid-latitude moisture source for inland regions of Antarctica. Reference Reijmer, van den Broeke and ScheeleReijmer and others (2002) used backward air trajectories to define potential moisture sources, and estimated that the dominant moisture source for Byrd Station, West Antarctica, was 50–70˚ S. Reference Petit, White, Young, Jouzel and KorotkevichPetit and others (1991) and Reference Ciais, White, Jouzel and PetitCiais and others (1995) used deuterium excess as a tracer for moisture sources and determined that Antarctic moisture has a subtropical origin (Petit: 30–40˚ S, Ciais: 20–40˚ S).
This study suggests that accumulation in the Pine Island– Thwaites drainage system is associated with local climate, whereas accumulation near the ice divide and in the Ross drainage system may be associated with mid-latitude mechanisms. The prevalence of cyclones in the Pine Island–Thwaites drainage system (relative to the Ross drainage system) is due to its proximity to the coast and topographic pathways that enable cyclones to penetrate inland. It is difficult to ascertain if the mid-latitude signal (i.e. the SOI and SLP correlations) present in the ice-divide and Ross drainage-system cores is present in the Pine Island– Thwaites drainage system. The localized cyclonic activity could be dominating the mid-latitude signal, although cyclonic activity near Antarctica is not entirely independent of the mid-latitudes. If the ENSO-like periodicities present in nearly all records are caused by ENSO, this would suggest the presence of a mid-latitude signal across the region of study. Ice-core records from the Pine Island–Thwaites drainage system may largely reflect local climate variability, whereas records from the Ross drainage system are potentially more representative of mid-latitude climate. This may be clarified by future studies of the soluble ion chemistry from the ice-core records presented in this study and additional ITASE ice-core records.
Acknowledgements
This research was supported by the US National Science Foundation Office of Polar Programs. We thank M. Wumkes for drilling the ice cores, and the US Antarctic Program and the Raytheon Polar Services Company for logistical support.



