INTRODUCTION
Technology uptake indicators play an important role in influencing agricultural research and development policies and are pivotal for impact assessment. Yet measuring the adoption and diffusion of innovations remains challenging (CIMMYT, 1993; Rogers, Reference Rogers2003). Such indicators are particularly problematic for the agricultural sector in emerging economies, which are often characterized by a general paucity of data and a significant heterogeneity in the reliability and representativeness of data. The problem is exacerbated when the technology itself can be variously used, measured and/or interpreted. For instance, the case of seed often presents a relatively unambiguous dichotomous adoption decision (e.g. use or no use of variety V for a given season). In contrast, agronomic practices often present a combination of multiple adoption decisions (e.g. use of input W at dose X, Y days after using practice Z for a given season). Agronomic practices thereby typically imply a range of combinations in farmers' fields, adding to the difficulty of unambiguous measurement and interpretation for any given site and season. Further compounding these difficulties are the spatial and dynamic dimensions of technology use.
Triangulation offers particular promise vis-à-vis these daunting challenges to assess technology uptake. This analytical approach uses and contrasts data from multiple sources to strengthen interpretations. ‘By examining information collected by different methods, by different groups and in different populations, findings can be corroborated across data sets, reducing the impact of potential biases that can exist in a single study,’ (UCSF GHS, 2009).
The paper explores the use of triangulation to assess technology diffusion, using the diffusion of zero tillage (ZT) wheat in the Indo-Gangetic Plains (IGP) of Pakistan and northwest India as an empirical case. The emphasis on ZT development originated from diagnostic studies that highlighted the importance of time conflicts between rice harvesting and wheat planting in the prevailing rice-wheat systems (Byerlee et al., Reference Byerlee, Sheikh, Aslam and Hobbs1984; Fujisaka et al., Reference Fujisaka, Harrington and Hobbs1994). Zero tillage has subsequently been researched and promoted as an agricultural technology that can save resources, reduce production costs and improve production while sustaining environmental quality. Recent studies indeed show that ZT wheat after rice generates substantial cost savings and occasional yield increases in farmers' fields in the IGP (Erenstein et al., Reference Erenstein, Farooq, Malik and Sharif2008; Erenstein and Laxmi, Reference Erenstein and Laxmi2008).
In both India and Pakistan, ZT research and development emphasized the use of tractor-drawn ZT seed drills with six to eleven inverted-T tines. This specialized agricultural machinery was originally not available in South Asia. A key component in the technology diffusion was creating the local manufacturing capacity to supply adequate and affordable ZT drills. In Pakistan, adaptive research designed to make ZT methods suitable for local conditions started during the mid 1980s following the importation of a prototype drill with inverted-T openers from Aitcheson Industries, New Zealand. In India, the inverted-T openers were introduced in 1989, and in 1991 a first prototype of the Indian ZT seed drill was developed at G. B. Pant University of Agriculture and Technology, Pantnagar, India. In both countries a collaborative programme for further development and commercialization of ZT drills by small-scale farm machinery manufacturers was initiated by the national agricultural research system in collaboration with the International Maize and Wheat Improvement Centre and subsequently the Rice-Wheat Consortium (RWC; Erenstein and Laxmi, Reference Erenstein and Laxmi2008).
A problem with estimating ZT diffusion is that it is a cultural practice that is sparsely reported in agricultural statistics and studies. The actual extent to which ZT has diffused across the IGP is indeed not precisely known. Adding to the uncertainty surrounding its diffusion is the ambiguous interpretation of ZT by stakeholders including farmers: the term is often used interchangeably for both the practice (crop establishment into unploughed fields) and the implement use (a ZT drill, which in addition to unploughed fields can also be used in conventionally or reduced tilled fields). This implies that ZT can not be unequivocally measured by any single question. Instead, measurement typically needs further questions and/or probing, which introduces further fuzziness in ZT uptake indicators. There was thus a need to triangulate ZT uptake indicators in the IGP.
The objective of the paper is to present a triangulation approach to assess technology diffusion and illustrate it by assessing the extent and dynamics of ZT wheat in South Asia's rice-wheat systems.
MATERIAL AND METHODS
Triangulation approach to technology diffusion
Triangulation typically refers to the use of multiple research methods to examine a phenomenon so as to enhance confidence in the ensuing findings (Bryman, Reference Bryman2009). It ‘can be broadly defined as the synthesis and integration of data from multiple sources through collection, examination, comparison and interpretation. By first collecting and then comparing multiple datasets with each other, triangulation helps to counteract threats to the validity of each data source,’ (Peersman et al., Reference Peersman, Komatsu, Pervilhac and Garcia-Calleja2008).
The concept of triangulation is not new: Webb et al. (Reference Webb, Campbell, Schwartz and Sechrest1966) coined the term building on earlier work introducing the use of multiple methods (Mathison, Reference Mathison1988). It has subsequently been variously developed as a social science research method (Bryman, Reference Bryman2009; Denzin, Reference Denzin2009; Flick, Reference Flick2008). Ideally, triangulation results in convergence that provides a better and more meaningful interpretation of the phenomenon – although some criticize it for ‘subscribing to a naive realism that implies that there can be a single definitive account of the social world’ (Bryman, Reference Bryman2009). When triangulation yields inconsistent or contradictory evidence, the researcher must attempt to explain the divergence (Mathison, Reference Mathison1988). Some argue though that datasets from different research methods cannot be ‘unambiguously compared and regarded as equivalent in terms of their capacity to address a research question’ (Bryman, Reference Bryman2009).
Diverse fields of social science have used triangulation ‘to strengthen conclusions about observations, and to reduce the risk of false interpretations by drawing upon multiple independent sources of information’ (Peersman et al., Reference Peersman, Komatsu, Pervilhac and Garcia-Calleja2008). Triangulation thereby combines and contrasts various data sources and different data-gathering methods to investigate the same phenomenon, including quantitative and qualitative studies and expert judgment. Triangulation is particularly useful when good comprehensive data do not exist, when the collection of new data is not feasible or cost-effective, or when the situation is changing (UCSF GHS, 2009).
Triangulation can use and contrast data from multiple sources collected by different methods, by different groups and in different populations/sites to assess the uptake of a particular agricultural technology. One can thus envisage triangulation as filling in a three-dimensional M × N × T matrix, with M technology uptake indicators for N sites for T points in time. Each site thereby represents a different study population. Each indicator thereby represents a specific diffusion statistic originating from a specific method and/or group. Ideally, each indicator is unambiguous and data are available to fill each cell of the matrix.
There is no inherent limit to the size of the three-dimensional matrix, but the objective of the analysis should drive the scope of the study. Similarly, data availability may dictate a preference for either a reduced matrix that can be largely filled or a larger matrix with numerous data gaps. There are also trade-offs between the ease of analysis and overextending the matrix in any or several dimensions. On the other hand, collapsing two dimensions allows in-depth analysis of the remaining third dimension and the use of associated analytical approaches, such as time-series analysis (T > 1), meta-analysis (N > 1) and multinomial analysis (M > 1).
There are common elements between triangulation and a robust research strategy – be it in terms of inclusiveness of sample populations and independent variables or the need for longitudinal or panel data. An important difference is that the triangulation draws from multiple independent sources of information. Each source thereby can have its own research method and contribute a different combination of technology uptake indicators, sites and/or points in time. Each source can ostensibly stand alone as an entity – but it is the comparison and integration of results from the different sources that provides additional insights.
Triangulation allows for the integration of different indicators from different datasets in different formats, which otherwise would be difficult to analyze. Still, the scope of inferences is enhanced when each individual indicator is unambiguously measured at each site. Indeed, inferences made from indicators derived from parallel studies are likely to be more robust than those derived from unrelated individual studies.
Data sources zero tillage case study
The triangulation approach is illustrated by contrasting various ZT diffusion indicators from three different data sources (secondary data, supply-side surveys, demand-side surveys) for two different locations (Haryana State, India and Punjab province, Pakistan). The study focuses on 2000–2004 as the most comprehensive data from the three sources are available for these years.
As a first data source the paper uses secondary data to assess the extent of ZT use in Haryana State (northwest India) and Punjab Province (northeast Pakistan, hereafter referred to as ‘Punjab’). The main secondary source is the RWC of the IGP, which used to compile annual estimates of the scale of adoption of various resource conserving technologies such as ZT (RWC, 2004; www.rwc.cgiar.org). Other published and unpublished literature was also reviewed.
As a second data source the paper uses two parallel surveys of ZT drill manufacturers in Haryana and Punjab (Erenstein et al., Reference Erenstein, Malik and Singh2007b; Farooq et al., Reference Farooq, Sharif and Erenstein2007). As ZT is embodied in unique agricultural machinery, it is possible to assess the advent of the technology through such a supply-side analysis. An initial list of ZT drill manufacturers was compiled in each location – 25 in Haryana and 31 in Punjab – drawing on expert knowledge and word of mouth. All these manufacturers were directly interviewed in December 2003 to compile manufacturer's characteristics and sales history. The original lists proved not to be exhaustive, and altogether 35 ZT manufacturers were identified in Haryana and 43 in Punjab.
As a third data source the paper uses two parallel adoption surveys in the rice-wheat zones of Haryana State and Punjab Province (Erenstein et al., Reference Erenstein, Malik and Singh2007b; Farooq et al., Reference Farooq, Sharif and Erenstein2007). The two study areas were purposively chosen as they comprise the locations in the irrigated northwest IGP where ZT promotion was initiated and adoption was most significant. The two study areas are introduced and described in companion papers (Erenstein and Farooq, Reference Erenstein and Farooq2009; Erenstein et al., Reference Erenstein, Farooq, Malik and Sharif2008). These empirical surveys included a stratified random sample of 400 farmers in Haryana and 458 farmers in Punjab that were visited twice during 2003/04. To put the 2003/04 survey year in perspective, the surveys also traced the adoption history of each farmer. The present paper primarily focuses on diffusion-related indicators from these adoption surveys. Companion papers summarize the survey approach, and focus on the on-farm impacts of ZT wheat (Erenstein et al., Reference Erenstein, Farooq, Malik and Sharif2008) and factors affecting ZT adoption (Erenstein and Farooq, Reference Erenstein and Farooq2009). Comprehensive results and further methodological details are given in the respective country case studies (Erenstein et al., Reference Erenstein, Malik and Singh2007b; Farooq et al., Reference Farooq, Sharif and Erenstein2007) and synthesis (Erenstein et al., Reference Erenstein, Farooq, Malik and Sharif2007a).
RESULTS
Indicators from secondary data
Zero tillage adoption in South Asia started in the second half of the 1990s and accelerated in the early years of the 21st century (Erenstein and Laxmi, Reference Erenstein and Laxmi2008; RWC, 2004). Knowledgeable experts estimated the ZT drill planted wheat area in the IGP to amount to some 2 million ha in 2004/05, with 1.6 million in the Indian IGP (www.rwc.cgiar.org). Such ZT area estimates are often based on the sales of ZT drills and average area coverage per drill (e.g. Malik et al., Reference Malik, Gupta, Yadav, Sardana and Singh2005). These expert estimates of ZT drill use reflect the combined use for zero and reduced tillage (ZT + RT), as it is problematic to separate the two. Reduced tillage thereby often uses a tractor-drawn seed drill but still retains some minimal tillage prior to seeding, e.g. one or two tractor harrow passes. Reduced tillage may potentially dislodge anchored residues making the operation of the prevailing tined-ZT drill more problematic as these rake loose residues – but this is perhaps less of a problem in fields where limited residues remain in the first place (e.g. fields with manual harvesting and/or in situ burning of crop residues – Erenstein and Thorpe, Reference Erenstein and Thorpe2009).
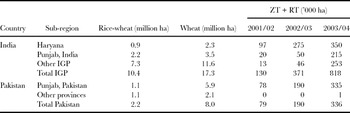
The RWC has subsequently stopped issuing area estimates as expert estimates have become less consistent in recent years (Erenstein and Laxmi, Reference Erenstein and Laxmi2008). In fact, 2003/04 was the last wheat season for which disaggregated area estimates are available at the sub-national level and for specific individual technologies (RWC, 2004). The disaggregated estimates show India's ZT + RT area to be concentrated in the northwest IGP, with the largest area in Haryana (Table 1). In Haryana alone, the estimated ZT drill planted area increased from some 2000 ha in 1999/2000 to 0.35 million ha in 2003/04. In Pakistan, the ZT + RT area was even more markedly concentrated in Punjab province, where similar to Haryana, adoption started to pick up after the turn of the century with an estimated 0.34 million ha planted with ZT drill in 2003/04. To put these numbers in perspective, Table 1 also includes the respective areas of the rice-wheat system and overall wheat cultivation. In Haryana, the estimated 0.35 million ha of ZT drill sown area (ZT + RT) represents 38% of the state's rice-wheat area and 15% of the state's wheat area. In Punjab, the estimated ZT drill sown area (ZT + RT) represents 30% of the province's rice-wheat area and 6% of the wheat area.
Geographic distribution rice-wheat system, wheat cultivation and estimated zero/reduced tillage use (ZT + RT) in the IGP of India and Pakistan.

Source: rice-wheat area – Aslam (Reference Aslam1998), Pal et al. (Reference Pal, Jha, Goel and Gulia2003); wheat area – unpublished government statistics; technology use – RWC (2004).
Zero tillage research and the associated data collection and reporting has both increased and improved in the past several years in the IGP. However, most studies primarily report on the technical aspects of ZT at the plot level and often are based on trial data (on-station and on-farm, Erenstein and Laxmi, Reference Erenstein and Laxmi2008). Many of the farm surveys are not based on a robust sampling frame that would allow for unbiased diffusion estimates. Instead, most farm surveys contrast a sample of ZT adopters with non-adopters (e.g. Bakhsh et al., Reference Bakhsh, Hassan and Maqbool2005; Jamal et al., Reference Jamal, Akhtar and Aune2007; Sarwar and Goheer, Reference Sarwar and Goheer2007; Singh, Reference Singh2008). Reliable and empirically based ZT diffusion indicators are particularly scarce and problematic. Lacking other estimates, the expert estimates of ZT adoption are often repeated and cited by others. However, in the process, the two important underlying qualifications are often omitted – i.e. that these are expert estimates and not empirically based, and that these reflect estimated ZT drill use and thereby ZT + RT, instead of ZT proper.
Indicators from manufacturer surveys
The parallel surveys of ZT drill manufacturers characterized the supply of ZT drills in the study areas (Erenstein et al., Reference Erenstein, Malik and Singh2007b; Farooq et al., Reference Farooq, Sharif and Erenstein2007). By 2004, 92 ZT drill manufacturers were known to operate in the Indian IGP. The manufacturing capacity in India is spatially concentrated, with 79 manufacturers located in the northwest (35 in Haryana and 44 in Indian Punjab). By 2004, 45 ZT drill manufacturers were known to operate in Pakistan, with all but two located in Punjab province.
In each study area, ZT manufacturing capacity is geographically concentrated in the rice-wheat belt (northeast of Haryana and northeast of Pakistan Punjab), part of the Green Revolution heartland. In Pakistan, this corresponds to the traditional farm-machinery-making centres for cultivators and threshers, such as Daska town in Sialkot district, Punjab. In India, the first commercial ZT drills also originated from the traditional machinery-manufacturing centres like Ludhiana and Amritsar in Indian Punjab. It was only later that manufacturers in Haryana joined this business.
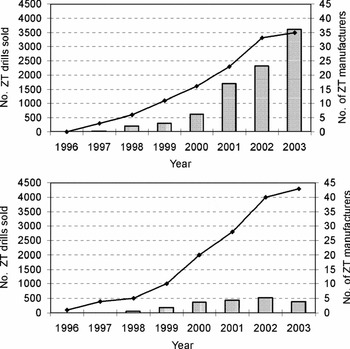
The number of ZT drill manufacturers increased slowly in the 1990s, showed four years of steady growth around the turn of the century, but started to stagnate in 2003 (Figure 1). In Haryana, increasing average sales per manufacturer contributed to the growth in aggregate annual ZT drill sales (Figure 1), with a cumulative total of 8785 ZT drill machines sold by the 25 surveyed manufacturers by the end of 2003. In Punjab, the aggregate annual ZT drill sales stalled over the same period (Figure 1), with a cumulative total of 1957 ZT drill machines sold out of 2088 manufactured by the 31 surveyed manufacturers by the end of 2003.
Number of ZT drills sold per year by surveyed manufacturers (columns) and total number of ZT drill manufacturers (lines) (upper: Haryana; lower: Punjab), 1995–2003. Source: Erenstein et al. (Reference Erenstein, Farooq, Malik and Sharif2007a).

The comparison of the ZT drill sales figures in Haryana and Punjab is revealing. The two areas show a largely similar increase in the number of manufacturers over time, both in absolute and relative terms, although aggregate sales figures for surveyed drill manufacturers for Punjab are a fraction of those for Haryana (Figure 1). Whereas annual ZT drill sales figures for surveyed manufacturers in Haryana were still on the increase, the sales figures in Punjab were relatively flat with peak sales in 2002.
Manufactured ZT drills are also exported to other states/provinces in the respective countries. In Pakistan, nearly 90% of the manufactured drills were sold to farmers within the same Punjab province, with the remaining 10% sold to other provinces. Conversely, in Haryana, ZT drills are also brought in from neighbouring Indian Punjab, which also witnessed a significant growth in ZT manufacturing capacity and output. For instance, by the end of 2003, a cumulative total of 6916 ZT drill machines had been sold by an additional 25 surveyed manufacturers in Indian Punjab (Erenstein et al., Reference Erenstein, Malik and Singh2007b).
The wider manufacturing base and significant growth in sales imply healthy competition between manufacturers in India, with favourable implications for price and quality and generally lighter drills. The average sale price of a ZT drill in 2003 amounted to US$325 in India as against US$559 in Pakistan. Indian government support for ZT has also led to a subsidy on the purchase of ZT drills in some states (e.g. 25% in Haryana), which further lowered the acquisition price.
If one assumes all the reported ZT drills (8785) in Haryana to have been operational in 2003/04, and unreported sales to cancel out unavailable machines (e.g. machines exported to other states), then the reported 0.35 million ha of ZT drill sown area (ZT + RT) in Haryana state in 2003/04 (RWC, 2004) implies an average of 40 ha planted per reported ZT drill. This compares reasonably with the results of a survey of 153 ZT drill-owning farmers in Haryana, which showed that on average each ZT machine had planted 42 hectares of wheat in 2001/02 (Punia et al., Reference Punia, Malik, Yadav, Singh, Nehra, Malik, Balyan, Yadav and Pahwa2002). However, this may only reiterate that ZT area estimates are primarily based on drill sales (Erenstein and Laxmi, Reference Erenstein and Laxmi2008). In contrast, similar assumptions for Pakistan's Punjab would imply 171 ha per reported ZT drill. This figure seems relatively high, suggesting either the assumptions or the underlying data to be somewhat inaccurate.
Indicators from farm surveys
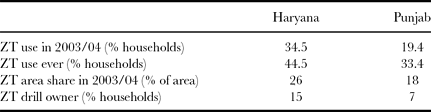
The parallel adoption surveys compiled a number of technology use indicators for rice-wheat farmers, interpreting ZT as the use of a ZT drill for wheat in untilled fields (Table 2, Erenstein et al., Reference Erenstein, Malik and Singh2007b; Farooq et al., Reference Farooq, Sharif and Erenstein2007). The farm surveys empirically confirm the significant levels of ZT adoption for wheat in the rice-wheat systems of the northwest IGP, underscoring the appeal of the technology among farmers. The indicators also consistently suggest a more widespread ZT diffusion in Haryana compared to Punjab.
ZT adoption indicators from farm surveys for wheat season 2003/04.
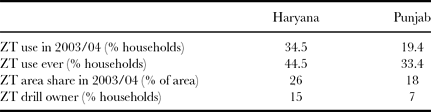
Note: Haryana n = 400, Punjab n = 458. Source: Erenstein et al., Reference Erenstein, Farooq, Malik and Sharif2007a.
Zero tillage was used by a third of rice-wheat farmers in Haryana and a fifth in Punjab during the winter season 2003/04 (Table 2). Zero tillage penetration – i.e. those who had ever used ZT by 2003/04, irrespective of whether they did so in the survey year – was somewhat higher still (Table 2). This reflects an additional 10% in Haryana and 14% in Punjab who had used ZT in preceding seasons, but did not do so in the 2003/04 season for whatever reason. Zero tillage drill ownership was significantly less widespread in Punjab (Table 2), in line with ZT drill sales and ZT use – albeit that the majority of ZT adopters relied on contracted ZT drill services in both sites. This is in line with the common tillage practices where many farmers do not own a tractor but rely on tillage contract services to get their fields prepared.
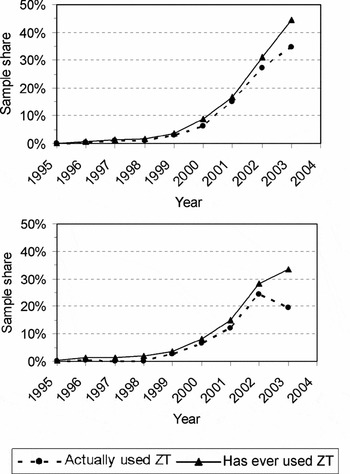
The parallel farm surveys included retrospective responses of surveyed farmers to when they first used ZT and their use since. These responses are plotted in Figure 2 to illustrate the dynamics of ZT. The figure thereby distinguishes between ZT adoption (i.e. those who actually used ZT in the corresponding year) and ZT penetration (i.e. those who had used ZT by that year). In Haryana, ZT adoption was still on the increase, but in Punjab it peaked in 2002/03, similar to the ZT drill sales peak. Most discontinuation of ZT was of recent nature in both sites, and was particularly pronounced in the 2003/04 (Figure 2).
Diffusion of ZT based on first year of use for surveyed farms (upper: Haryana; lower: Punjab). Source: Erenstein et al. (Reference Erenstein, Farooq, Malik and Sharif2007a).

In the case of Haryana, the ZT drill diffusion in many ways followed the traditional diffusion pattern of technological innovations (CIMMYT, 1993; Rogers, Reference Rogers2003). After nearly a decade of adaptive research, demonstration and slow initial diffusion, diffusion started to pick up from 2000 onwards. The data suggest that ZT adoption levels for wheat may end up somewhat higher than the observed one-third of the surveyed rice-wheat farmers at the time of the survey (Figure 2). In the case of Punjab, up to 2002/03, ZT diffusion in many ways seemed to follow the traditional diffusion pattern of technological innovations as in Haryana. Diffusion started to pick up as from 2000, but adoption rates seem to have abruptly peaked in 2002/03 (at 24%, Figure 2). A separate study in Punjab reports a considerable increase in ZT adoption between 2000 and 2003, although without any signs of peaking (Ahmad et al., Reference Ahmad, Turral, Masih, Giordano and Masood2007). Follow up survey work is needed to assess whether ZT adoption levels for wheat in Punjab may end up significantly lower or higher than at the time of the parallel farm survey.
The ZT adopter farms typically were partial adopters: i.e. only a share of their wheat area was put under ZT – 53% in Haryana and 74% in Punjab – with the remaining still under conventional tillage. This implies the actual area under ZT is typically less than the rate of adoption in terms of farmers (Table 2). In Haryana, the difference between the number of ZT adopters (34.5%) and ZT wheat area (26%) reflects the prevailing partial adoption partly being compensated by the larger operational holdings of adopters (Erenstein et al., Reference Erenstein, Malik and Singh2007b). In Punjab, the two ZT adoption indicators are relatively close, reflecting more intense adoption on adopter farms and again the larger operational holdings of adopters (Farooq et al., Reference Farooq, Sharif and Erenstein2007).
Contrasting indicators and sites
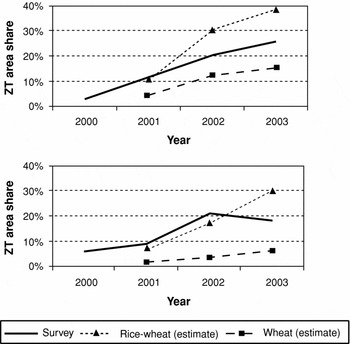
The adoption survey estimates can be contrasted with the aggregate expert estimates (Table 1). Figure 3 illustrates how the retrospective survey data for the relative ZT area share compare over time with the expert estimates expressed as a share of rice-wheat and wheat area. The adoption survey estimates for the rice-wheat belt thereby fall within a similar range to the expert estimates. However, one should recall that the stratified sampling frame for the parallel adoption surveys focused on the rice-wheat heartland and typically comprised the districts where ZT dissemination started and diffusion took off. One may therefore expect these survey adoption estimates to be more favourable when compared to the rice-wheat system as a whole. Furthermore, the evolution of the ZT area in the Punjab survey sites shows a pronounced peak (Figure 3), similar to the one observed for farmer adoption rates (Figure 2). A subsequent revisit to the same rice-wheat villages in Punjab in 2004/05, again reported the ZT peak in 2002/03 but also showed that the downward trend in ZT area continued in the 2004/05 season (Farooq et al., Reference Farooq, Sharif and Erenstein2007). This suggests that the expert estimates may actually be on the high side, especially for Pakistan when taking into account the number of reported drills and the recent dynamics in ZT uptake.
Aggregate ZT area share over time based on farm survey and expert estimates (upper: Haryana; lower: Punjab). Source: adapted from Erenstein et al. (Reference Erenstein, Farooq, Malik and Sharif2007a) (farm survey) and RWC (2004) (expert estimates expressed as share of rice-wheat and wheat area).

An innovation's perceived relative advantage is one of the strongest predictors of its rate of adoption (Rogers, Reference Rogers2003). Zero tillage is a profitable proposition in both study areas (Erenstein et al., Reference Erenstein, Farooq, Malik and Sharif2008). In Haryana, the combination of a significant ‘yield effect’ and ‘cost-saving effect’ makes adoption worthwhile and is the main driver behind the rapid spread and widespread acceptance of ZT. In Punjab, adoption is driven by the significant ZT-induced cost savings for wheat cultivation. The cost savings were of similar magnitude, such that the combined effect in Haryana enhances ZT's relative advantage and helps explain its faster diffusion. The rate of adoption is often also associated with other perceived innovation attributes such as compatibility, complexity, trialability and observability (Rogers, Reference Rogers2003), but these appear relatively similar for ZT in both areas.
The extent of change agents' promotional efforts in diffusing an innovation also affect its adoption rate (Rogers, Reference Rogers2003). The slower diffusion and higher disadoption in Punjab are likely associated with the ongoing institutional ZT controversy there and calls for a more objective and synergetic approach to ZT (Erenstein et al., Reference Erenstein, Farooq, Malik and Sharif2007a). The provincial extension department has long been opposed to ZT because of possible stem-borer problems, but these appear to be unfounded. Compared to Haryana, the advent of ZT in Punjab has been severely hampered by the polarization of the research and development field in terms of ZT advocates and ZT opponents, with farmers facing conflicting information and lack of institutional support.
Both case study sites also revealed significant ZT disadoption and better understanding of the rationale for disadoption merits further scrutiny. The parallel survey findings suggest that there is no clear single overarching constraint, but that a combination of factors is at play, including technology performance, technology access, seasonal constraints, and particularly in the case of Pakistan's Punjab, the institutional ZT controversy (Erenstein et al., Reference Erenstein, Farooq, Malik and Sharif2007a). In terms of technology performance, the relative ZT yield was particularly influential: zero tillage disadopters reporting low ZT yields as a major contributor to farmer disillusionment in Punjab and the lack of a significant yield effect in Haryana. Knowledge blockages, resource constraints, and ZT drill cost and availability all contributed to non-adoption.
DISCUSSION
The ZT case study illustrates the potential of multi-indicator triangulation. No single ZT diffusion indicator is typically sufficient. Each indicator typically has some inherent flaw – be it in terms of its reliability, robustness, completeness, measurability, data requirements, cost-effectiveness, timeliness and potential for up-scaling and out-scaling. Each indicator thereby represents trade-offs between these attributes. Whereas multi-indicator triangulation can not offset the inherent trade-offs of each indicator, it's reliance on a portfolio of indicators does allow for more robust inferences.
Such robustness is particularly important for an agronomic practice like ZT which is variously interpreted, measured and/or used in the IGP. The triangulation exercise indeed found various forms of partial ZT adoption – i.e. variations in the mode of ZT use:
• Reduced tillage: The parallel farm surveys primarily found ZT, but in most secondary data it is often difficult to disentangle ZT from RT. The few studies that have attempted to do so found RT to exceed ZT in the IGP (Erenstein, Reference Erenstein2009; Erenstein and Laxmi, Reference Erenstein and Laxmi2008).
• Seasonal: The use of ZT in the IGP is typically seasonal for the winter wheat crop only. The subsequent monsoon rice crop still is intensively tilled reflecting farmers' adherence to puddling soils and transplanting for rice (Erenstein et al., Reference Erenstein, Farooq, Malik and Sharif2008).
• Technology disaggregation: ZT is associated – and sometimes used synony-mously – with the conservation agriculture principles of minimal soil disturbance and mulching. In the study areas ZT adopters have typically unpackaged these components, using ZT with limited retention of crop residues (Erenstein et al., Reference Erenstein, Farooq, Malik and Sharif2008).
• Farm area: ZT adopters typically applied ZT to only a share of their wheat area, with the remaining still under conventional tillage – a finding observed for both ZT drill owners and those reliant on ZT-service providers (Erenstein et al., Reference Erenstein, Malik and Singh2007b; Farooq et al., Reference Farooq, Sharif and Erenstein2007).
The ZT case study also illustrates the potential of multi-site triangulation. Technology use has marked spatial dimensions, implying that most technology uptake studies are inherently site-specific. The inclusion of more than one site thereby provides the necessary perspective and allows for site contrasts. A case in point is the differential adoption in the Pakistani and Indian sites. The feasibility and added value of site contrasts, however, hinges on the availability of similar data sets and indicators. The case study thereby also underlines the value of parallel studies.
The ZT case study also illustrates the need for a multi-year perspective. Technology uptake is by definition dynamic whereas particularly agronomic practices like ZT are subject to seasonal oscillations. Only by taking a multi-year perspective can one assess whether the trend in uptake dynamics is relatively flat, increasing or even declining. Granted, retrospective questioning of stakeholders such as manufacturers and farmers may be imperfect. However, in view of the general lack of baseline data, monitoring data and/or adoption surveys, these proxies at least provide the necessary dynamic perspective. Indeed, although often called for, the need for longitudinal or panel data is seldom achieved in social change research. The ZT adoption surveys flagged the issue of disadoption, and thereby provided a useful reminder that technology uptake can also be discontinued. At the same time adoption surveys should be designed such that they can explain eventual disadoption unambiguously.
To facilitate triangulation the ZT case study opted to focus on the period 2000/04 and on two sites for which comparable indicators were available from three sources. Still, such choices implied trade-offs, for instance in terms of omitting the more recent dynamics or including more sites or other sources – issues which are explored further elsewhere (Erenstein, Reference Erenstein2009; Reference Erenstein2010; Erenstein and Laxmi, Reference Erenstein and Laxmi2008). A particular challenge is to identify and fine-tune robust and complementary indicators that reduce such trade-offs. The use of remote sensing tools to monitor the diffusion of agronomic practices such as ZT holds promise, and it merits being explored further (e.g. Ortiz-Monasterio and Lobell, Reference Ortiz-Monasterio and Lobell2007). However, in the case of the IGP its application has so far been hampered by the relatively small plot sizes and the remote sensing resolution. Other potential information sources for triangulation include ZT drill service providers and/or ZT drill owners on the supply side and village surveys on the demand side. Random farm household surveys are often preferred for empirical studies but have their limitations, including being costly and time consuming. Village surveys can thereby provide a timelier and cheaper alternative and may, therefore, be more suitable for monitoring large areas and capturing timely feedback (e.g. Erenstein, Reference Erenstein2009; Erenstein and Thorpe, Reference Erenstein and Thorpe2009). The potential of village surveys for monitoring ZT use in the same and other sites is explored elsewhere (Erenstein, Reference Erenstein2010).
The triangulation benefited from having parallel structured surveys, although such standardization did imply some loss in flexibility (e.g. in terms of adapting surveys to each locality) and variations in interpretation and measurement were not always eliminated (Erenstein et al., Reference Erenstein, Farooq, Malik and Sharif2007a). There is scope for combining qualitative and quantitative approaches in assessing the uptake and adaptation of technologies like ZT (Erenstein and Farooq, Reference Erenstein and Farooq2009). The triangulation would have benefited from complementary informal surveys and participatory approaches to shed more light on understanding, for instance, the reasons for disadoption and partial adoption and disentangling the underlying causes. The farm surveys generated some insight but could not resolve a number of imponderables (e.g. the site-specific circumstances disadopters faced in terms of their access to drill, the quality of the drill, timeliness, quality of soil, the skill of the operator, etc.). Combining such complementary approaches can enrich triangulation and enhance the interpretation and validity of our findings.
Refinements in the underlying research methods, technology uptake indicators and spatial and temporal inclusiveness could enhance the relevance of the underlying case study. However, the case study's contribution is primarily in showing the potential of bringing and considering together indicators from three different sources and the insights derived from the whole are thereby more than from the sum of its parts.
Finally, the present study warns against primarily relying on expert estimates for the diffusion of technologies. These estimates need to be ground truthed through empirical surveys to assess actual use, eventual disadoption and adaptations by farmers. Recently other resource-conserving technologies like laser levelling and bed planting are showing promise in the IGP and merit similar empirical scrutiny.
CONCLUSION
Triangulation provides a useful tool to help assess the diffusion of new agronomic practices in emerging economies. The ZT case study illustrates the potential of multi-indicator, multi-site and multi-year triangulation. Such triangulation enhances the robustness of the inferences and provides the necessary perspective. The three main data sources for the case study coincide in terms of diffusion of ZT wheat having picked up since 2000 and being relatively widespread in Haryana and Pakistan Punjab. However, the empirical surveys also show a much slower and stagnating uptake in the Pakistan Punjab study area, and further follow-up studies are needed to confirm this. The paper thereby reiterates the need for empirical ground truthing of technology uptake and the need for robust and complementary diffusion indicators.
Acknowledgements
The paper complements earlier papers (Erenstein et al., Reference Erenstein, Farooq, Malik and Sharif2008; Erenstein and Farooq, Reference Erenstein and Farooq2009) and draws from two detailed country studies (Erenstein et al., Reference Erenstein, Malik and Singh2007b; Farooq et al., Reference Farooq, Sharif and Erenstein2007) and a synthesis (Erenstein et al., Reference Erenstein, Farooq, Malik and Sharif2007a). The original studies were funded through the Comprehensive Assessment of Water Management in Agriculture and benefited from complementary funding from USAID. The views expressed in this paper are the author's and do not necessarily reflect the views of the donor or the author's institution. The original studies benefited from the assistance of numerous individuals and institutions that have been acknowledged in the corresponding country reports to the extent possible. The paper benefited from reviewers' comments.