


Introduction
Anthropogenic litter, or debris, is a global phenomenon that can be defined as “persistent, manufactured or processed solid material discarded, disposed of or abandoned” (Galgani et al. Reference Galgani, Fleet, Van Franeker, Katsanevakis, Maes and Mouat2010). It includes materials such as plastics, metal, glass, and paper that have been intentionally or unintentionally deposited in the environment (Galgani et al. Reference Galgani, Fleet, Van Franeker, Katsanevakis, Maes and Mouat2010) and exists in different sizes and colours (Gallitelli and Scalici Reference Gallitelli and Scalici2022; Provencher et al. Reference Provencher, Bond, Avery-Gomm, Borrelle, Rebolledo and Hammer2017). Litter originates from the mismanagement of anthropogenic waste from both land and sea-based sources (Galafassi et al. Reference Galafassi, Nizzetto and Volta2019), and poses hazards for humans, wildlife, and the environment. The probability of wildlife–litter interactions, such as ingestion and entanglement (Sheavly and Register Reference Sheavly and Register2007), are increasing as global litter loads increase (Gall and Thompson Reference Gall and Thompson2015).
The ubiquity of birds in nature has led to their use as bioindicators of various types of pollution (Furness and Greenwood Reference Furness and Greenwood1993). Birds are known to frequently interact with anthropogenic litter, with Battisti et al. (Reference Battisti, Staffieri, Poeta, Sorace, Luiselli and Amori2019) finding evidence of 258 bird species interacting with litter in three main ways: ingestion (i.e. directly or indirectly ingesting litter), entanglement (i.e. getting entangled in litter), and use of litter as nesting material (i.e. incorporating litter into their nesting structure). These interactions have led to a range of impacts, including plasticosis (Charlton-Howard et al. Reference Charlton-Howard, Bond, Rivers-Auty and Lavers2023), injuries (Rodríguez et al. Reference Rodríguez, Bécares, Rodríguez and Arcos2013), toxicant exposure (Colabuono et al. Reference Colabuono, Taniguchi and Montone2010), biovectoring (Cano-Povedano et al. Reference Cano-Povedano, López-Calderón, Sánchez, Hortas, Cañuelo-Jurado and Martín-Vélez2023), and mortality (Costa et al. Reference Costa, Sá, Pereira, Angelo, Vaqueiro and Ferreira2020; Henry et al. Reference Henry, Wey and Balança2011). Therefore, understanding what drives bird–litter interactions is important for the development of litter regulation and management strategies to reduce negative impacts.
Bird–litter interactions are partly explained by phylogenetic relatedness. For example, Battisti et al. (Reference Battisti, Staffieri, Poeta, Sorace, Luiselli and Amori2019) found 79.8% of birds recorded as having interacted with litter were seabird species and further to this, Roman et al. (Reference Roman, Bell, Wilcox, Hardesty and Hindell2019a) found that taxonomic grouping, used as a proxy for shared behaviours, strongly predicted the number of litter items ingested by seabirds such as albatrosses and shearwaters. Functional traits relating to ecology (e.g. habitat, trophic niche, and primary lifestyle), and morphology (e.g. body mass), are also likely to influence bird–litter interactions. For example, Roman et al. (Reference Roman, Bell, Wilcox, Hardesty and Hindell2019a) and Schutten et al. (Reference Schutten, Chandrashekar, Dougherty, Stevens, Parmley and Pearl2024a) found that foraging behaviours influenced ingestion of plastic for seabirds and both freshwater and terrestrial birds respectively. Further, Wilcox et al. (Reference Wilcox, Van Sebille and Hardesty2015) found that increasing body mass resulted in an increasing frequency of ingestion for seabirds.
The probability of encountering litter is also thought to explain both inter- and intraspecies variances in bird–litter interactions. For example, litter ingestion by the Northern Fulmar Fulmarus glacialis decreases with latitude (Day Reference Day1980; Provencher et al. Reference Provencher, Bond, Avery-Gomm, Borrelle, Rebolledo and Hammer2017; Robards et al. Reference Robards, Piatt and Wohl1995; van Franeker Reference van Franeker1985; van Franeker et al. Reference van Franeker, Jensen, Simonsen, Rebolledo and Kühn2022), likely reflecting lower litter loads at higher latitudes due to greater distances from populated areas. Similarly, Jagiello et al. (Reference Jagiello, Dylewski, Tobolka and Aguirre2019) found that the probability of incorporating litter in nests by both marine and terrestrial birds was greater in areas with higher human footprint indices. It is unclear, however, whether these location-related patterns hold for other lesser-studied species.
Bird–litter interactions have been the subject of several reviews (Battisti et al. Reference Battisti, Staffieri, Poeta, Sorace, Luiselli and Amori2019; Jagiello et al. Reference Jagiello, Dylewski, Tobolka and Aguirre2019; Kibria Reference Kibria2024; Kühn and van Franeker Reference Kühn and van Franeker2020; Mansfield et al. Reference Mansfield, Reynolds, Lynch, Matthews and Sadler2024; Provencher et al. Reference Provencher, Bond, Avery-Gomm, Borrelle, Rebolledo and Hammer2017; Ryan Reference Ryan2018). However, quantitative meta-analyses are scarce (Kühn and van Franeker Reference Kühn and van Franeker2020; O’Hanlon et al. Reference O’Hanlon, James, Masden and Bond2017), particularly those examining factors that mediate bird–litter interactions. Further to this, bias towards marine species has led to a limited understanding of bird–litter interactions among non-marine species (Blettler et al. Reference Blettler, Abrial, Khan, Sivri and Espinola2018; Jagiello et al. Reference Jagiello, Dylewski, Tobolka and Aguirre2019; Mansfield et al. Reference Mansfield, Reynolds, Lynch, Matthews and Sadler2024). The most common measure reported in bird–litter research is frequency of occurrence (i.e. the proportion of affected samples relative to the total sampled) (Kühn and van Franeker Reference Kühn and van Franeker2020; Provencher et al. Reference Provencher, Bond, Avery-Gomm, Borrelle, Rebolledo and Hammer2017), with comparisons often based on species-specific frequencies derived by pooling data across multiple studies. Such approaches overlook between-study variability and the potential ecological drivers of bird–litter interactions, limiting our ability to identify consensus among studies. In addition, as frequency of occurrence is a binary measure (presence or absence), it may obscure variation in the severity or impact of bird–litter interactions. Additional litter measures relating to litter mass (i.e. the mass of litter items) and litter count (i.e. the number of litter items) are less often reported but arguably more indicative of the impact of bird–litter interactions (Bond and Lavers Reference Bond and Lavers2023; Provencher et al. Reference Provencher, Bond, Avery-Gomm, Borrelle, Rebolledo and Hammer2017). As such, there is an opportunity for quantitative meta-analysis of bird–litter research that considers the information revealed by multiple litter measures.
To gain an understanding of the influence of avian functional traits on bird–litter interactions, we conducted a systematic review with quantitative analysis. Specifically, we examined how the different measures of bird–litter interactions relating to ingestion, entanglement, and use as nesting material varied among sample method, taxonomic groupings, avian functional traits (habitat, trophic niche, primary lifestyle, and body mass), and latitude.
Methods
Literature search
We systematically reviewed the literature following the ROSES guidelines (Haddaway et al. Reference Haddaway, Macura, Whaley and Pullin2018). A search was conducted on Web of Science and Scopus databases on the 15th of April 2024, and repeated on the 15th of April 2025, using the following search terms: litter OR debris OR plastic AND pollut* OR anthropogenic OR human OR man-made AND *bird* OR avian AND NOT plasticity. Year of publication was unrestricted, and letters and book chapters were excluded. Search results were uploaded to Covidence (https://www.covidence.org/) where duplicates were removed automatically, and then manually by the authors. At least two reviewers conducted title and abstract screening, followed by full text screening. Studies advanced to the next review stage if they met the following inclusion criteria: (1) reported on at least one interaction type between birds and litter (ingestion, entanglement, and/or use of litter as nesting material); (2) contained original, primary data (i.e. not reused from a previous study) from a peer-reviewed scientific journal; (3) presented data in a format suitable for analysis (i.e. all studies had to present a frequency of occurrence, or sufficient data for it to be derived); and (4) involved collection of a randomised sample (i.e. case studies were excluded). Reviews were excluded; however, their reference lists were scanned for any additional papers not already included. After both screening stages, 325 studies were included in the data extraction process (269 studies from the first search and 56 studies from the second; Supplementary material Figure S1). For entanglement records, only studies involving entanglement from anthropogenic litter were included, excluding cases involving active fishing gear (i.e. bycatch) (Kühn and van Franeker Reference Kühn and van Franeker2020; Ryan Reference Ryan2018).
Data extraction
The database was organised such that each row represented a unique sampling event. A sampling event was defined as a unique combination of a single bird species and one or more of the following measures: frequency of ingestion, frequency of entanglement, or frequency of litter use as nesting material. As such, studies could be represented by multiple rows in the database if they reported on multiple species, or multiple sampling events for the same species (e.g. sampled across different time periods, or across different sites, regions, countries, bird breeding colonies). Conversely, if only a single value was presented across multiple sites or time periods, only a single sampling event could be represented in the database. From 325 studies, a total of 1,777 sampling events satisfied the inclusion criteria. From each event, metadata fields included sample size, sample method, latitude, interaction type, and litter measures (frequency of occurrence, mean litter mass, and mean litter count). These data were extracted from the studies’ main text, tables, figures, and supplementary information. Sample methods differed by interaction type. Ingestion was assessed using carcasses, faecal samples, pellets, and regurgitates (i.e. lavage and emetics). Entanglement was documented through direct observation or record of entangled individuals, while use of litter as nesting material was assessed from nest photographs, nest observation, and nest sampling or dissection. Where latitude was not provided, an estimated latitude was derived based on site information or from a centroid location among reported sampling points, and only where the difference between sites was <1° of latitude. Studies investigating feeding of chicks by adults were classified under ingestion (sensu Amélineau et al. Reference Amélineau, Bonnet, Heitz, Mortreux, Harding and Karnovsky2016 and Bond et al. Reference Bond, Jones, Williams and Byrd2010). The mean abundance of litter was recorded and calculated based on all observations (e.g.:
$ \left(0+1+0+2+0+3\right)/6 $
 sensu Provencher et al. Reference Provencher, Bond, Avery-Gomm, Borrelle, Rebolledo and Hammer2017; Schutten et al. Reference Schutten, Chandrashekar, Dougherty, Stevens, Parmley and Pearl2024a).
Avian functional traits
The following traits were extracted from the global dataset AVONET (Tobias et al. Reference Tobias, Sheard, Pigot, Devenish, Yang and Sayol2022) for each species: phylogenetic order, habitat, trophic niche, primary lifestyle, and body mass (Supplementary material Table S1). Trophic niche summarised the major resources used by birds, and primary lifestyle referred to the predominant locomotory niche while foraging (Tobias et al. Reference Tobias, Sheard, Pigot, Devenish, Yang and Sayol2022). Inconsistencies in common and scientific species names were manually resolved according to the eBird taxonomy (Clements et al. Reference Clements, Rasmussen, Schulenberg, Iliff, Fredericks and Gerbracht2024). Where sub-species were recorded but not represented in AVONET, traits were assigned at the highest common taxonomic level.
Quantitative analysis
Correlations among the three litter measures (frequency of occurrence, litter mass, and litter count) were assessed using scatterplots, Spearman’s rank correlation coefficient, and locally estimated scatterplot smoothing (LOESS).
All data were examined visually using violin plots which demonstrated the non-parametric nature of the data and highlighted the considerable variation in sample sizes across sampling events (range 1–15,499). To reduce zero–one inflation associated with small sample size, only groups with ≥10 sampling events that had a sample size of ≥10 were included in analysis, consistent with previous findings that found low sampling effort produced high variability (Bond and Lavers Reference Bond and Lavers2023).
For categorical variables (sample method, species, order, habitat, trophic niche, and primary lifestyle), data were visualised using violin plots. For each interaction type we calculated median frequency of occurrence and group-level medians of litter mass and litter count, as well as interquartile ranges (IQR). Differences among groups were tested using Kruskal-Wallis tests with post-hoc Dunn’s test and Bonferroni corrections. Statistical evidence was interpreted following Muff et al. (Reference Muff, Nilsen, O’Hara and Nater2022): P > 0.1 indicates little or no evidence; 0.05 < P ≤ 0.1 weak evidence; 0.01 < P ≤ 0.05 moderate evidence; 0.001 < P ≤ 0.01 strong evidence; and P ≤ 0.0001 very strong evidence.
For continuous variables (body mass and latitude) scatterplots were used to examine frequency of occurrence, litter mass, and litter count across individual bird body mass values and along the latitudinal gradient. Spearman’s rank correlation coefficients were calculated, and LOESS smoothing was applied.
All data visualisation and analyses were conducted in R (R Core Team Reference Team2025) using the packages colorspace (Zeileis et al. Reference Zeileis, Fisher, Hornik, Ihaka, McWhite and Murrell2020), ggpubr (Kassambara Reference Kassambara2025a), gt (Iannone et al. Reference Iannone, Cheng, Schloerke, Hughes, Lauer and Seo2025), ggtext (Wilke and Wiernik Reference Wilke and Wiernik2022), multcompView (Graves et al. Reference Graves, Piepho, Selzer and Dorai-Raj2024), patchwork (Pedersen Reference Pedersen2025), paletteer (Hvitfeldt Reference Hvitfeldt2021), rstatix (Kassambara Reference Kassambara2025b), treemap (Tennekes Reference Tennekes2023), treemapify (Wilkins Reference Wilkins2023) and tidyverse (Wickham et al. Reference Wickham, Averick, Bryan, Chang, McGowan and François2019).
Results
Summary of the database
Among the 1,777 unique sampling events, ingestion was the most frequently recorded interaction type (Figure 1). Seabird species were the most recorded taxa (Figure 1A), with a strong marine bias also reflected in the dominant orders (Figure 1B), habitats (Figure 1C), trophic niches (Figure 1D), and primary lifestyles (Figure 1E; Supplementary material Tables S2–S4). Litter mass was reported in 31% of ingestion sampling events and in 16% of litter use as nesting material sampling events, while litter count was more common (ingestion: 43%; litter use as nesting material: 19%; Figure 1F). For sampling events reporting ingestion and use of litter as nesting material, there were strong positive correlations among each of the three litter measures (litter mass, litter count and frequency of occurrence; Supplementary material Figures S2–S3 and Table S5).
Summary of the database created from the systematic literature review and AVONET: Global traits database (Tobias et al. 2022), depicting the number of sampling events (in brackets), across all interaction types for the ten most-represented species (A) and orders (B); the three most-represented habitats (C), trophic niches (D), and primary lifestyles (E); and the reported data per interaction type (F). For more details, see Tables S1–S3. All silhouettes obtained from https://www.phylopic.org/, with the following attributions: Ardenna carneipes created by Juan Carlos Jerí, Larus argentatus, Larus michahellis, Rissa tridactyla, Charadriiformes, Passeriformes, Anseriformes and Acciptriformes created by Andy Wilson, Ardenna pacifica and Ardenna gravis created by Edwin Price, and Gulosus aristotelis, and Sphenisciformes created by Alexandre Vong (https://creativecommons.org/publicdomain/zero/1.0/); Sula leucogaster and Suliformes created by T. Michael Keesey (vectorization) and Larry Loos (photography) (https://creativecommons.org/licenses/by/3.0/); Morus bassanus created by Mmo iwdg, Pelecaniformes created by L. Shyamal, and Fulmarus glacialis and Procellariiformes created by Bennet McComish, photo by Avenue (https://creativecommons.org/licenses/by-sa/3.0/).

Figure 1 Long description
A. A treemap depicting the ten-most represented species in the database. The size of each box reflects the number of records for each species, the number is in parentheses. Each species is represented by their scientific name and a silhouette.
B. A treemap depicting the ten-most represented taxonomic orders in the database. The size of each box reflects the number of records for each order with numbers in parentheses. Each order is represented by scientific name and a silhouette of a species.
C. A treemap depicting the three most-represented habitat types in the database. The size of each box reflects the number of records for each habitat, and the number is in parentheses.
D. A treemap depicting the three most-represented trophic niche types in the database. The size of each box reflects the number of records for each trophic niche, and the number is in parentheses.
E. A treemap depicting the three most-represented primary lifestyle types in the database. The size of each box reflects the number of records for each primary lifestyle, and the number is in parentheses.
F. A table summarising the number of sampling events, the number of sampling events with evidence of interaction, and percentages of studies reporting litter mass and litter count for ingestion, entanglement and use as nesting material.
Sample method
Multiple sample methods were used in ingestion and nesting material studies, but not for entanglement (Figure 2 and 3). In ingestion studies, non-invasive pellet collection was the most common method where applicable, although carcass examination predominated for most species (Figure 4). Comparisons among ingestion sample methods showed little evidence of differences in frequencies of occurrence; however, litter mass was lower in carcass samples (median = 0.07 g; IQR = 0.01–0.30 g) than in pellet (0.44 g; 0.22–1.13 g; P = < 0.0001) and regurgitate samples (0.32 g; 0.04–2.67 g; P = 0.001), while faecal samples had lower litter counts (1.07 pieces; 0.49–2.33 pieces) than pellets (4.60 pieces; 2.01–10.22 pieces; P = 0.025) and regurgitates (3.88 pieces; 1.17–16.95 pieces; P = 0.026; Figure 2; Supplementary material Tables S6–S8).
Violin plots depicting variation across sample methods in ingestion related litter measures (A) frequency of ingestion (%), (B) mean litter mass (gram), and (C) mean litter count. Dotted lines depict group-level median. Only post-hoc pairwise comparisons with p-value < 0.05 are shown, depicted by a and b, with groups sharing letters showing little to no evidence of differences.
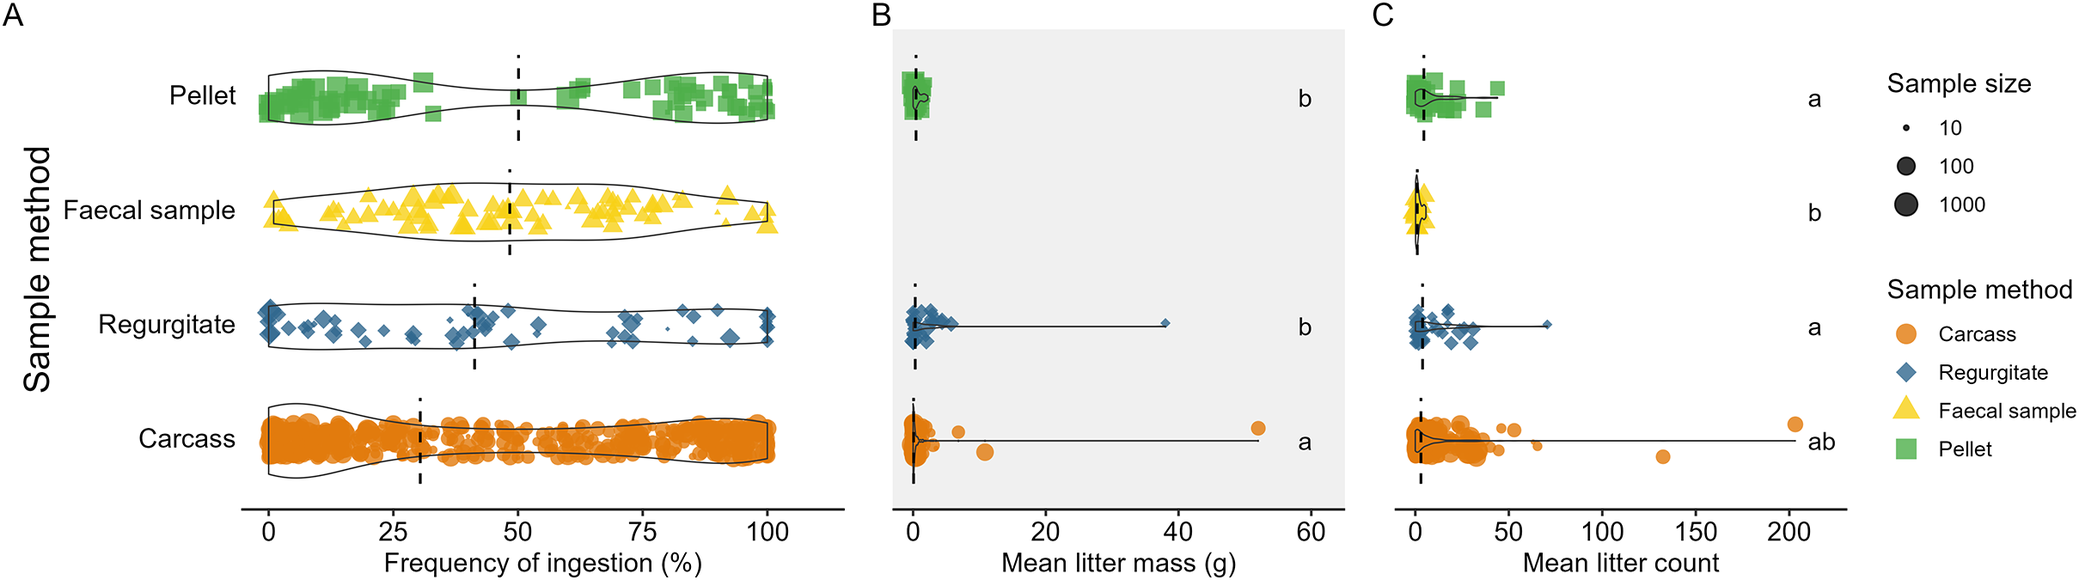
Figure 2 Long description
A. A violin plot depicting the frequency of ingestion (in percentage) grouped by sample method. Colour and shape reflect sample method. Dotted line shows the median. The x-axis ranges from 0-100.
B. A violin plot depicting the mean litter mass ingested (in grams) grouped by sample method. Colour and shape reflect sample method. Size reflects sample size. Dotted line shows the median. X-axis ranges from 0-60.
C. A violin plot depicting the mean litter count ingested grouped by sample method. Colour and shape reflect sample method. Size reflects sample size. Dotted line shows the median. X-axis ranges from 0-200.
Violin plots depicting variation across sample methods in use of litter as nesting material related litter measures (A) frequency of use as nesting material (%), (B) mean litter mass (gram), and (C) mean litter count. Dotted lines depict group-level median. Only post-hoc pairwise comparisons with p-value < 0.05 are shown, depicted by a and b, with groups sharing letters showing little to no evidence of differences.
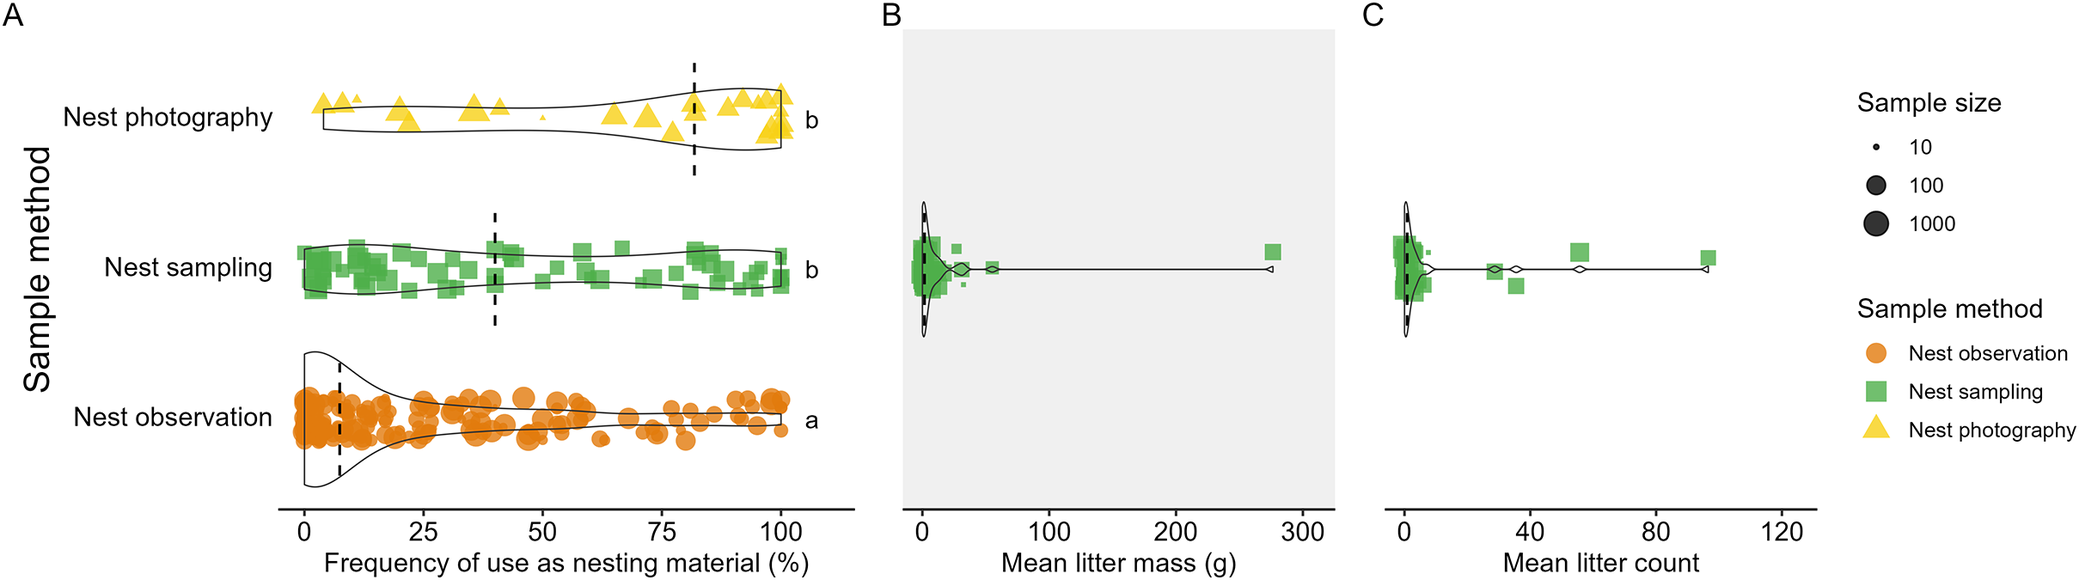
Figure 3 Long description
A. A violin plot depicting the frequency of use as nesting material (in percentage) grouped by sample method. Colour and shape is specific to sample method. The dotted line shows the median, and the x-axis ranges from 0-100.
B. A violin plot depicting the mean litter mass used in nest (in grams) grouped by sample method. Colour and shape reflect sample method. Size reflects sample size. Dotted line shows the median. X-axis ranges from 0-300.
C. A violin plot depicting the mean litter count used in nest grouped by sample method. Colour and shape reflect sample method. Size reflects sample size. Dotted line shows the median. X-axis ranges from 0-120.
Violin plots depicting variation across individual species in ingestion related litter measures (A) frequency of ingestion (%), (B) mean litter mass (gram), and (C) mean litter count, where only 13 species had sufficient data for analyses to be conducted. Dotted lines depict group-level median. Only post-hoc pairwise comparisons with p-value < 0.05 are shown, depicted by a, b, c, d, and e, with groups sharing letters showing little to no evidence of difference.
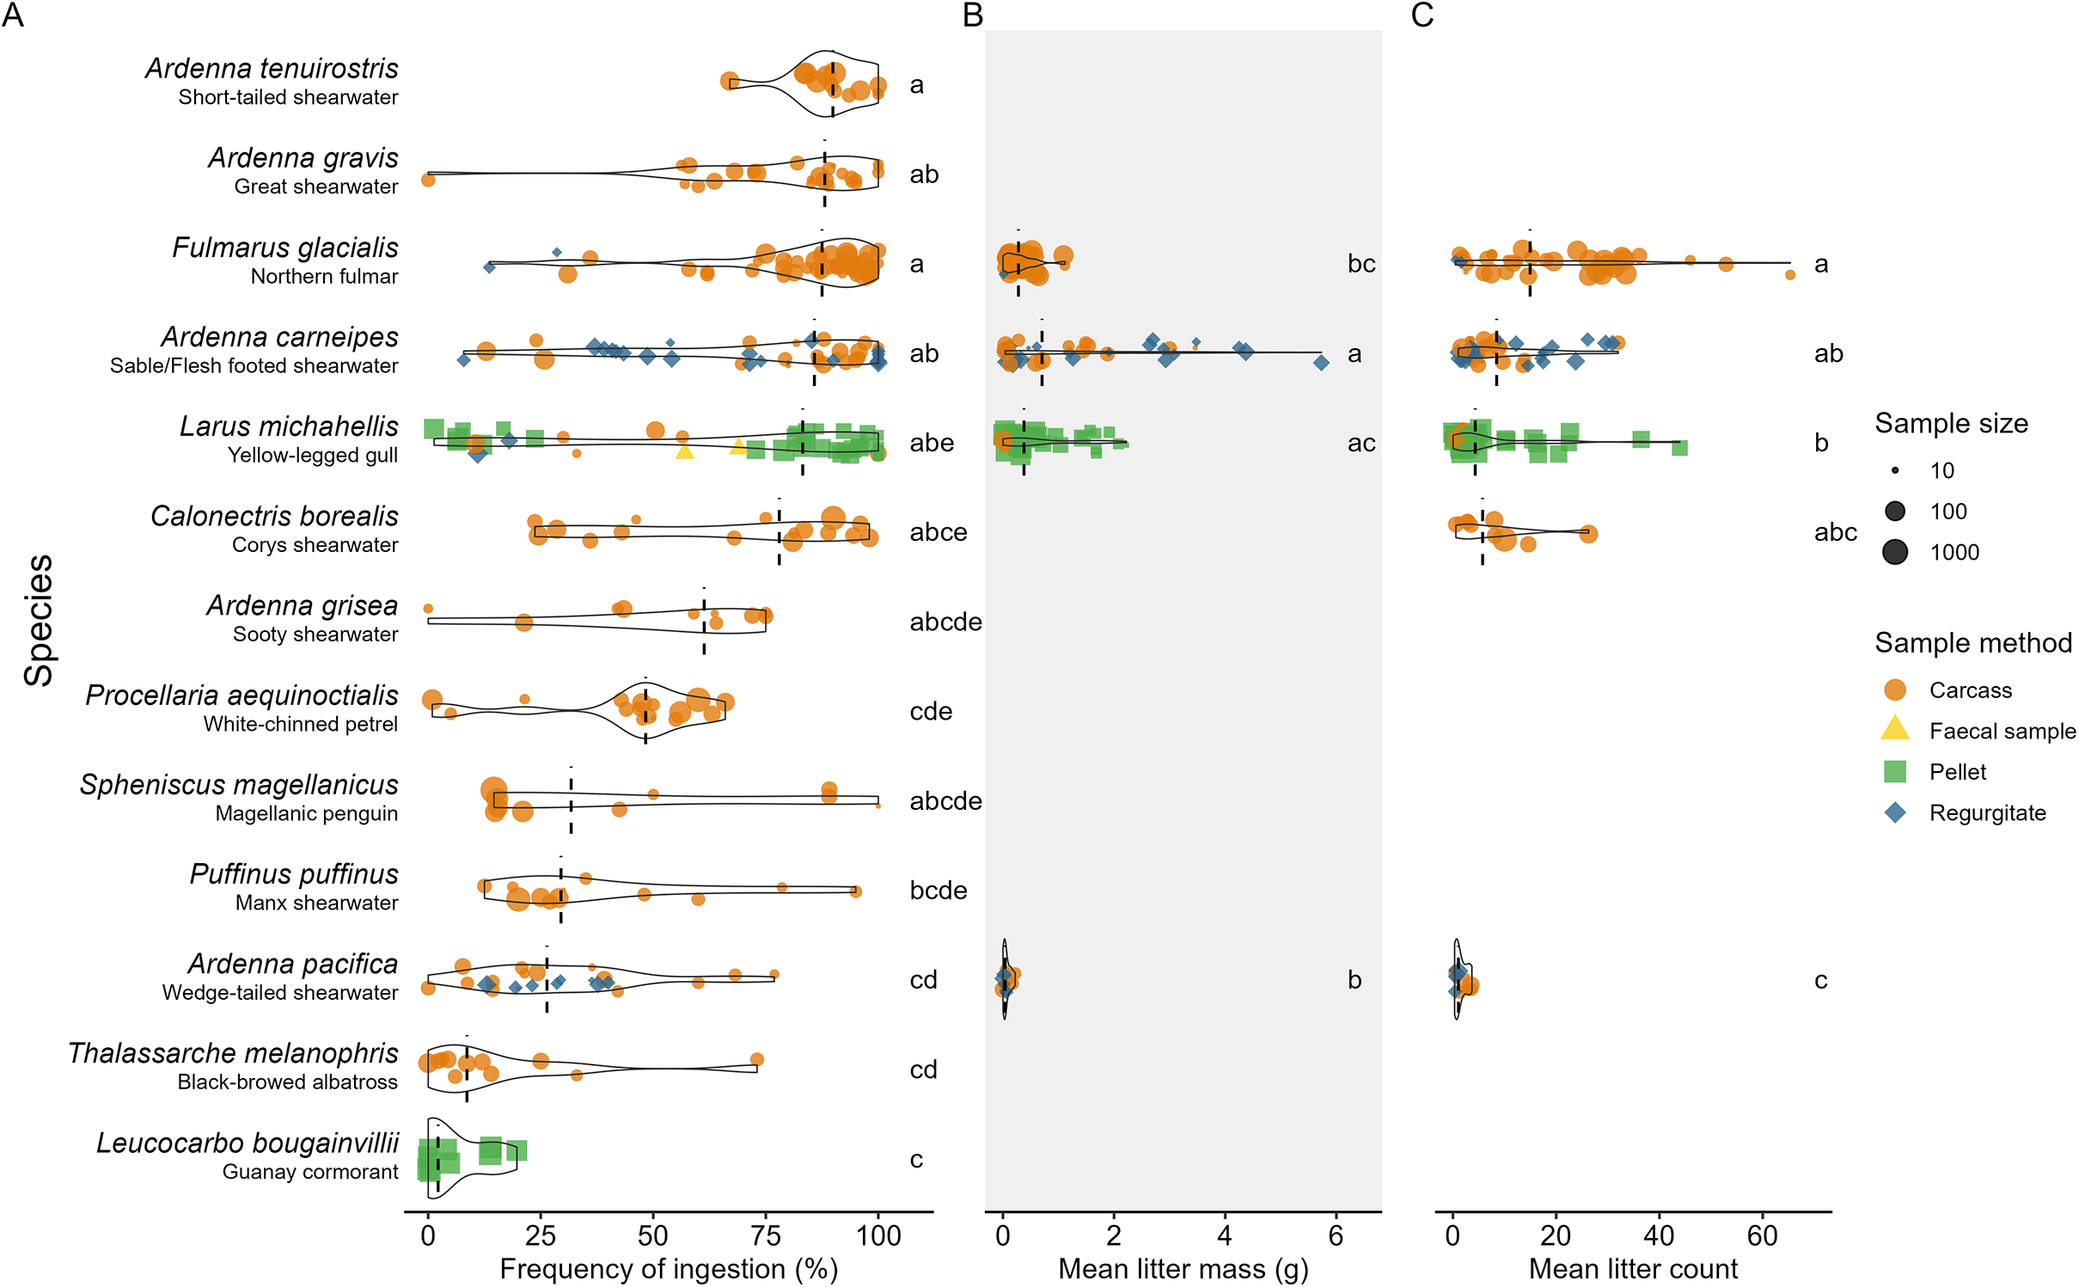
Figure 4 Long description
A. A violin plot depicting the frequency of ingestion (in percentage) grouped by species. Colour and shape is specific to sample method. The dotted line shows the median, and the x-axis ranges from 0-100.
B. A violin plot depicting the mean litter mass ingested (in grams) grouped by species. Colour and shape reflect sample method. Size reflects sample size. Dotted line shows the median. X-axis ranges from 0-6.
C. A violin plot depicting the mean litter count ingested grouped by species. Colour and shape reflect sample method. Size reflects sample size. Dotted line shows the median. X-axis ranges from 0-60.
For litter use as nesting material, there was strong evidence of a lower frequency of occurrence for nest observation (7%; 0–33%) compared with nest sampling (40%; 12–84%; P < 0.0001) and nest photography (82%; 40–97%; P < 0.0001; Figure 3; Supplementary material Tables S6, S7 and S9).
Taxonomy
Amongst 394 species recorded in ingestion studies, only 13 had ≥10 sampling events with a sample size of ≥10 (Figure 4; Supplementary material Table S2). Most of these 13 species showed high variability in litter measures among sampling events, with frequency of ingestion spanning the full range from 0–100%. All three litter measures (frequency of ingestion, litter mass, and litter count) differed strongly among species (χ2 = 115.7, 30.1, and 40.0 respectively; all P < 0.0001; Supplementary material Table S7).
There was clear evidence that frequencies of ingestion were higher for the Short-tailed Shearwater Ardenna tenuirostris (90%; 85–95%) and the Northern Fulmar (88%; 79–95%) than the Wedge-tailed Shearwater Ardenna pacifica (26%; 18–39%), Black-browed Albatross Thalassarche melanophris (9%; 4–20%), and Guanay Cormorant Leucocarbo bougainvillii (2%; 0–12%; Supplementary material Tables S6 and S8). Moderate evidence suggested that the Northern Fulmar had a lower litter mass than the Sable/Flesh-footed Shearwater Ardenna carneipes (0.28 g; 0.09–0.37 g cf. 0.70 g; 0.16–2.67 g; P = 0.0067), although this is likely influenced by the different sample methods used. At the order-level, Procellariiformes showed higher values for frequency of ingestion (60%; 25–87%) and litter count (4.96 pieces; 1.31–12.60 pieces) than most orders (Supplementary material Figure S4 and Table S6 and S8).
Entanglement was recorded in 57 species across nine orders, with the Northern Gannet Morus bassanus most frequently recorded (Table S3). Owing to limited data (n = 92; Figure 1F), species-level analysis of entanglement frequency was not conducted. Order-level comparisons were restricted to Charadriiformes and Suliformes, with no evidence of differences in entanglement frequency (χ2 = 0.88, P = 0.35; Supplementary material Figure S5 and Table S7).
For litter use as nesting material, 11 (including an unknown gull species) out of 91 species had ≥10 sampling events with a sample size of ≥10 (Figure 5; Supplementary material Table S4). Although frequencies were again highly variable, there was moderate evidence that the Northern Gannet (65%; 25–92%) had a higher frequency of litter use than the European Shag Gulosus aristotelis (9%; 4–19%; P = 0.0026) and the Black-legged Kittiwake Rissa tridactyla (0%; 0–3%; P < 0.0001; Supplementary material Tables S6 and S9). There was strong evidence that the Brown Booby Sula leucogaster incorporated a greater mass of litter than the Kelp Gull Larus dominicanus (4.50 g; 1.00–10.20 g cf. 0.65; 0.35–0.78 g; P = 0.0026), despite no evidence of differences in frequency of litter use as nesting material and litter count (Figure 5; Supplementary material Table S9).
Violin plots depicting variation across individual species in use of litter as nesting material related litter measures (A) frequency of use as nesting material (%), (B) mean litter mass (gram), and (C) mean litter count, where 11 species had sufficient data for analyses to be conducted. Dotted lines depict group-level median. Only post-hoc pairwise comparisons with p-value < 0.05 are shown, depicted by a, b, and c, with groups sharing letters showing little to no evidence of difference.

Figure 5 Long description
A. A violin plot depicting the frequency of use as nesting material (in percentage) grouped by species. Colour and shape is specific to sample method. The dotted line shows the median, and the x-axis ranges from 0-100.
B. A violin plot depicting the mean litter mass used in nest (in grams) grouped by species. Colour and shape reflect sample method. Size reflects sample size. Dotted line shows the median. X-axis ranges from 0-60.
C. A violin plot depicting the mean litter count used in nest grouped by species. Colour and shape reflect sample method. Size reflects sample size. Dotted line shows the median. X-axis ranges from 0-6.
Among orders, Passeriformes incorporated litter into nests more frequently (82%; 51–96%) than Suliformes (19%; 4–59%; P = 0.002), Charadriiformes (7%; 0–35%; P < 0.0001) and Anseriformes (0%; 0–9%; P < 0.0001; Supplementary material Figure S6 and Table S6 and S9). Further to this, Suliformes incorporated fewer litter items compared to Charadriiformes (0.20 pieces; 0.10–1.45 pieces cf. 1.30; 0.85–2.39 pieces; P = 0.035) but a greater litter mass (5.33 g; 1.00–11.91 g cf. 0.70 g; 0.43–1.45 g; P = 0.0085).
Avian functional traits
Avian functional traits explained differences in litter measures to varying degrees, although patterns were constrained by a strong marine bias. Clear habitat-related patterns were identified for ingestion (Figure 6), but not for entanglement (Supplementary material Figure S5) or use of litter as nesting material (Supplementary material Figure S6). Coastal birds (57%; 21–87%) ingested litter more frequently than marine (37%; 8–79%; P = 0.04) and wetland birds (13%; 4–61%; P = 0.0005; Supplementary material Tables S6 and S8). Wetland birds tended to ingest fewer litter pieces (0.18 pieces; 0.06–2.47 pieces) than both coastal (3.05 pieces; 1.30–6.60 pieces; P = 0.01) and marine birds (3.42 pieces; 0.98–9.85 pieces; P = 0.001), while coastal birds also ingested a lower litter mass than marine birds (0.32 g; 0.10–0.72 g cf. 0.12 g; 0.02–0.46 g; P = 0.02).
Violin plots depicting variation across habitats in ingestion related litter measures (A) frequency of ingestion (%), (B) mean litter mass (gram), and (C) mean litter count. Dotted lines depict group-level median. Only post-hoc pairwise comparisons with p-value < 0.05 are shown, depicted by a and b, with groups sharing letters showing little to no evidence of difference.

Figure 6 Long description
A. A violin plot depicting the frequency of ingestion (in percentage) grouped by habitat type. Colour and shape is specific to sample method. The dotted line shows the median, and the x-axis ranges from 0-100.
B. A violin plot depicting the mean litter mass ingested (in grams) grouped by habitat type. Colour and shape reflect sample method. Size reflects sample size. Dotted line shows the median. X-axis ranges from 0-60.
C. A violin plot depicting the mean litter count ingested grouped by habitat type. Colour and shape reflect sample method. Size reflects sample size. Dotted line shows the median. X-axis ranges from 0-200.
Among trophic niches, data were heavily skewed towards aquatic predators, limiting analysis for ingestion (Supplementary material Figure S4) and entanglement (Supplementary material Figure S5), though moderate evidence suggested that aquatic predators incorporated a greater mass of litter in nests than omnivores (3.97 g; 0.82–12.33 g cf. 0.70 g; 0.45–1.35 g; P = 0.03; Supplementary material Figure S6 and Tables S6 and S9).
Among primary lifestyles, frequency of ingestion was lower for birds with a predominantly aquatic lifestyle (20%; 3–72%) than those with aerial (48%; 9–86%; P = 0.0009) and generalist primary lifestyles (44%; 19–81%; P = 0.0001; Supplementary material Figure S4 and Tables S6 and S8). Similarly, moderate evidence suggested lower entanglement frequencies for birds with aquatic lifestyles than generalists (1%; 0–1% cf. 5%; 2–7%; P = 0.04; Supplementary material Figure S5 and Tables S6 and S10). Insessorial birds incorporated litter into nests (80%; 68–92%) more frequently than all other primary lifestyles (Supplementary material Figure S6 and Tables S6 and S9).
For litter ingestion, bird body mass was positively correlated with litter mass (ρ = 0.30, P = 0.014), with no strong evidence of a relationship with frequency of ingestion or litter count (Supplementary material Figure S7 and Table S5). For litter use as nesting material, bird body mass was positively correlated with frequency of occurrence (ρ = 0.31, P < 0.0001) and litter mass (ρ = 0.49, P = 0.0031), with no clear relationship with litter count (Supplementary material Figure S8 and Table S5).
Latitude
Latitudinal patterns were scarce for both ingestion (Supplementary material Figures S9 and S10, and Table S5) and use of litter as nesting material (Supplementary material Figures S11 and S12 and Table S5). The Yellow-legged Gull Larus michahellis showed positive latitudinal correlations with frequency of ingestion (ρ = 0.72, P < 0.0001) and mean litter mass (ρ = 0.62, P < 0.0001) across 30°N–43°N. The Sable/Flesh-footed Shearwater showed negative correlations between mean litter mass (ρ = -0.4, P = 0.01) and mean litter count (ρ = -0.36, P = 0.03) with increasing latitude; however, the latitudinal range was smaller (31°S–35°S). There was also evidence of a positive correlation between litter count and latitude for the Wedge-tailed Shearwater (ρ = 0.75, P = 0.005). For litter use as nesting material, only the Common Eider Somateria mollissima and the Great Black-backed Gull Larus marinus showed evidence of a relationship, both negatively correlated with increasing latitude (Common Eider, ρ = -0.69, P = 0.03; Great Black-backed Gull, ρ = -0.78, P = 0.007).
Discussion
Bird–litter interactions are a global environmental problem and have been widely documented in the literature, yet, despite its significance, quantitative syntheses across multiple studies remain limited (Kühn and van Franeker Reference Kühn and van Franeker2020; O’Hanlon et al. Reference O’Hanlon, James, Masden and Bond2017). We quantitatively reviewed the literature to examine the influence of sample method, taxonomy, avian functional traits, and latitude on bird–litter interactions. While some patterns emerged, variation in sample method and data reporting, together with imbalanced research effort, constrained analysis, as noted previously (Kühn and van Franeker Reference Kühn and van Franeker2020; Mansfield et al. Reference Mansfield, Reynolds, Lynch, Matthews and Sadler2024; Provencher et al. Reference Provencher, Bond, Avery-Gomm, Borrelle, Rebolledo and Hammer2017). Research effort was heavily biased towards seabirds, highlighting a continued paucity of terrestrial-focused studies, despite the geographically widespread threat of anthropogenic litter (Blettler et al. Reference Blettler, Abrial, Khan, Sivri and Espinola2018; Jagiello et al. Reference Jagiello, Dylewski, Tobolka and Aguirre2019; Mansfield et al. Reference Mansfield, Reynolds, Lynch, Matthews and Sadler2024; Ryan Reference Ryan2018). The generally opportunistic nature of bird–litter research (Lavers et al. Reference Lavers, Hutton and Bond2021; O’Hanlon et al. 2017, 2021) was reflected in the range of sample sizes and methods. Below, we discuss our findings for ingestion, entanglement, and use of litter as nesting material, emphasising the need to use multiple litter measures and for greater adoption of sample method and data reporting standardisation.
Interaction types
Ingestion was the most common bird–litter interaction type studied, followed by use of litter as nesting material, then entanglement. The lower representation of litter use as nesting material studies likely reflects nest accessibility, with monitoring biased towards colonial seabirds (Grant et al. Reference Grant, Lavers, Stuckenbrock, Sharp and Bond2018; O’Hanlon et al. Reference O’Hanlon, Bond, Masden, Lavers and James2021) and species using nestboxes (Jagiello et al. Reference Jagiello, Corsini, Dylewski, Ibáñez-Alamo and Szulkin2022). Entanglement studies were scarce, likely due to the difficulty of obtaining randomised and comparable samples, as most observed entanglements are isolated events and often reported as case studies (Kühn and van Franeker Reference Kühn and van Franeker2020). Consistent with this, reporting of litter measures for entanglement was limited, highlighting a need for more standardised reporting of litter measures in entanglement studies to enhance cross-study synthesis.
Bird entanglement records are largely dominated by fishing-related litter, reflecting the high risk posed by threadlike shapes such as lines and netting (Bond et al. Reference Bond, Montevecchi, Guse, Regular, Garthe and Rail2012; Costa et al. Reference Costa, Sá, Pereira, Angelo, Vaqueiro and Ferreira2020; Ryan Reference Ryan2018; Timmiss et al. Reference Timmiss, Mo, Jamieson, Wilson, Haering and Sriram2026). However, non-fishing sources also represent a substantial risk, given the prevalence of threadlike litter in human-modified environments such as agricultural and landfill areas (Heinze et al. Reference Heinze, Acácio, Franco and Catry2025; Restani Reference Restani2023; Ryan Reference Ryan2018; Townsend and Barker Reference Townsend and Barker2014). Entanglement may also occur following litter incorporation in nests. For example, Restani (Reference Restani2023) and Townsend and Barker (Reference Townsend and Barker2014) observed that synthetic rope, string, and twine incorporated into Osprey Pandion haliaetus and American Crow Corvus brachyrhynchos nests caused nestling entanglement. Continued research to understand the link between certain shapes and types of litter (i.e. threadlike plastics) and interactions (Heinze et al. Reference Heinze, Acácio, Franco and Catry2025) would help identify risk reduction and mitigation measures (e.g. targeted recovery of fishing line through initiatives such as Oceanwatch Australia’s TAngler bins https://www.oceanwatch.org.au/tangler-bins/).
Litter measures
Reporting of litter mass and litter count was highly variable, resulting in fewer analyses than for data on frequency of occurrence. Although frequency of occurrence is the most commonly used litter measure in bird–litter research, it provides limited biological or ecological insight compared to litter mass and count (Bond and Lavers Reference Bond and Lavers2023; Provencher et al. Reference Provencher, Bond, Avery-Gomm, Borrelle, Rebolledo and Hammer2017). For example, Roman et al. (Reference Roman, Hardesty, Hindell and Wilcox2019b) reported a low ingestion frequency (16.7%) for the Light-mantled Sooty Shearwater Phoebetria palpebrata, yet mortality resulted from ingestion of a single balloon, demonstrating that minimal loads can have severe consequences. Similarly, Townsend and Barker (Reference Townsend and Barker2014) found that although only 5.6% of American Crow nestlings were entangled, all entangled nestlings failed to fledge, with substantial implications for breeding success. These examples highlight that low frequencies do not equate to lower risk and underscore the importance of considering litter characteristics (e.g. type, shape, and size), which were not assessed in this review.
Sample method
Sample method variably influenced litter measures relating to ingestion and use of litter as nesting material, indicating that results should be compared cautiously across sample methods and not be treated as equal (Lavers et al. Reference Lavers, Hutton and Bond2021; Provencher et al. Reference Provencher, Bond, Avery-Gomm, Borrelle, Rebolledo and Hammer2017; Schutten et al. Reference Schutten, Chandrashekar, Weseloh, Parmley, Stevens and Jardine2024b). Ingestion research is dominated by carcass samples, but, pellets, faecal samples, and regurgitates are often used when carcasses are unavailable (Provencher et al. Reference Provencher, Bond, Avery-Gomm, Borrelle, Rebolledo and Hammer2017). However, there are limitations to these alternatives. Pellets are only produced by specific species, such as storks and gulls (Bjedov et al. Reference Bjedov, Mikuska, Gvozdic, Glavas, Gradecak and Bogojevic2024; Stewart et al. Reference Stewart, Lavers, Grant, Puskic and Bond2020) and provide a limited representation of what was ingested (Provencher et al. Reference Provencher, Borrelle, Bond, Lavers, van Franeker and Kühn2019). Faecal samples may be confounded by the presence of both recently ingested litter and litter retained in the gut (Provencher et al. Reference Provencher, Vermaire, Avery-Gomm, Braune and Mallory2018). Regurgitates provide a similarly limited snapshot, in that lavage only empties the contents of the proventriculus (Lavers et al. Reference Lavers, Hutton and Bond2021), and may not represent the full litter load (Kühn and van Franeker Reference Kühn and van Franeker2020).
Similarly, sample method appeared to explain some difference in the frequency of litter incorporation in nests. While nest access often dictates the sample method used, invasive approaches such as nest sampling are more effective at detecting debris than direct observation and nest photography (da Costa et al. Reference da Costa, Nascimento, Esmaeili and Mancini2022; Henderson et al. Reference Henderson, Grant and Lavers2022; Schutten et al. Reference Schutten, Chandrashekar, Weseloh, Parmley, Stevens and Jardine2024b).
Despite extensive bird–litter research, high variability in sample methods and sample sizes limits cross-study comparability, reflecting the largely opportunistic nature of this research and reinforcing the need for greater methodological and reporting standardisation (Mansfield et al. Reference Mansfield, Reynolds, Lynch, Matthews and Sadler2024). Although the use of multiple sample methods is often unavoidable, increased application of non-invasive techniques would be beneficial, particularly for studying litter loads in live birds (Kühn and van Franeker Reference Kühn and van Franeker2020) and minimising disturbance to threatened taxa (Garcia-Cegarra et al. Reference Garcia-Cegarra, Ramirez and Orrego2020). Building on existing best-practice guidelines for ingestion studies (see Provencher et al. Reference Provencher, Bond, Avery-Gomm, Borrelle, Rebolledo and Hammer2017, Reference Provencher, Borrelle, Bond, Lavers, van Franeker and Kühn2019), which research on entanglement and litter use as nesting material would benefit from, would allow for clearer quantification of differences among sample methods, as our results support the conclusion that methods are not equivalent (Schutten et al. Reference Schutten, Chandrashekar, Weseloh, Parmley, Stevens and Jardine2024b).
Taxonomy
Taxonomic patterns among litter measures provide useful ecological insight and may support inference for data-deficient species through phylogenetic relatedness. Consistent with previous studies, ingestion frequency varied among taxa, with Procellariiformes exhibiting higher frequency of ingestion and greater litter mass than Charadriiformes, similar to the findings of Kühn and van Franeker (Reference Kühn and van Franeker2020). At the species-level, however, the Northern Fulmar had a lower litter mass than the Sable/Flesh-footed Shearwater despite similar litter counts, a difference that appears to reflect sample method rather than ecological drivers. This finding reinforces caution against assuming methodological equivalence in bird–litter interaction data (Schutten et al. Reference Schutten, Chandrashekar, Weseloh, Parmley, Stevens and Jardine2024b).
There was limited ability to analyse patterns in entanglement data, however the Northern Gannet was the most recorded species, and Charadriiformes and Suliformes the most common orders. The Northern Gannet is well known to get entangled when diving into the water in pursuit of prey (Costa et al. Reference Costa, Sá, Pereira, Angelo, Vaqueiro and Ferreira2020; Rodríguez et al. Reference Rodríguez, Bécares, Rodríguez and Arcos2013), and as a result of their incorporation of litter into nests (Bond et al. Reference Bond, Montevecchi, Guse, Regular, Garthe and Rail2012). Additionally, Charadriiformes and Suliformes encompass a large number of seabird species that are likely to come into contact with fishing gear (Ryan Reference Ryan2018).
Passeriformes, which are predominantly terrestrial bird species, incorporated litter into nests more frequently than Suliformes and Charadriiformes, consistent with findings that terrestrial bird species have a higher probability of litter incorporation in nests compared to marine birds (Jagiello et al. Reference Jagiello, Dylewski, Tobolka and Aguirre2019). This highlights that despite the strong marine bias evident in the literature, terrestrial bird species are also substantially impacted by anthropogenic litter and warrant greater research attention.
Species-specific nest characteristics such as shape, location, material, and building technique (Hansell Reference Hansell2000) are likely to influence both the type and quantity of litter incorporated into nests (Jagiello et al. Reference Jagiello, Reynolds, Nagy, Mainwaring and Ibáñez-Alamo2023). For example, although the Brown Booby and Kelp Gull had similar frequencies of litter incorporation and litter counts, the Brown Booby incorporated a greater overall litter mass, potentially reflecting differences in nest structure or placement, as open-area nests have been shown to contain more litter than those in well-vegetated areas (Lavers et al. Reference Lavers, Hodgson and Clarke2013; Witteveen et al. Reference Witteveen, Brown and Ryan2017). Additionally, the Black-legged Kittiwake showed lower frequencies of litter incorporation in nests compared to the Northern Gannet, however other factors relating to the availability of natural and artificial nesting materials in surrounding areas (Bond et al. Reference Bond, Montevecchi, Guse, Regular, Garthe and Rail2012; Hammouda et al. Reference Hammouda, Ben Youssef, McCoy and Selmi2025; Hartwig et al. Reference Hartwig, Clemens and Heckroth2007), preferences for certain litter colours, sizes, and types (Espinoza et al. Reference Espinoza, Laviada, Cerezo, Luna, Gil-Delgado and Bernat-Ponce2024; Verlis et al. Reference Verlis, Campbell and Wilson2014), and accumulation of litter due to reuse of nests (Votier et al. Reference Votier, Archibald, Morgan and Morgan2011) should be considered.
Avian functional traits
We found avian functional traits provided further insights into bird–litter interactions. Habitat partially explained variation in ingestion, with wetland birds ingesting litter less frequently than coastal birds, and fewer pieces than both coastal and marine birds. While this trend could reflect higher litter prevalence in coastal and marine environments, which act as major sinks for anthropogenic debris (Rochman Reference Rochman2018), this neglects the role of terrestrial and freshwater environments as sources of marine litter (Jambeck et al. Reference Jambeck, Geyer, Wilcox, Siegler, Perryman and Andrady2015).
The predominance of aquatic predators hampered analysis of variation among trophic niches and interaction types, with few clear patterns emerging. However, the role that feeding ecology and foraging behaviours may play in mediating the risks posed by litter is important, as Jagiello et al. (Reference Jagiello, Dylewski, Tobolka and Aguirre2019) found that as much as 20% of litter in nests was related to litter that was mistakenly identified as food (e.g. Steen et al. Reference Steen, Torjussen, Jones, Tsimpidis and Miliou2016) or from regurgitation for species that have this ability (Bjedov et al. Reference Bjedov, Mikuska, Gvozdic, Glavas, Gradecak and Bogojevic2024; Stewart et al. Reference Stewart, Lavers, Grant, Puskic and Bond2020), and Roman et al. (Reference Roman, Bell, Wilcox, Hardesty and Hindell2019a) found that seabirds which surface seize, dive, or filter were at the highest risk of ingestion.
Analysis of primary lifestyles revealed that generalist species, such as the Yellow-legged Gull, more frequently ingested and were entangled in litter compared to aquatic species, such as the Guanay Cormorant. This is consistent with previous findings that suggest generalist bird species encounter and ingest more plastic than specialists due to their broader habitat use (Caldwell et al. Reference Caldwell, Seavey and Craig2020), and that species such as the Yellow-legged Gull ingest more plastic when it is more locally available (Oliveira et al. Reference Oliveira, Navarro, Garcia-Garin, Ramírez, Montalvo and Martín-Vélez2026). However, as our dataset was dominated by seabird species, further research is needed to determine whether these patterns hold for other bird species, as well as what drives differences in bird–litter interactions among primary lifestyles, such as the appearance of litter (Henry et al. Reference Henry, Wey and Balança2011) or whether ingestion is direct or indirect (i.e. through ingestion of prey that contains litter) (Perold et al. Reference Perold, Connan, Suaria, Weideman, Dilley and Ryan2024).
Birds with a larger body mass more frequently incorporated litter into nests, and a greater mass of litter was ingested and incorporated into nests. There is a lack of clear consensus about the relationship between bird body size and interactions such as ingestion in the literature. For example, while Bond and Lavers (Reference Bond and Lavers2023) found that larger birds tended to ingest more pieces of litter than smaller birds and Wilcox et al. (Reference Wilcox, Van Sebille and Hardesty2015) found that rates of ingestion increased with body size, Codina-García et al. (Reference Codina-García, Militao, Moreno and González-Solís2013), Cousin et al. (Reference Cousin, Auman, Alderman and Virtue2015) and Sheard et al. (Reference Sheard, Stott, Street, Healy, Sugasawa and Lala2024) found no correlation between body size and plastic ingestion. These confounding results highlight the need for more research into the influence of bird body size on bird–litter interactions, and may suggest that other factors such as the individual variation that exists between sampling events (Ryan Reference Ryan1987) and geographic litter availability could have more influence.
Latitude
Latitudinal patterns were scarce and only apparent in five species, the Yellow-legged Gull, the Sable/Flesh-footed Shearwater, the Wedge-tailed Shearwater for ingestion-related litter measures, and the Common Eider and the Great Black-backed Gull for litter use as nesting material. While these patterns may relate to urban gradients (Lopes et al. Reference Lopes, Paiva, Vaz, de Faria, Calado, Pereira and Ramos2021) or seabird migratory patterns resulting in differing levels of litter exposure (Terepocki et al. Reference Terepocki, Brush, Kleine, Shugart and Hodum2017), the lack of latitudinal patterns is likely due to the existence of other variables having a greater influence, such as human footprint index (Jagiello et al. Reference Jagiello, López-García, Aguirre and Dylewski2020), proximity to higher levels of human presence (Jagiello et al. Reference Jagiello, Corsini, Dylewski, Ibáñez-Alamo and Szulkin2022), and geographic variation in litter composition (van Franeker et al. Reference van Franeker, Jensen, Simonsen, Rebolledo and Kühn2022). Investigation of these factors would provide greater insights into exposure and risk as compared with latitude, especially for non-seabird species.
Limitations of the review and recommendations for future research
This review provides a foundation for applying quantitative analysis to investigate the influence of sample method, taxonomy, avian functional traits, and latitude in shaping a bird’s likelihood of interacting with litter. The scope of this review was restricted to ingestion, entanglement, and use of litter as nesting material, despite the existence of additional lesser-studied interaction types, such as inhalation (Tokunaga et al. Reference Tokunaga, Okochi, Tani, Niida, Tachibana and Saigawa2023; Wang et al. Reference Wang, Zhou, Dubay, Zhang, Yang and Wang2025), capture and handling (Ayala et al. Reference Ayala, Vizcarra, Castillo-Morales, Torres-Zevallos, Cordero-Maldonado and Ampuero-Merino2023), and use to attract mates (e.g. bowerbirds Ptilonohynchidae; Lavers et al. Reference Lavers, Fidler and Charlton-Howard2025). Further research on bird–litter interactions would benefit from considering the multiple ways birds interact with litter, as well as other important factors that were not evaluated here, such as litter characteristics (colour, shape, size, and type of litter; Mansfield et al. Reference Mansfield, Reynolds, Lynch, Matthews and Sadler2024), bird age (Collard et al. Reference Collard, Benjaminsen, Herzke, Husabo, Sagerup and Tulatz2024), breeding season (Robuck et al. Reference Robuck, Hudak, Agvent, Emery, Ryan and Perold2022), and trophic transfer (Carey Reference Carey2011). Additionally, while we intended to extract the highest data resolution from each study, there were occasions where only a single frequency of occurrence across multiple sites or time periods could be recorded. This may have resulted in under-representation of sampling events for any given study location or year. We found that sample sizes ≥10 were optimal for reducing zero-one inflation for the purposes of comparing medians. However, for more detailed analysis and modelling, using tools such as power analyses to determine appropriate sample sizes, as demonstrated by van Franeker and Mejiboom (Reference van Franeker and Meijboom2000), Provencher et al. (Reference Provencher, Bond and Mallory2015) and Lavers et al. (Reference Lavers, Hutton and Bond2021), would be beneficial. Additionally, if samples are hard to come by, due to the opportunistic nature of bird–litter research, increasing the frequency of sampling temporally may also be of use (Provencher et al. Reference Provencher, Bond and Mallory2015). Finally, increasing standardised reporting of litter measures, as recommended by Provencher et al. (Reference Provencher, Bond, Avery-Gomm, Borrelle, Rebolledo and Hammer2017, Reference Provencher, Borrelle, Bond, Lavers, van Franeker and Kühn2019), would support greater capacity for meta-analysis.
Conclusion
Our quantitative review highlights the importance of sample method, taxonomy, avian functional traits, and latitude in bird–litter interactions globally. However, granular insights were difficult to obtain due to a continued lack of studies in non-marine environments, and large variability in sample sizes and methods. To facilitate greater cross-study consensus in bird–litter research, we recommend that future studies ensure the use of multiple litter measures, standardised methods and data reporting (including greater descriptions of litter characteristics), and consider the influence of ecological and morphological drivers. This is essential for informing the management of anthropogenic litter and reducing negative impacts on bird life across all environments.
Supplementary material
The supplementary material for this article can be found at http://doi.org/10.1017/S0959270926100793.
Data accessibility statement
The dataset and R markdown file with analysis are available via figshare DOI: 10.25955/30759350.
Acknowledgements
We would like to acknowledge the Traditional Custodians of the land on which this research was conducted, the Boon wurrung, Wurundjeri, Woi wurrung, and Wadawurrung peoples, and pay our respects to Elders, past and present. We wish to thank Eliza Thompson and Judi Walters for their support with the review process and edits of the early manuscript. We are grateful to an anonymous reviewer for providing extensive feedback.
Author contribution statement
Hannah Faraone: Conceptualisation; Data curation; Formal analysis; Investigation; Methodology; Validation; Visualisation; Writing – original draft; Writing – review and editing. Nick Schultz: Conceptualisation; Formal analysis; Investigation; Methodology; Supervision; Validation; Visualisation; Writing – review and editing. Jackie Myers: Conceptualisation; Supervision; Writing – review and editing. Kimberley Macdonald: Conceptualisation; Funding acquisition; Supervision; Writing – review and editing. Birgita Hansen: Conceptualisation; Funding acquisition; Investigation; Methodology; Supervision; Writing – review and editing.
Competing interests
Hannah Faraone is supported by an Australian Government Research Training Program (RTP) Fee-off-set Scholarship doi.org/10.82133/C42F-K220, an Australian Government Research Training Program (RTP) Scholarship doi.org/10.82133/C42F-K220, and a stipend scholarship provided by the Department of Energy, Environment, and Climate Action (DEECA), and Federation University. The authors declare no known competing financial interests or personal relationships that could have appeared to influence this review.


 Open access

