INTRODUCTION
A network of pollen records from Holocene lake sediments in the northeastern United States (NE USA) has enabled regional biogeographic analyses of shifting forest taxa through time and space (Davis, Reference Davis, Wright and Porter1983; Jacobson et al., Reference Jacobson, Webb, Grimm, Ruddiman and Wright1987; Prentice et al., Reference Prentice, Bartlein and Webb1991; Oswald et al., Reference Oswald, Foster, Shuman, Doughty, Faison, Hall, Hansen, Lindbladh, Marroquin and Truebe2018; Trachsel et al., Reference Trachsel, Dawson, Paciorek, Williams, McLachlan, Cogbill, Foster, Goring, Jackson and Oswald2020). These regional patterns of vegetation change follow orbital-scale shifts in insolation, as well as millennial-scale changes driven by the waning Laurentide Ice Sheet (LIS) and North Atlantic sea-surface temperatures (SSTs; Webb, Reference Webb1986; Williams et al., Reference Williams, Shuman and Webb2001; Shuman et al., Reference Shuman, Bartlein, Logar, Newby and Webb2002, Reference Shuman, Newby, Huang and Webb2004; Oswald et al., Reference Oswald, Foster, Shuman, Doughty, Faison, Hall, Hansen, Lindbladh, Marroquin and Truebe2018; Fastovich et al., Reference Fastovich, Russell, Marcott and Williams2022). Recent pollen-inferred quantitative climate reconstructions from the NE USA (Marsicek et al., Reference Marsicek, Shuman, Brewer, Foster and Oswald2013; Shuman and Marsicek, Reference Shuman and Marsicek2016) are based upon the development and refinement of the modern analog technique (Overpeck et al., Reference Overpeck, Webb and Prentice1985; Williams and Shuman, Reference Williams and Shuman2008) and modern pollen databases (Whitmore et al., Reference Whitmore, Gajewski, Sawada, Williams, Shuman, Bartlein, Minckley, Viau, Webb and Shafer2005). Much of this prior, foundational work relied on a network of pollen records from southern and coastal New England. This study addresses a lack of Holocene environmental reconstructions from northern, inland locations within the NE USA by developing pollen-inferred vegetation and climate reconstructions for Vermont (VT), USA.
Existing Holocene pollen data from VT show several prominent shifts in vegetation that coincide with orbital and regional climate forcing (Ford, Reference Ford1990; Oswald et al., Reference Oswald, Foster, Shuman, Doughty, Faison, Hall, Hansen, Lindbladh, Marroquin and Truebe2018; Grigg et al., Reference Grigg, Engle, Smith, Shuman and Mandl2021). The first shift occurred during the earliest Holocene (11.7–9.0 cal ka BP) with the transition from Picea- to Pinus-dominated forests following the Younger Dryas cooling event (YD; 12.8–11.5 cal ka BP). This transition in northern forests included a sequence of short-lived mixed boreal forest types (Spear, Reference Spear1989; Ford, Reference Ford1990; Whitehead et al., Reference Whitehead, Charles, Jackson, Smol, Engstrom and Davis1990; Spear et al., Reference Spear, Davis and Shane1994; Oswald et al., Reference Oswald, Foster, Shuman, Doughty, Faison, Hall, Hansen, Lindbladh, Marroquin and Truebe2018; Grigg et al., Reference Grigg, Engle, Smith, Shuman and Mandl2021). Deglacial, no-analog vegetation communities in the Great Lakes have been shown to closely track rapid warming (Fastovich et al., Reference Fastovich, Russell, Jackson and Williams2020a). In the NE USA, transient shifts in moisture source and availability, likely related to fluctuations in North Atlantic SSTs (Kirby et al., Reference Kirby, Mullins, Patterson and Burnett2002a, Reference Kirby, Patterson, Mullins and Burnett2002b), also influenced the development of no-analog assemblages. High percentages of Quercus and Pinus starting at ca. 10.5 cal ka BP indicate the warmest and driest conditions of the Holocene in VT and in other northern records (Spear, Reference Spear1989; Whitehead et al., Reference Whitehead, Charles, Jackson, Smol, Engstrom and Davis1990; Spear et al., Reference Spear, Davis and Shane1994; Grigg et al., Reference Grigg, Engle, Smith, Shuman and Mandl2021). The second shift occurs after 8.5 cal ka BP, when forests became dominated by mesic taxa, including Tsuga canadensis, Fagus grandifolia, and Betula (Ford, Reference Ford1990; Oswald and Foster, Reference Oswald and Foster2011). This change in forest composition correlates with the final collapse of the LIS at ca. 8.2 cal ka BP, which allowed the advection of moisture into the region (Shuman et al., Reference Shuman, Newby, Donnelly, Tarbox and Webb2005, Reference Shuman, Marsicek, Oswald and Foster2019; Shuman and Marsicek, Reference Shuman and Marsicek2016).
Between 5.8 and 3.5 cal ka BP, T. canadensis pollen declined below 10% in VT (Ford, Reference Ford1990; Oswald and Foster, Reference Oswald and Foster2011). The Mid-Holocene T. canadensis decline occurred throughout its range and has drawn scientific interest for decades because of its widespread extent and decadal-scale abruptness at many sites (Davis, Reference Davis, Bharadwaj Vishnu-Mittre and Maheshwari1981; Bennett and Fuller, Reference Bennett and Fuller2002; Calcote, Reference Calcote2003; Booth et al., Reference Booth, Brewer, Blaauw, Minckley and Jackson2012). Insect or pathogen outbreaks may have influenced the pattern of decline (Allison et al., Reference Allison, Moeller and Davis1986; Bhiry and Filion, Reference Bhiry and Filion1996), but the decline coincided with regional changes in both temperature (Calcote, Reference Calcote2003; Muller et al., Reference Muller, Richard, Guiot, de Beaulieu and Fortin2003; Foster et al., Reference Foster, Oswald, Faison, Doughty and Hansen2006; Zhao et al., Reference Zhao, Yu and Zhao2010; Marsicek et al., Reference Marsicek, Shuman, Brewer, Foster and Oswald2013) and moisture availability (Shuman et al., Reference Shuman, Bravo, Kaye, Lynch, Newby and Webb2001; Calcote, Reference Calcote2003; Foster et al., Reference Foster, Oswald, Faison, Doughty and Hansen2006; Zhao et al., Reference Zhao, Yu and Zhao2010; Marsicek et al., Reference Marsicek, Shuman, Brewer, Foster and Oswald2013), suggesting a climate driver. While southern New England (Shuman et al., Reference Shuman, Bravo, Kaye, Lynch, Newby and Webb2001; Marsicek et al., Reference Marsicek, Shuman, Brewer, Foster and Oswald2013; Newby et al., Reference Newby, Shuman, Donnelly, Karnauskas and Marsicek2014) and adjacent portions of Canada experienced prolonged periods of drought (Yu et al., Reference Yu, McAndrews and Eicher1997; Haas and McAndrews, Reference Haas, McAndrews and McManus2000; Lavoie and Richard, Reference Lavoie and Richard2000), an analysis of Holocene paleoclimate records from the NE USA indicates a broad-scale shift toward cooler and more mesic conditions after 5.7 cal ka BP and continuing until the present (Shuman and Marsicek, Reference Shuman and Marsicek2016). VT may follow this large-scale pattern of increased moisture during the Mid-Holocene. Pollen-based moisture reconstructions indicate increased soil moisture in northern New England and increased annual precipitation in Quebec by ca. 5.0 cal ka BP (Webb et al., Reference Webb, Anderson and Webb1993; Muller et al., Reference Muller, Richard, Guiot, de Beaulieu and Fortin2003), and sedimentary evidence indicates high lake levels in the Finger Lakes, NY (Dwyer et al., Reference Dwyer, Mullins and Good1996; Mullins and Halfman, Reference Mullins and Halfman2001) and in New Hampshire (Shuman et al., Reference Shuman, Newby, Donnelly, Tarbox and Webb2005) throughout the Mid-Holocene. However, the Mid-Holocene paleohydrology of VT and the consistency of the moisture changes across the range of T. canadensis remain unclear, because existing paleolimnological data have been interpreted both as an increase (Munroe, Reference Munroe2012) and a decrease in water levels (Ford, Reference Ford1990). The final pre–European settlement shift in vegetation occurred after 2.0 cal ka BP, when Picea pollen increased to >5% throughout the region (Jackson, Reference Jackson1989; Spear, Reference Spear1989; Ford, Reference Ford1990; Whitehead et al., Reference Whitehead, Charles, Jackson, Smol, Engstrom and Davis1990; Spear et al., Reference Spear, Davis and Shane1994; Oswald and Foster, Reference Oswald and Foster2011). The regional expansion of Picea reflects a cooling trend in the northern latitudes that coincides with declining summer insolation values (Shuman and Marsicek, Reference Shuman and Marsicek2016). The change may qualitatively also indicate an increase in effective moisture, but some pollen-inferred soil moisture reconstructions point to a drying trend during the Late Holocene (Webb et al., Reference Webb, Anderson and Webb1993).
Current climatic gradients in the NE USA region are controlled both by elevation and proximity to the Atlantic Ocean, but may have only formed in response to Late Holocene climate changes. The coldest and wettest conditions occur regionally at higher elevations (Fig. 1A and B). At low elevations, precipitation gradients largely reflect proximity to the coast, with inland regions such as VT being relatively dry (Fig. 1A and B). Several studies have examined elevation gradients through time and reveal that modern alpine vegetation zones developed in the last 3.0 cal ka BP (Jackson, Reference Jackson1989; Spear, Reference Spear1989; Whitehead et al., Reference Whitehead, Charles, Jackson, Smol, Engstrom and Davis1990; Spear et al., Reference Spear, Davis and Shane1994). Oswald et al. (Reference Oswald, Foster, Shuman, Doughty, Faison, Hall, Hansen, Lindbladh, Marroquin and Truebe2018) document the divergence of coastal and inland vegetation composition after ca. 9–8 cal ka BP, a finding consistent with pollen-inferred changes in the coastal–inland temperature gradient during the Mid-Holocene from southern New England (Marsicek et al., Reference Marsicek, Shuman, Brewer, Foster and Oswald2013). However, the development of east–west climate gradients in northern New England and adjacent New York have yet to be examined.
(A) Location map for Twin Ponds, VT, Knob Hill Pond, VT, Heart Lake, NY, and Lost Pond, NH shown with regional mean annual air temperature values. (B) Same as A, but with total annual precipitation. Climate data for both maps from: PRISM Climate Group, Oregon State University, http://prism.oregonstate.edu, accessed June 1, 2021. (C) Imagery of Twin Ponds showing location of Core TP14 in the deepest part of the western basin.

This study works within a regional context to investigate both the long-term evolution of current climate gradients and millennial-scale intervals of interest, such as the Mid-Holocene. The specific goals of this study are to: (1) reconstruct Holocene vegetation and climate changes using the pollen record from Twin Ponds, VT; (2) model age uncertainties of specific pollen events at Twin Ponds and nearby Knob Hill Pond to assess the synchroneity between the two records; and (3) compare the VT climate record with reconstructions from New Hampshire to the east and New York to the west. To address these goals, we examine the details of the Twin Ponds pollen record and climate reconstructions, which have been used in several recent regional paleoclimate analyses (Shuman et al., Reference Shuman, Stefanescu, Grigg, Foster and Oswald2023; Stefanescu et al., Reference Stefanescu, Shuman, Grigg, Bailey, Stefanova and Oswald2023). This focused analysis informs our understanding of vegetation and climatic dynamics throughout the Holocene in northern New England, with an added focus on the potential relationship between climate change and the range-wide decline in T. canadensis during the Mid-Holocene.
STUDY SITES
Twin Ponds is located in Brookfield, VT (44°01′41.6″N, 72°34′45.6″W, 372 m elevation) and comprises two connected basins with a maximum depth of 7.8 m in the west basin and 9.0 m in the east basin (Fig. 1C). The pollen record presented here comes from Core TP14, taken from the deepest part of the west pond at a water depth of 7.8 m (Fig. 1C). Previous work on Twin Ponds focused on a shallow-water core (TP48A) from the west pond and only covered the late Pleistocene and earliest Holocene (Mandl et al., Reference Mandl, Shuman, Marsicek and Grigg2016; Grigg et al., Reference Grigg, Engle, Smith, Shuman and Mandl2021). A permanent inlet flows into the west pond, and water leaves the basin via an outlet at the southern end of the east pond. Numerous groundwater seeps also flow into the ponds, particularly along the steeper northern and eastern slopes. Twin Ponds is located within the upper reaches of the Second Branch of the White River and within the Devonian-aged Waits River Formation, composed of carbonaceous phyllite and limestone (Ratcliffe et al., Reference Ratcliffe, Stanley, Gale, Thompson, Walsh, Rankin and Doolan2011). The ponds were formed during deglaciation of the LIS, which is estimated for the region at 14.5–14.0 cal ka BP (Ridge et al., Reference Ridge, Balco, Bayless, Beck, Carter, Dean, Voytek and Wei2012), when the ice sheet left behind numerous scoured basins, particularly within softer and more soluble CaCO3-rich bedrock. The ponds are within the Northern Piedmont biophysical region of VT and are immediately surrounded by a fringing sedge wetland and rich northern hardwood forest dominated by Acer saccharum (sugar maple), Fagus grandiflora (American beech), and Tsuga canadensis (eastern hemlock) (Thompson and Sorenson, Reference Thompson and Sorenson2000). The climate of the upland region surrounding Twin Ponds is cool-temperate and moist with a total annual precipitation of 1067 mm and a mean annual air temperature (MAAT) of 5.5°C, based on 1991–2020 data (Fig. 1; PRISM Climate Group, http://prism.oregonstate.edu, created June 1, 2021)
A previously published pollen record from Knob Hill Pond, VT, was used to develop the composite VT climatic reconstructions (Oswald and Foster, Reference Oswald and Foster2011; Oswald et al., Reference Oswald, Foster, Shuman, Doughty, Faison, Hall, Hansen, Lindbladh, Marroquin and Truebe2018). Knob Hill Pond is located ca. 40 km to the north in Marshfield, VT, at a similar elevation and distance above the valley floor as Twin Ponds (44°21′37.8″N, 72°22′25.32″W, 372 m) (Fig. 1). The climate of Knob Hill Pond is similar to that of Twin Ponds (total annual precipitation = 1015 mm; MAAT = 5.6°C; PRISM Climate Group, Oregon State University, http://prism.oregonstate.edu, accessed June 1, 2021; Fig. 1A). Although climatically similar to Twin Ponds and also within the Northern Piedmont region, Knob Hill Pond's more northern location is adjacent to the colder Northern Highlands region. Relative to the Northern Piedmont region, the forests of the Northern Highlands contain a smaller proportion of T. canadensis and more boreal taxa, such as Picea and Abies (Thompson and Sorenson, Reference Thompson and Sorenson2000).
We compare the VT climate record derived from Twin Ponds and Knob Hill Pond with climate reconstructions from two previously published pollen records from a similar latitude to the east and west in New Hampshire and New York (Fig. 1A). Lost Pond, NH (44°15′N, 71°35′W) is a mid-elevation (625 m) site in the White Mountains, NH (Spear et al., Reference Spear, Davis and Shane1994). Heart Lake (44°10′50″N, 73°58′03″W) is also a mid-elevation lake (661 m) located to the west of the VT sites in the Adirondack Mountains, NY (Whitehead et al., Reference Whitehead, Charles, Jackson, Smol, Engstrom and Davis1990). Lost Lake is the coldest and wettest of the sites (total annual precipitation = 1600 mm, MAAT = 4.5°C), while the climate of Heart Lake (total annual precipitation = 1130 mm, MAAT = 5.0°C) is closer to that of the VT sites. Heart Lake and Lost Pond were chosen for comparison based on a similar latitude and proximity to the VT sites and are the lowest-elevation inland pollen records available at this latitude.
METHODS
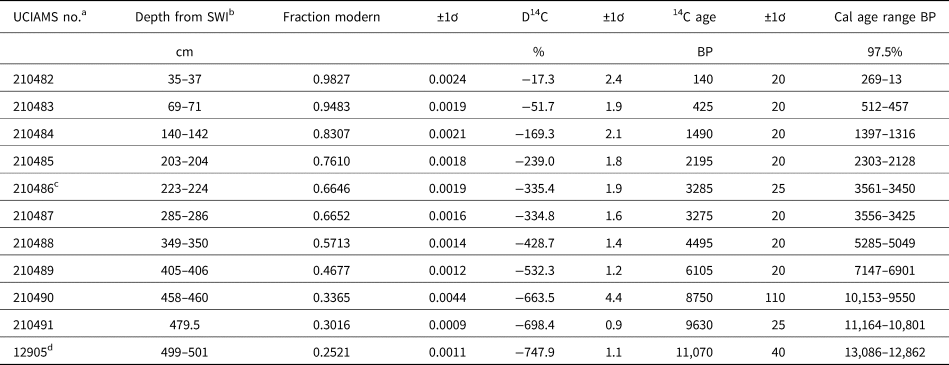
Core TP14 was collected in 2014 from the western basin of Twin Ponds at a depth of 7.8 m. Six 1.0- to 0.80-m-long sections (540 cm total length) were collected using a Livingstone piston corer with a 70-mm-diameter Bolivia attachment. Only the top 510 cm of the core is presented here because of a lack of age control and very low pollen densities below this depth. Additionally, the sediment–water interface and top 20 cm of sediment were not successfully recovered and are also not included. The chronology for core TP14 was established using the sediment–water interface (depth = 0 cm), the coring age (−64 cal yr BP), and 10 accelerator mass spectroscopy (AMS) radiocarbon dates from the Keck Carbon Cycle AMS Facility at the University of California, Irvine (Fig. 2; Table 1). Terrestrial macrofossils, including wood, conifer needles, arboreal seeds, and charcoal, were collected from 10 intervals of 1–2 cm and submitted for 14C dating. A radiocarbon date (UCIAMS no. 12905) from a previously published core (TP48) from Twin Ponds (Mandl et al., Reference Mandl, Shuman, Marsicek and Grigg2016) was included to constrain the early postglacial chronology for both Core TP14 and the recently published Core TP79 chronology (Stefanescu et al., Reference Stefanescu, Shuman, Grigg, Bailey, Stefanova and Oswald2023). All three cores show similar trends in water content and bulk density that were used to establish stratigraphic control points to the Core TP48 basal radiocarbon date (Supplementary Fig. 1). The Bchron software package (Haslett and Parnell, Reference Haslett and Parnell2008) was used to calibrate 14C ages to calendar years using the INTCAL20 data set (Reimer et al., Reference Reimer, Austin, Bard, Bayliss, Blackwell, Ramsey, Butzin, Cheng, Edwards and Friedrich2020) and to derive a chronology based on the mean of 1000 possible age models (Fig. 2). This method takes into account age uncertainties arising from sample size, instrumental methods, and the range of calibrated ages that can be generated from a single 14C age. One of the radiocarbon ages (UCIAMS no. 210486) from Twin Ponds showed a stratigraphic age reversal. An experimental inclusion of this date in the Bayesian-derived chronology resulted in a sharp increase in sediment accumulation rates at 3.5 cal ka BP that was not supported by the lithologic data (Fig. 2). Based on these results, this date was not included in the final chronology for this study. Although the resulting mean chronology is a reasonable estimate for the presentation and discussion of the data, the actual age is more accurately represented as a range of ages represented by the 97.5% confidence interval of possible ages. The average range of possible ages for all depths is equal to 755 years, with a maximum age range of ca. 1860 years at ca. 8.0 cal ka BP and a minimum of ca. 100 years at the top of the core (Fig. 2).
(A) Age vs. depth curve for Twin Ponds showing the mean chronology in black and 97.5% confidence interval in blue. Zero depth was assigned to the sediment–water interface. The age density distributions for each calibrated radiocarbon age are shown in gray. Labels refer to the calibrated age ranges listed in Table 1. The age shown as a red circle and marked with a red label was not used in the final age chronology. (B) Weight percentages of organic carbon from the 550°C loss-on-ignition (LOI) burn and those for inorganic carbon inferred from the 1000°C LOI burn plotted by age.

Radiocarbon date information for core TP14 from Twin Ponds, VT.

a Accelerator mass spectroscopy (AMS) identifier, Keck Carbon Cycle AMS Facility at the University of California, Irvine.
b SWI, sediment–water interface.
c Not used in chronology because of age reversal with UCIAMS -210487.
d Age estimated from core TP48 based on sedimentological changes (Mandl et al., Reference Mandl, Shuman, Marsicek and Grigg2016).
The core was described and divided into 1 cm intervals. Subsamples of 1 cm3 at each interval were burned at 550°C and 1000°C to respectively calculate the loss-on-ignition (LOI) weight percent changes in organic and inorganic carbon (Dean, Reference Dean1974). Additional 1 cm3 subsamples of sediment, taken at 5 or 10 cm intervals, were sent to the Continental Scientific Drilling Office for preparation for pollen analysis. Samples were processed using the lab's standard methods, modified from Faegri et al. (Reference Faegri, Iversen, Kaland and Krzywinski1989). A known concentration of spike (microspheres) was added to each sample to enable calculation of pollen concentrations and accumulation rates (PARs) (Stockmarr, Reference Stockmarr1971). Samples were stored and mounted in silicon oil and examined under magnifications of 400× and 1000× by LDG using a Leica DMLS2 microscope housed in the Shuman Lab at the University of Wyoming. For each sample, 350–450 pollen grains were identified and counted. Taxon identification was aided by published reference materials (McAndrews et al., Reference McAndrews, Berti and Norris1973; Kapp et al., Reference Kapp, Davis and Hall2000). For the genus Pinus, subgenera were differentiated when an intact distal membrane was present. Pollen percentages were derived using the sum of all pollen types. Spores were also identified and counted but were not included in the pollen sum. During pollen analysis, we learned that 40 of the 60 pollen samples were processed with a batch of microsphere spike that was prone to clumping as a result of the development of a biofilm (Heck, J., personal communication, 2019). The remaining 20 samples, taken from depths throughout the core, were treated with a microsphere from a different supplier (Palynotech SG06 Palynospheres). Pollen concentrations and accumulation rates were calculated for all samples for comparison between the two types of microspheres. There were two samples from the biofilm batch of microspheres with large deviations in pollen concentration relative to adjacent samples treated with the newer Palynosphere spike. These two samples were treated to remove the silicon oil, and a lycopodium spike was added to each so they could be recounted and recalculated for PARs. Although there may have been some minor clumping issues in other samples, the concentrations and PARs calculated for Twin Ponds are similar to values and trends from nearby Knob Hill Pond (Oswald and Foster, Reference Oswald and Foster2011) and provide a valuable measure of general trends in PARs through time. Pollen zones of similar assemblages were determined using a stratigraphically constrained cluster analysis (CONISS; Grimm, Reference Grimm1987).
Vegetation and climate reconstructions were based on the modern analog technique (Overpeck et al., Reference Overpeck, Webb and Prentice1985; Jackson and Williams, Reference Jackson and Williams2004; Chevalier et al., Reference Chevalier, Davis, Heiri, Seppä, Chase, Gajewski, Lacourse, Telford, Finsinger and Guiot2020) and follow the same methods outlined in Stefanescu et al. (Reference Stefanescu, Shuman, Grigg, Bailey, Stefanova and Oswald2023). A subset of the North America modern pollen database (Whitmore et al., Reference Whitmore, Gajewski, Sawada, Williams, Shuman, Bartlein, Minckley, Viau, Webb and Shafer2005) that falls within the current range of eastern temperate and boreal taxa was used for the analysis. This included 1995 sites from North America and Greenland located east of longitude 95°W and north of latitude 35°N. For the Twin Ponds reconstructions, a second set of reconstructions was run using sites only from east of longitude 80°W to test the significance of a handful of sites from the Great Lakes region on the Mid-Holocene climate reconstructions. The Whitmore data set includes a range of modern climate variables for each site. A subset of 58 northeast regional taxa (Supplementary Table 1) was selected for analysis based on Williams and Shuman (Reference Williams and Shuman2008). The R (v. 4.0; R Core Team, 2021) package rioja (v. 1.0-5; Juggins, Reference Juggins2019) was used to perform the modern analog technique and utilized the following steps consistent with other reconstructions (Marsicek et al., Reference Marsicek, Shuman, Brewer, Foster and Oswald2013; Stefanescu et al., Reference Stefanescu, Shuman, Grigg, Bailey, Stefanova and Oswald2023). The first step involved calculation of the dissimilarity as a squared chord distance (SCD) between the modern pollen assemblages from each site in the extracted modern pollen data set. Then, for each environmental variable (e.g., MAAT), the number of close analogs (lowest SCD) that resulted in the lowest root-mean-square error (RMSE) between the predicted and observed environmental value was determined. The final step was to run the dissimilarity metric between the modern and fossil data sets and then determine the predicted environmental variable based on the average of the variable for the top five to seven modern analog sites. The RMSE derived from the modern predicted and observed values was applied to the fossil reconstruction as an estimation of the error associated with the method.
The fit of the fossil and modern pollen assemblages was assessed by examining the SCD of the top seven closest modern analogs (CMAs) for each fossil assemblage. A threshold dissimilarity value (SCD) of 0.17 for each sample to modern site comparison was based on the 2.5% quantile of the modern data set dissimilarities (Simpson, Reference Simpson2007). Fossil samples lacking any modern analogs (all seven CMA SCD >0.17) had an average sample SCD >0.19 (average of all seven CMA SCD) and were considered no-analog samples. Fossil samples with at least one CMA with an SCD >0.17 but with an average sample SCD = 0.17–0.19 were considered weak analogs. To examine the specific fossil–modern pollen mismatches that led to high SCD values, the modern pollen percentages of the seven closest modern analogs for each fossil sample were averaged to produce a model pollen record derived from the modern data. The modeled pollen percentages of select taxa were then compared with the observed fossil percentages. The vegetation reconstructions for pollen zones were inferred by examining the spatial distribution of modern analog sites within currently defined ecoregions of North America (McMahon et al., Reference McMahon, Gregonis, Waltman, Omernik, Thorson, Freeouf, Rorick and Keys2001; Omernik and Griffith, Reference Omernik and Griffith2014).
Telford and |Birks (Reference Telford and Birks2005, Reference Telford and Birks2009) illustrate that when a modern pollen data set has spatial structure, spatial autocorrelation can cause the results of these cross-validation methods to be overly optimistic. The modern pollen data set used in this study is spatially autocorrelated and thus runs this risk. To test the significance of the modern analog technique (MAT) reconstructions, we followed Telford and Birks's (Reference Telford and Birks2011) method of comparing each climate reconstruction to a set of 1000 null reconstructions based on a random but spatially structured data set of the same climate variable using the R package PalaeoSig (Telford, Reference Telford2023). If the MAT reconstruction explains a greater proportion of variance within the fossil pollen data set than most of the null reconstructions (P value < 0.05), then the reconstruction is statistically significant.
The Twin Ponds and Knob Hill Pond pollen records were compared by examining the timing of six individual pollen events representing previously described shifts in the regional vegetation (Oswald and Foster, Reference Oswald and Foster2011; Oswald et al., Reference Oswald, Foster, Shuman, Doughty, Faison, Hall, Hansen, Lindbladh, Marroquin and Truebe2018; Grigg et al., Reference Grigg, Engle, Smith, Shuman and Mandl2021). A comparative analysis of pollen events needs to consider uncertainties related to sampling resolution and variable deposition rates (yr/cm), as well as the analytical uncertainty, calibration uncertainty, quantity, and adjacency of radiocarbon dates (Haslett and Parnell, Reference Haslett and Parnell2008). To address the synchroneity of events between sites, we used the Bayesian approach described by Parnell et al. (Reference Parnell, Haslett, Allen, Buck and Huntley2008) to quantitatively assess differences between chronologies and either reject or accept the possibility of event synchroneity. For each event depth in a given sediment core, a density distribution of 10,000 possible ages was generated, and the 97.5% confidence interval was used to identify overlap between the age distributions of the same event across sites. Comparison of the 97.5% confidence intervals from each site was used to be consistent with the age ranges from the established chronologies. Event synchroneity was further tested by calculating the age differences between the two sets of 10,000 possible ages for each event. For this analysis, the more conservative 95% confidence interval of age differences was compared for each event as recommended by Parnell et al. (Reference Parnell, Haslett, Allen, Buck and Huntley2008). If the 95% confidence interval of age differences included the zero value, representing no age difference, and the 97.5% confidence interval of age probabilities for the event from each record overlapped, then the possibility that the events were synchronous was accepted. During time intervals in which pollen events were synchronous at Twin Ponds and Knob Hill Pond, the reconstructed climate values were averaged to produce a composite VT climate record. Averages were calculated by first interpolating climate values for each record to 50 year intervals. If pollen events were identified as asynchronous, the accuracy of radiocarbon chronologies and regional biogeographic differences was further examined.
The composite VT climate record from Twin Ponds and Knob Hill Pond was then compared with climate reconstructions from Lost Pond, NH, to the east and Heart Lake, NY, to the west (Fig. 1). The published pollen data for both sites (Whitehead et al., Reference Whitehead, Charles, Jackson, Smol, Engstrom and Davis1990; Spear et al., Reference Spear, Davis and Shane1994) were accessed from the Neotoma Paleoecology Database (Williams et al., Reference Williams, Grimm, Blois, Charles, Davis, Goring, Graham, Smith, Anderson and Arroyo-Cabrales2018). The climate reconstructions for these additional sites were developed following the same methods outlined for Twin Ponds and Knob Hill Pond.
RESULTS
Chronology and LOI
The TP14 chronology extends from 120 cal yr BP to 13.1 cal ka BP. The age versus depth curve indicates a steady increase in sediment accumulation rates through time, with the highest rates occurring in the last 2.0 ka yr BP (Fig. 2A). The LOI data show an early shift at ca. 11.5 cal ka BP (485 cm) from a CaCO3-rich sediment (25–35% wt. loss at 1000°C) to a sediment with high proportions of organic carbon (20–55%) (Fig. 2B). For most of the Holocene (11.5–1.8 cal ka BP; 485–170 cm), organic carbon fluctuated between 20% and 50% wt. loss at 550°C. Inorganic carbon also varied during this time but at a lower range of 5–20% wt. loss at 1000°C (Fig. 2B). A second prominent shift in sediment composition occurred at 1.8 cal ka BP (170 cm), when organic carbon began a steady increase to a broad plateau of maximum values ranging from 45% to 55% wt. loss at 550°C. High organic carbon values persisted until 230 cal yr BP (40 cm), then decreased to 25–35% wt. loss at 550°C for the remainder of the record. Inorganic carbon values decreased to values <10% wt. loss at 1000°C at 2.1 cal ka BP (195 cm) and remained low (Fig. 2B).
Pollen zones and vegetation and climate reconstructions
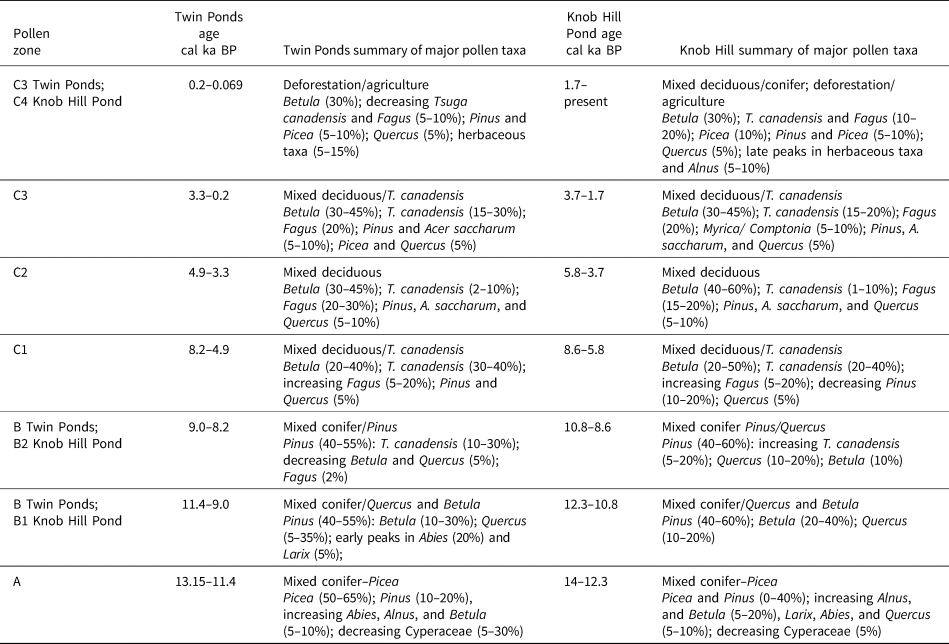
Pollen zones identified using the total sum of squares from a stratigraphically constrained cluster analysis (CONISS; Grimm, Reference Grimm1987) place the first two pollen zone boundaries at 11.4 and 8.2 cal ka BP (Fig. 3A). These divisions roughly correspond with pollen zones first recognized by Deevey (Reference Deevey1939) for southern New England and also used by Oswald and Foster (Reference Oswald and Foster2011) at nearby Knob Hill Pond (Fig. 1). Additional prominent stratigraphic shifts as indicated by the cluster analysis were used to delineate subzones at 4.9 and 3.3 cal ka BP that are unique to this study (Fig. 3A).
(A) Pollen percentage diagram for Twin Ponds plotted by age and depth. Horizontal black lines delineate pollen zones, and dendrogram results of CONISS cluster analysis are shown in the far right. (B) Pollen accumulation rate diagram for Twin Ponds.

Vegetation and climatic reconstructions for the Twin Ponds pollen record were derived using the MAT. The MAT reconstructions were assessed for each fossil sample based on the established 0.17 SCD threshold for each of the seven CMAs and also on the average SCD threshold of 0.19 for all seven CMAs. Only four fossil assemblages were considered no-analog samples, as they did not contain at least one modern analog with an SCD <0.17 and had an average SCD of >0.19 (Fig. 4). Three of the no-analog samples were from depths older than 11.0 cal ka BP, and the fourth is dated at 8.3 cal ka BP, just before the boundary between Zones B and C (Fig. 4). Seven fossil assemblages, centered at ca. 5.6, 4.7, and 0.17 cal ka BP, were considered weak modern analogs, having at least one modern analog with an SCD <0.17 and an average SCD of 0.17–0.19. These results suggest that the modern analog data set provides a reasonable set of possible analogs for most of the Holocene. Changes in the spatial distribution of CMAs between pollen zones were used to infer associated changes in vegetation and climate (Fig. 5).
Comparison of observed fossil pollen percentages (black curves) and modeled pollen percentages (red curves) for select taxa. Average squared chord distance (SCD) in left-most curve with cutoff thresholds discussed in the text. Horizontal lines mark pollen zone and subzone boundaries.

(A) Map showing North American level 2 ecoregions (McMahon et al., Reference McMahon, Gregonis, Waltman, Omernik, Thorson, Freeouf, Rorick and Keys2001; Omernik and Griffith, Reference Omernik and Griffith2014) and the location of modern analog sites by pollen zone. (B) Ecoregions and modern analog sites for pollen Zone C subzones. Ecoregion geospatial data downloaded from: U.S. Environmental Protection Agency, https://www.epa.gov/eco-research/ecoregions-north-america, accessed June 5, 2022.

The RMSE for MAAT is 1.7°C, and total annual precipitation has an RMSE of 148 mm. The only reconstructed climate change that exceeded the RMSE was the increase in temperatures between 13.1 and 9.3 cal ka BP (Fig. 6). Additional tests of significance using PaleoSig (Telford and Birks, Reference Telford and Birks2011) indicate that the MAAT reconstructions explain 38% of the variance in the fossil record, a value that is statistically higher than the null reconstructions (P = 0.001) (Supplementary Fig. 2). The reconstructions of total annual precipitation explain 16% of the variance in the fossil record and are not statistically significant (P = 0.163) relative to the null reconstructions (Supplementary Fig. 2). These results and the similarity between the RMSE and the relatively small degree of reconstructed climate change during most of the Holocene limits the interpretation of the MAT reconstructions. However, the climate reconstructions do agree with variations observed at other sites across the region (Shuman et al., Reference Shuman, Marsicek, Oswald and Foster2019, Reference Shuman, Stefanescu, Grigg, Foster and Oswald2023) and provide a quantitative measure of the climate changes qualitatively inferred from the changing spatial distribution of modern analog sites between pollen zones.
Annual climate reconstructions for Twin Ponds derived from the full set of selected modern analog sites shown with dark red curves, gold curves show reconstructions derived from northeast only, gray shading represent the root-mean-square error associated with each of the reconstructions. The Twin Ponds pollen zones are labeled along the top, and dashed gray lines show current climate values for reference. MAAT, mean annual air temperature.

Pollen Zone A (13.15–11.4 cal ka BP)
Pollen Zone A is characterized by high percentages of Picea pollen (50–65%), with lesser amounts of Pinus (10–20%), Abies (<10%), and herbaceous taxa (5%) (Fig. 3A). Identification of Pinus beyond genus was limited because of few intact grains, but the data suggest more of the subgenus Pinus at the start of the record. The first sample of Zone A contains higher percentages of Cyperaceae (35%), and the last sample of the zone shows increasing percentages of Betula and Alnus viridis (ca. 5%) pollen. Zone A is also characterized by low PARs at <2000 grains/cm2/yr (Fig. 3B).
The modern vegetation analogs for Zone A pollen assemblages are primarily located within the Canadian Hudson Plains and Taiga Shield and Softwood Shield ecoregions (Fig. 5A). Zone A analog sites span the broadest geographic range of the record. High percentages of Cyperaceae pollen at the start of the zone are most similar to sites from the waterlogged tundra of the Hudson Plains and the adjacent taiga, although high SCD values suggest this is a no-analog assemblage, largely resulting from low fossil values of Betula and Alnus, two shrub genera currently associated with wetland tundra (Figs. 4 and 5A). This suggests either a fringing sedge wetland or non-analog graminoid-dominated tundra. High Picea percentages dominate the remainder of the zone and are a good fit to modern sites in the Canadian taiga and northern forest located south and east of Hudson Bay (Fig. 5A). Low PAR values and low percentages of Poaceae pollen and fern spores suggest these early forests were open in structure compared with those of the Holocene (Fig. 3B). The cold conditions implied by the northern location of modern analogs are evident in the climate reconstructions: average annual temperatures were 5–8°C ± 1.7°C colder than present, with the lowest temperatures occurring during the YD (Fig. 6). High SCDs at the end of the zone occur during the transition from a Picea woodland to a mixed conifer forest with increasing percentages of the deciduous shrubs Betula and Alnus (Fig. 4), resulting in an increase in total annual precipitation centered around 11.5 cal yr BP.
Pollen Zone B (11.4–8.2 cal ka BP)
A steady decline in Picea percentages to <10% and an increase in Pinus pollen to 40–55% define Zone B (Fig. 3A). This zone is also characterized by increased arboreal diversity relative to Zone A and total PARs (2500–20,000 grains/cm2/yr) (Fig. 3B). The zone begins with a sequence of arboreal pollen peaks, starting with Abies and Larix, between 11.4 and 10.4 cal ka BP. Betula pollen percentages then peak at ca. 10.5 cal ka BP, followed by a peak in Quercus pollen percentages from 10.0 to 9.0 cal ka BP. An increase in T. canadensis (30–35%), a decline in the subgenus Pinus, and the first significant (>1%) appearance of Fagus grandifolia pollen at 9.0 cal ka BP define the end of Zone B.
Zone B modern analogs mostly fall within the Mixed Wood Shield ecoregion, with a handful of sites in the more southern Mixed Wood Plains (Fig. 5A). Modern-analog sites are located within a narrower and more southerly latitudinal range and a similar longitudinal range compared with those from Zone A (Fig. 5A). High SCD values at the start of Zone B suggest the continuation of no-analog transition assemblages from Zone A and are reflected in the modern underrepresentation of Abies pollen relative to fossil pollen (Fig. 4). SCD values then decline after 11.0 cal ka BP and suggest a strong affinity to the mixed Pinus–Betula forests of the northern Great Lakes region (Fig. 5A). The subsequent increase in Quercus pollen percentages at 10.0 cal ka BP is not matched by the reconstructed percentages and results in an increase in SCD values and a slight southern shift in the location of analog sites (Figs. 4 and 5A). The increase in T. canadensis and decline in Quercus at 9.0 cal ka BP result in the addition of a limited number of analogs from the eastern Mixed Wood Plains ecoregion (Fig. 5A).
Zone B climate reconstructions indicate rapid warming (4–5°C ± 1.7°C in 500 years) between 11.5 and 11.0 cal ka BP (Fig. 6). Average annual temperatures continued to rise another 3.6°C ± 1.7°C until peaking at 9.3 cal yr BP. Total annual precipitation values were low and reflect the increase in dry-adapted Quercus (Fig. 6). The shift in pollen from Quercus to T. canadensis at the end of Zone B suggests an increase in moisture availability, which is shown in the climate reconstruction as an increasing trend in total annual precipitation (Fig. 6).
Pollen Zone C (8.2–0.069 cal ka BP)
The B–C pollen zone boundary at 8.2 cal ka BP has the largest total sum of squares of the record and marks the transition to a pollen assemblage that resembles the composition of forests before European deforestation (Fig. 3A). The dominant taxa (10–40%) in Zone C include T. canadensis, Betula, and F. grandifolia, with lesser amounts (<10%) of Pinus, Acer saccharum, Quercus, Fraxinus, and Ulmus. PARs for Zone C are the highest of the record, fluctuating between 10,000 and 30,000 grains/cm2/yr (Fig. 3B). Three subzones are differentiated based predominantly on changes in percentages of T. canadensis.
Subzone C-1 (8.2-4.9 cal ka BP) shows generally high percentages (20–40%) of T. canadensis and Betula and increasing percentages of F. grandifolia pollen (5–20%) (Fig. 3A). Between 6.0 and 4.9 cal ka BP, T. canadensis percentages fluctuate in an alternating pattern with Betula and F. grandifolia. Tsuga canadensis pollen drops to below 20% at ca. 6.0 cal ka BP, while Betula and F. grandifolia peak at 40% and 20%, respectively. Tsuga canadensis percentages then rebound to their highest levels of the record (43%) at 5.65 cal ka BP before dropping again to 10% at the end of the subzone. Betula and F. grandifolia show an opposite pattern, with a decline at 5.65 cal ka BP followed by increasing percentages at the end of the subzone.
Low percentages of T. canadensis (2.5–8.0%) and increased percentages of Betula (35–40%), F. grandifolia (20–35%), and A. saccharum (5–10%) persist throughout Subzone C-2 (4.9–3.3 cal ka BP) (Fig. 3A). PARs for most taxa either remain unchanged or decline, leading to a lower total PAR (Fig. 3B). Increased percentages of T. canadensis (10–27%) define Subzone C-3 (3.3 ka to 69 cal BP) (Fig. 3A), while percentages of Betula and F. grandifolia do not change significantly. Picea pollen percentages increase slightly (from <5% up to 8%) starting at 1.5 cal ka BP; however, Picea PARs are the highest of the record. Also notable in the PAR diagram is an increase in Cyperaceae pollen around 1.5 cal ka BP (Fig. 3B). Total PARs increase in Subzone C-3 to levels that are similar to those in Subzone C-1 (Fig. 3B). The end of Subzone C-3 (200–69 cal yr BP) shows a decline in several arboreal taxa, including T. canadensis, F. grandifolia, Pinus, Picea, A. saccharum, and Fraxinus, and an increase in pollen from the following herbaceous families: Poaceae, Asteraceae, and Polygonaceae (Fig. 3A).
Modern analog sites for Zone C all fall within either the Mixed Wood Plains or the more eastern and higher-elevation Atlantic Highlands ecoregions (Fig. 5). The eastward shift in analog sites suggests an increase in precipitation between 8.0 and 7.3 cal ka BP that is reflected in the climate reconstructions as the largest apparent precipitation change of the record (Fig. 6). Subzone C-1 (8.2–4.9 cal ka BP) modern analogs have generally lower dissimilarity values than those recorded for the previous subzones, although the reconstructed values of T. canadensis remain ca. 15% below the fossil values (Fig. 4). C-1 analog sites are located in two longitudinal clusters, both of which are characterized by high percentages of T. canadensis and Betula pollen and moderate percentages of F. grandifolia pollen (Fig. 5B). The first cluster of analog sites is located within the Mixed Wood Plains of the western Great Lakes region. The second, more eastern cluster falls within the eastern Mixed Plains and Atlantic Highlands ecoregions (Fig. 5B).
The decrease in T. canadensis and increase in Betula, F. grandifolia, A. saccharum, and Fraxinus during Subzone C-2 (4.9–3.3 cal ka BP) results in an eastward shift in the location of modern analogs to sites located exclusively within the eastern Mixed Wood Plains and the Atlantic Highlands ecoregions (Fig. 5B). SCD values remain at the same levels as in the previous subzone, with the exception of a peak between 4.9 and 4.6 cal ka BP, when F. grandifolia percentages increase to ca. 34% (Fig. 4). Only two sites in the modern data set show F. grandifolia pollen percentages greater than 20%. Subzone C-2 modern analog sites have a slighter higher average elevation than any other subzone.
The eastward shift in modern analog sites between Subzones C-1 and C2 implies increased precipitation (Fig. 5B). However, this shift in modern analog sites could instead reflect the exclusion of the western Great Lakes cluster of sites with high T. canadensis pollen. To test the influence of the western cluster of high T. canadensis sites on the reconstruction, a second set of reconstructions were run with only sites from the northeast (Fig. 6). These results also suggest an increase in precipitation between Subzones C-1 and C-2 (Fig. 6), a trend that likely reflects the shift toward higher-elevation analog sites (Fig. 1B). The increase in elevation for analog sites in Subzone C-2 might also signal a regional cooling. Currently in northern New England, the shift from mixed hardwood forests with high T. canadensis abundance to those with low T. canadensis abundance occurs both along latitudinal and elevational gradients, with low T. canadensis typical of Fagus–Betula–Acer forests at sites that lie farther north or higher in elevation than those with abundant T. canadensis (Spear et al., Reference Spear, Davis and Shane1994; Cogbill et al., Reference Cogbill, Burk and Motzkin2002; Paciorek et al., Reference Paciorek, Goring, Thurman, Cogbill, Williams, Mladenoff, Peters, Zhu and McLachlan2016). This suggests that the decline in T. canadensis and increase in F. grandifolia may represent cooling.
The set of modern analog sites identified for all but the top of Subzone C-3 (3.3 cal ka BP to 69 cal yr BP) have the lowest SCD values of the record (0.09–0.14) and are very similar to those from Subzone C-1, reflecting the return of T. canadensis to higher percentages and declining F. grandifolia (Figs. 4 and 5). The climate changes reconstructed between C-2 and C-3 reflect a westward shift in modern analog sites and show decreasing precipitation and increased temperatures, although none fall outside the range of the calibration RMSE. However, as with the transition between C-1 and C-2, this shift toward slightly drier and warmer conditions also occurs when the midwestern sites are excluded from the MAT and reflects the inclusion of lower-elevation analog sites from the northeast. The increase in cold-adapted Picea and Abies at 1.4 cal ka BP during the latter part of Subzone C-3 suggests cooling, which is also shown in the climate reconstruction as a decrease in temperatures of about 1°C (±1.7°C). Modern analogs from the top of Subzone C-3 (200–69 cal yr BP) show a small increase in SCD values and come from a more eastern geographic range than any of the previous samples (Figs. 4 and 5). These most recent pollen assemblages from Twin Ponds were strongly influenced by human land-use changes and thus likely do not reflect a change in climate.
Comparison with Knob Hill Pond
Overall, the pollen records from Twin Ponds and Knob Hill Pond show similar taxa, percentages, and patterns of change through time (Fig. 7; Table 2). However, the timing of some pollen zone boundaries are offset by up to 1000 years between the two sites (Fig. 7; Table 2). To address the causes and significance of these offsets, the timing of six different pollen events present in both records were quantitatively compared using methods described by Parnell et al. (Reference Parnell, Haslett, Allen, Buck and Huntley2008).
(A) Pollen percentages for selected taxa from Twin Ponds (green curves) and Knob Hill Pond (blue curves) used in the comparison of six pollen events between the two sites. The density distributions of 10,000 possible dates for each event from each site are plotted for comparison (blue histograms = Knob Hill Pond; green histograms = Twin Ponds). The darker shading within each density plot indicates the 97.5% confidence interval of ages. The Twin Ponds pollen zones are plotted along the top for reference. (B) The density distributions of age differences between the two sites for each of the six comparative pollen events shown in A. The shaded area shows the 95% confidence interval of age differences. Events where this interval includes zero (vertical dotted line) are considered synchronous, and in those where zero falls outside the 95% interval, the events are considered asynchronous.

Comparative summary of pollen zones and assemblages for Twin Ponds and Knob Hill Pond, VT.

The first pollen event considered was the decline in Picea percentages following the YD at the start of Zone B (Fig. 3A). The density distributions of 10,000 possible ages for this event from each site show no overlap in the 97.5% probability of age ranges (Fig. 7A). The calculated age differences between the two sets of possible ages also reveal that the 95% probability range of age differences is 615–1664 years and does not include any zero age differences (Fig. 7B). These results suggest that this event was not synchronous between the two sites. The second event examined was the Early Holocene peak in Quercus during Zone B (Fig. 3A). The 97.5% range of probabilities for the respective Quercus peaks shows ca. 500 year overlap, and the 95% probability of age differences ranges between 100 and 2400 years (Fig. 7A and B). This analysis suggests that the offset in Quercus between the two sites, while still significant, was less than during the Picea decline offset. The third event examined was the initial rise in Betula pollen, centered at both sites around 8.0 cal ka BP at the beginning of Zone C (Fig. 3A). The 97.5% probability of possible age ranges for this event at each site overlaps by ca. 900 years, and the age differences have a 95% probability range that includes the zero point (Fig. 7A and B). Based on these results, we cannot reject the hypothesis that the rise in Betula and the associated B to C pollen zone boundary occurred synchronously at the two sites.
The last three events examined involve significant changes in T. canadensis pollen during the Mid- and Late Holocene during Zone C (Fig.3A). The final peak in T. canadensis during Subzone C-1 before its Mid-Holocene decline occurred at both sites within a 300 year duration of time. The 97.5% probability of age ranges overlaps, and the 95% probability of age differences includes the zero point (Fig. 7A and B). Therefore, this final peak in T. canadensis appears to have been synchronous at the two sites (Table 2). The next T. canadensis event examined was the initial Mid-Holocene low in pollen percentages during Subzone C-2 (Fig. 3A). Despite the adjacency of this low to the previous synchronous T. canadensis peak, there is a large difference in mean ages (ca. 1000 years). Additionally, the 97.5% probability of age ranges does not overlap, and the 95% probability of age differences is tightly spaced between 1409 and 1807 years (Fig. 7A and B). This age offset between the two sites highlights differing rates of T. canadensis decline. At Knob Hill Pond, percentages drop from 28% to 5% in ca. 80 years, while at Twin Ponds, percentages drop gradually from 42% to 27% to 12% to 5% over ca. 790 years (Fig. 7A). The final event examined was the peak in T. canadensis before its modern decline during Subzone C-3 (Fig. 3A). The mean ages for this event at the two sites are within 180 years of each other, the 97.5% probability of age ranges overlaps, and the 95% probability of age differences includes the zero point (Fig. 7A and B). These results suggest that this vegetation change at the two sites may have been synchronous.
DISCUSSION
Implications of no-analog pollen assemblages
No-analog pollen assemblages occur during both the Early and Mid-Holocene (Fig. 4). The no-analog sedge-dominated tundra at the base of record may reflect reduced deciduous tree and shrub productivity under the low atmospheric CO2 concentrations of the late Pleistocene (Sage and Coleman, Reference Sage and Coleman2001). Other factors, including increased seasonality (Williams et al., Reference Williams, Shuman and Webb2001) and the presence of megaherbivores (Gill et al., Reference Gill, Williams, Jackson, Lininger and Robinson2009) may also explain this early sedge tundra and the lack of shrub taxa. At ca.11.0 cal ka BP during the transition from a Picea- to Pinus-dominant forest, high percentages of Abies and Larix, along with increasing percentages of Pinus pollen, reflect a variant of boreal forest (Fig. 3A). These short-lived combinations of species were likely possible because of a rapidly shifting window of climate that was warming but still moist enough to support Abies and Larix (Fig. 6). A second Early Holocene no-analog assemblage occurred at 9.2 cal ka BP, when Quercus pollen peaked during a time of high Pinus pollen (ca. 50%) (Fig. 3A). Sites within the modern data set with >30% Quercus pollen do not contain Pinus pollen >40%. This combination of taxa produces the warmest and driest temperatures of the record (Fig. 6) and reflects the unique set of climate drivers present during the Early Holocene (higher summer insolation and the continued presence of the LIS). The sequence of Picea-, to Pinus-, then Quercus-dominated forests indicates rising temperatures and may represent a period of unusually low north–south temperature differences, as the abundances of these taxa were similar to those in pollen records from southern New England (Oswald et al., Reference Oswald, Foster, Shuman, Doughty, Faison, Hall, Hansen, Lindbladh, Marroquin and Truebe2018), which has not been the case since ca. 8.2 cal ka BP.
While the no-analog assemblages of the Early Holocene indicate combinations of taxa not currently found together in high percentages, those during the Mid-Holocene result from a single taxon. During subzones C-1 and C-3, high percentages of T. canadensis (averaging 30%), are not well represented by the modern data. There are only four modern sites with T. canadensis >25%. The lack of modern samples with abundant T. canadensis pollen likely reflects European deforestation and a changing Late Holocene climate. Estimates of presettlement T. canadensis in central and northern VT show a 2–20% decline in T. canadensis over the past 400 years (Cogbill et al., Reference Cogbill, Burk and Motzkin2002; Thompson et al., Reference Thompson, Carpenter, Cogbill and Foster2013). However, there is also evidence from pollen records that T. canadensis began declining in the NE USA after ca. 2.0 cal ka BP (Fuller et al., Reference Fuller, Foster, McLachlan and Drake1998; Oswald et al., Reference Oswald, Foster, Shuman, Doughty, Faison, Hall, Hansen, Lindbladh, Marroquin and Truebe2018). At Twin Ponds and Knob Hill Pond, T. canadensis first begins to decline between ca. 1.0 and 0.6 cal ka BP (Fig. 7A). At some sites in the NE USA and most sites farther south in the Appalachian Mountains, T. canadensis never recovered from the Mid-Holocene decline (Oswald et al., Reference Oswald, Foster, Shuman, Doughty, Faison, Hall, Hansen, Lindbladh, Marroquin and Truebe2018). These results suggest that in addition to deforestation, the cool climate of NE USA since ca. 2.0 cal ka BP has not been as favorable for T. canadensis as the Early to Middle Holocene climate and that its pre-decline abundance might well be considered an extension of the no-analog forest types of the Early Holocene (Williams et al., Reference Williams, Shuman and Webb2001; Shuman et al., Reference Shuman, Newby and Donnelly2009).
High percentages (20–30%) of F. grandifolia during Subzone C-2 are also not matched in the modern data set, where only two modern samples have >20% F. grandifolia (Fig. 4). At Twin Ponds and Knob Hill Pond, deforestation during European settlement coincides with a sharp decline in F. grandifolia pollen, suggesting that the lack of modern analogs results from human land use. Presettlement estimates of Fagus show that its relative abundance has declined in north-central VT by >20% (Cogbill et al., Reference Cogbill, Burk and Motzkin2002; Thompson et al., Reference Thompson, Carpenter, Cogbill and Foster2013). However, like T. canadensis, there is pollen evidence from other sites in the NE USA that F. grandifolia began a downward trend at ca. 1.0 cal ka BP (Oswald et al., Reference Oswald, Foster, Shuman, Doughty, Faison, Hall, Hansen, Lindbladh, Marroquin and Truebe2018). Previous studies from the Great Lakes region and Maine link F. grandifolia decline during the last millennium with transient drought events and increased fire frequency (Booth et al., Reference Booth, Brewer, Blaauw, Minckley and Jackson2012; Clifford and Booth, Reference Clifford and Booth2015).
Comparison with Knob Hill Pond
The comparative analysis of pollen events between the Twin Ponds and Knob Hill Pond records shows consistently older ages in the Knob Hill Pond record and a progressive increase in the correlation of events through time with the exception of the Mid-Holocene low in T. canadensis (Fig. 7). The early and large offset between the two records does not have a clear biogeographic explanation. Currently, the climates of the two sites are very similar, although Knob Hill Pond is farther north and on the edge of the cooler and wetter climate of northeastern VT (Fig. 1). Given its more southern location and the warming trajectory of the latest Pleistocene, it is more likely that any measurable difference between the two records would instead favor the decline in Picea and rise in Quercus at Twin Ponds first. Furthermore, the progressive increase in the correlation between the records through time suggests that the two oldest bulk sediment radiocarbon dates from Knob Hill are too old. This explanation is supported by the location of the Knob Hill Pond watershed within the Waits River Formation, which includes crystalline limestone, a potential source for old carbon. Although only the 550°C LOI analysis was done for the Knob Hill Pond sediment, the 1000°C LOI for Twin Ponds (Fig. 2), also located within the Waits River Formation, is 20–30% before 11.5 cal ka BP and declines through time to 10–15% in the Mid-Holocene and 5% after 2.0 cal ka BP. The 550°C LOI data from Knob Hill Pond are consistently higher than those at Twin Ponds (Oswald and Foster, Reference Oswald and Foster2011), so it is likely that CaCO3 percentages at Knob Hill Pond are lower than those at Twin Ponds. These lithologic trends suggest that the chances of old carbon contamination at Knob Hill Pond decline with time and were minimal during the Mid- to Late Holocene. Additional dating of terrestrial macrofossils is needed at Knob Hill Pond to confirm this interpretation and improve the early chronology.
The Mid-Holocene offset in the initial low in T. canadensis pollen does not fit the general pattern of increasing correlation through time and occurs during a better-dated interval with less potential for old carbon contamination. This event is interpreted as asynchronous as a result of differing rates of T. canadensis decline between the two sites. Knob Hill Pond is currently located closer to the northern limits of T. canadensis abundance, and thus past populations may have been more susceptible to a climate-driven shift in T. canadensis relative to Twin Ponds, which is more proximal to larger populations to the south. A similar difference in timing in the T. canadensis decline was found between high- and low-elevation sites in western Massachusetts (Gaudreau, Reference Gaudreau1986; Maenza-Gmelch, Reference Maenza-Gmelch1997). However, it cannot be ruled out that this asynchroneity could also represent an artifact of transient, site-specific ecological dynamics tied to the T. canadensis decline or to chronological error.
VT climate reconstructions and regional comparisons
The pollen-based annual climate reconstructions for Twin Ponds and Knob Hill Pond overlap closely with one another and provide a regional estimation of climate change (Fig. 8). The similarities allow for the calculation of a composite reconstruction for VT based on the average of the two records, although the likelihood of old radiocarbon contamination precludes the inclusion of oldest portion of the Knob Hill reconstructions between 13.0 and 11.7 cal ka BP. The only other notable departure between the records relates to the asynchroneity of the Mid-Holocene T. canadensis decline; divergence between the Twin Ponds and Knob Hill Pond pollen records between 5.9 and 5.0 cal ka BP results in two different climate reconstructions for this time period (Fig. 8).
The composite annual climate reconstructions for Vermont using the Twin Ponds and Knob Hill Pond records. The black curve is an average of the two records, the green line is the Twin Ponds record, and the blue line is the Knob Hill Pond record. Intervals without an average black curve occur at the base of the record and between 5.7–5.0 cal ka PB and indicate asynchroneity between the records. Gray shading shows the root-mean-square error associated with each reconstruction. Gray vertical lines and associated text show climatic shifts discussed in the text. MAAT, mean annual air temperature.

The reconstructions emphasize several distinct features of the climate history of VT (Fig. 8). The only change in MAAT that was greater than the RMSE-based uncertainty envelope was the rapid increase from −2°–5° ± 1.7°C between 11.5 and 10.5 cal ka BP, following YD cooling. A recent regional analysis shows widespread evidence for cooling during the YD in the NE USA and warming in the southeastern United States, a pattern currently associated with a positive North Atlantic Oscillation (Fastovich et al., Reference Fastovich, Russell, Jackson, Krause, Marcott and Williams2020b) and linked to the weakening of Atlantic Meridional Overturning Circulation (AMOC) (Boyle and Keigwin, Reference Boyle and Keigwin1987; Keigwin and Lehman, Reference Keigwin and Lehman1994; McManus et al., Reference McManus, Francois, Gherardi, Keigwin and Brown-Leger2004). The abruptness of warming following the YD may reflect the abrupt renewal of the AMOC from its reduced state during the YD, which temporarily offset the progressive global effects of rising greenhouse gas concentrations (Shakun et al., Reference Shakun, Clark, He, Marcott, Mix, Liu, Otto-Bliesner, Schmittner and Bard2012). Thus, renewed AMOC and high greenhouse gas concentrations after ca. 11.5 cal ka BP combined to create the regional jump in temperature.
After 10.5 cal ka BP, changes in MAAT in VT were small and within the calibration RMSE. However, the periods from ca. 5.2–4.0 and <1.5 cal ka BP show changes in pollen taxa and the location of modern analog sites that suggest cooling (Figs. 3 and 5). The MAT reconstructions support this interpretation, showing ca. 0.75–1.0°C cooling during these intervals relative to the intervening periods (Fig. 8). Similar cooling trends are also evident in a recent regional analysis of Holocene latitudinal pollen-inferred temperature gradients in the NE USA (Shuman et al., Reference Shuman, Stefanescu, Grigg, Foster and Oswald2023). In this analysis, the averages of nine northern climate reconstructions, including those from Twin Ponds and Knob Hill Pond were compared with similar sets of averaged reconstructions from the southern and central parts of the NE USA. The averaged northern reconstructions show a decrease in temperatures at ca. 5.5 cal ka BP and again at ca. 1.5 cal ka BP, suggesting the VT trends were regionally coherent. Both intervals of cooling are also evident in other midlatitude records from North America and may represent a shift from the high-summer insolation climates of the Early Holocene to the less seasonal climates of the Late Holocene that culminated with rapid cooling after 2.0 cal ka BP (Shuman and Marsicek, Reference Shuman and Marsicek2016).
Several changes in precipitation inferred from the modern analogs and supported by the MAT reconstructions are also seen in other paleoclimatic records. The brief increase in precipitation (to >900 mm) that marked the end of the YD aligns with other paleoclimatic evidence for increased precipitation from Twin Ponds (Grigg et al., Reference Grigg, Engle, Smith, Shuman and Mandl2021). This event was possibly a function of a shift in the position of the polar vortex resulting from the regional effects of AMOC renewal and the lingering LIS (Kirby et al., Reference Kirby, Mullins, Patterson and Burnett2002a, Reference Kirby, Patterson, Mullins and Burnett2002b). The reconstructed annual precipitation values were lowest between ca. 11.5 and 8.5 cal ka BP. These results are consistent with other evidence for a dry Early Holocene in the NE USA (e.g., Webb et al., Reference Webb, Anderson and Webb1993; Newby et al., Reference Newby, Shuman, Donnelly, Karnauskas and Marsicek2014). A subsequent increase in mesic taxa (Figs. 3 and 5) and reconstructed precipitation values (Fig. 8) ended the dry phase in VT between ca. 9.0 and 7.8 cal ka BP. This shift corresponds to a well-documented regional increase in moisture in the NE USA that coincided with the final collapse of the LIS at 8.2 cal ka BP and the onset of regional moisture advection following the demise of the glacial anticyclone (Shuman et al., Reference Shuman, Bartlein, Logar, Newby and Webb2002, Reference Shuman, Marsicek, Oswald and Foster2019; Shuman and Marsicek, Reference Shuman and Marsicek2016).
The reconstructed maximum in precipitation during the Mid-Holocene (Fig. 8) in VT, although not greater than the RMSE, is worth noting, because even a stable precipitation rate since ca. 8 cal ka BP represents a striking departure from other regional trends across eastern North America, where moisture availability continued to increase throughout the Holocene (Shuman and Marsicek, Reference Shuman and Marsicek2016; Shuman et al., Reference Shuman, Marsicek, Oswald and Foster2019). Several other paleoclimatic reconstructions from northern New England also suggest wet conditions during the Mid-Holocene, including evidence for increased lake levels from the Nulhegan Basin in northeastern VT from 5.6 to 3.5 cal ka BP (Munroe, Reference Munroe2012), higher than modern water levels during a portion of the Mid-Holocene at Echo Lake, NH (Shuman et al., Reference Shuman, Newby, Donnelly, Tarbox and Webb2005), and high lake levels in the Finger Lakes of upstate New York centered at ca. 5.8 cal ka BP (Dwyer et al., Reference Dwyer, Mullins and Good1996; Mullins and Halfman, Reference Mullins and Halfman2001). Additionally, prior pollen-based reconstructions also show high-moisture availability in the Mid-Holocene in the region around VT (Webb et al., Reference Webb, Anderson and Webb1993; Muller et al., Reference Muller, Richard, Guiot, de Beaulieu and Fortin2003).
The major VT climate trends generally agree with those reconstructed at Heart Lake, NY, and Lost Pond, NH (Fig. 9). However, several notable differences exist between sites in the timing and rate of changes. The VT and New York records show the warmest Holocene conditions between 9.3 and 8.4 cal ka BP, while farther east at Lost Pond, the warmest conditions do not occur until 6.0 cal ka BP (Fig. 9). These differences suggest a regional temperature gradient across the mountains of the NE USA, which may be consistent with stronger warming responses to summer insolation anomalies as the climate of inland locations became more continental. The long-term Holocene trend of increasing effective moisture observed at Lost Pond, NH, and in southern New England (Shuman et al., Reference Shuman, Marsicek, Oswald and Foster2019) is not evident in VT (Fig. 8), suggesting that current SW-NE precipitation gradients (Fig. 1B) did not develop until after 2.5 cal ka BP. Although greater radiocarbon age control at Lost Pond during the Late Holocene is needed to confirm this timing, previous pollen-based moisture reconstructions also show the development of a SW-NE trending precipitation gradient in the northern NE USA between 5.0 and 1.3 cal ka BP (Webb et al., Reference Webb, Anderson and Webb1993). Lost Pond is located along the crest of the Appalachians Mountains, with areas to the south and east having greater precipitation relative to areas to the north and west (Fig. 1B). Modern regional climate analyses reveal a prominent coastal–inland mode of winter precipitation variability mode, with the Appalachian Mountains as a boundary tied to storm moisture source (continental vs. coastal) and North Atlantic SSTs (Ning and Bradley, Reference Ning and Bradley2014). Large coastal–inland precipitation gradients occur when there is an increase in coastal storm tracks and show some correlation to El Niño years (Bradbury et al., Reference Bradbury, Keim and Wake2003). Increased gradients can also occur when North Atlantic SSTs are relatively cold and are associated with the negative phase of the North Atlantic Oscillation (Bradbury et al., Reference Bradbury, Keim and Wake2002; Ning and Bradley, Reference Ning and Bradley2014).
Comparison of composite annual climate reconstructions for Vermont (black line) with the pollen-inferred climate reconstruction from Heart Lake, NY (dark blue line) and Lost Pond, NH (light blue line). MAAT, mean annual air temperature.

Climate change and the decline of Tsuga canadensis
The pollen-derived climate reconstructions presented in this study support the interesting possibility that a decline in temperatures may have contributed to the T. canadensis decline in VT. Previous pollen-based temperature reconstructions from the NE USA and adjacent Canada also show cooling beginning at 5.5 cal ka BP (Muller et al., Reference Muller, Richard, Guiot, de Beaulieu and Fortin2003; Shuman and Marsicek, Reference Shuman and Marsicek2016) and an increase in inland–coastal temperature gradients (Marsicek et al., Reference Marsicek, Shuman, Brewer, Foster and Oswald2013). A more recent series of regional temperature reconstructions indicates a shift toward a steeper, more northern latitudinal temperature gradient at ca. 4.8 cal ka BP may have contributed to the T. canadensis decline (Shuman et al., Reference Shuman, Stefanescu, Grigg, Foster and Oswald2023). Additional non-pollen evidence for temperature change during the Mid-Holocene comes from decreased lacustrine oxygen isotope records from New Jersey (Zhao et al., Reference Zhao, Yu and Zhao2010) and New York (Kirby et al., Reference Kirby, Patterson, Mullins and Burnett2002b), which are respectively interpreted as representing cool, dry conditions or insolation-modulated shifts in the position of the polar vortex and moisture sources. Furthermore, a MAT pollen study by Calcote (Reference Calcote2003) tested the sensitivity of T. canadensis to different climate variables in the western Great Lakes region before and during its Mid-Holocene decline. January temperature was the one climate variable that responded to T. canadensis being omitted from the climate reconstructions. These results suggested winter cooling as a possible climatic explanation for the T. canadensis decline.
There is also modern ecological evidence to support the sensitivity of T. canadensis to colder temperatures. Dendroclimatic studies indicate that, particularly in northern parts of its range, T. canadensis radial growth is negatively correlated with winter and early spring temperatures (Cook and Cole, Reference Cook and Cole1991; Tardif et al., Reference Tardif, Brisson and Bergeron2001). Colder temperatures during the winter and early spring delay the increase in soil temperatures required to initiate photosynthesis and reduce the length of the growing season (Hadley, Reference Hadley2000). Consistent with these observations, F. grandifolia, A. saccharum, and Betula spp. grow at higher elevations in the New England mountains than T. canadensis (Spear et al., Reference Spear, Davis and Shane1994) and farther north in latitude (Paciorek et al., Reference Paciorek, Goring, Thurman, Cogbill, Williams, Mladenoff, Peters, Zhu and McLachlan2016; Fitzpatrick et al., Reference Fitzpatrick, Ellison and Preisser2021), which could explain why they remained abundant when T. canadensis declined during the inferred Mid-Holocene cooling.
Increased winter snowfall can also prolong the start of the growing season, as seen in a dendroclimatic study from southern Quebec, which showed a negative relationship between T. canadensis growth and March snowfall (Tardif et al., Reference Tardif, Brisson and Bergeron2001). The climate reconstructions for VT and other paleoclimate records from northern New England and adjacent New York and Quebec all indicate a wet Mid-Holocene (Webb et al., Reference Webb, Anderson and Webb1993; Dwyer et al., Reference Dwyer, Mullins and Good1996; Mullins and Halfman, Reference Mullins and Halfman2001; Muller et al., Reference Muller, Richard, Guiot, de Beaulieu and Fortin2003; Shuman et al., Reference Shuman, Newby, Donnelly, Tarbox and Webb2005). Cold, wet conditions in VT after 5.5 cal ka BP could have produced a larger snowpack and later spring soil warm-up, reducing the length of the T. canadensis growing season. Additional temperature proxies are needed to further explore the role of cooling in the onset of the T. canadensis decline.
Evidence for wet conditions during the Mid-Holocene in VT contrasts with southern New England, where precipitation was rising, lower than present, and punctuated by prolonged drought (Marsicek et al., Reference Marsicek, Shuman, Brewer, Foster and Oswald2013). Drought and drier than present conditions in southern New England have been identified as a potential growing season stress for T. canadensis (Foster et al., Reference Foster, Oswald, Faison, Doughty and Hansen2006; Marsicek et al., Reference Marsicek, Shuman, Brewer, Foster and Oswald2013; Shuman et al., Reference Shuman, Bravo, Kaye, Lynch, Newby and Webb2001). Although the alignment of evidence for drought at the start of the decline across the range of T. canadensis is not always clear (Booth et al., Reference Booth, Brewer, Blaauw, Minckley and Jackson2012), it has been suggested by Marsicek et al. (Reference Marsicek, Shuman, Brewer, Foster and Oswald2013) that drought likely prolonged the recovery of T. canadensis. An expansion of hydroclimate records is needed to better assess an emerging and potentially varied pattern of precipitation regimes during the Mid-Holocene.
CONCLUSIONS
The pollen record from Twin Ponds provides an additional set of postglacial ecological and climatic reconstructions for northern New England. The MAT reconstructions for Twin Ponds and Knob Hill Pond highlight the significance of rapid warming following the end of the YD relative to any reconstructed Holocene climate changes. The brevity of this change reflects the rapid response of the NE USA climate to the reinitiation of the AMOC and the continued increase in atmospheric CO2 during the YD. No-analog assemblages of short-lived mixed boreal forests were likely responding to the rapidly shifting climate at this time.
Although the VT climate changes reconstructed by the MAT for the remainder of the Holocene were less than the calibration RMSE, shifts in the location of modern analog sites for Twin Ponds highlight climatic trends that are replicated by other paleoclimatic studies. The Early Holocene modern analogs reflect a common regional trend in the NE USA of warm, dry conditions between 11.0 and 8.5 cal ka BP, followed by a prominent increase in precipitation. High percentages of T. canadensis between 9.0 and 5.7 cal ka BP are not found in the modern analog data set and imply the extension of no-analog assemblages into the Mid-Holocene. The modern analogs between 5.7 and 4.0 cal ka BP suggest cooler temperatures and increased precipitation that are replicated in other northern records but represent a divergence from southern New England records. Additional paleoclimatic proxies are needed to confirm the VT pollen-based reconstructions, but the modern temperature sensitivity of T. canadensis in the northern part of its range supports the possibility that colder temperatures contributed to its Mid-Holocene decline. Comparisons with records to the east and west of VT show similar trends until ca. 2.5 cal ka BP, when precipitation trends at Lost Pond become more similar to those from southern New England, suggesting the onset of the modern southwest–northeast regional precipitation gradient.
Acknowledgments
This research was supported by NSF grant no. 1738748 to LDG (RII-Track 4: “Paleoecological Insights into the Impacts of Climate Change on Vermont Lakes”). We thank two anonymous reviewers and the associate editor for very helpful suggestions and edits that have greatly improved this paper.
Data Availability
The Twin Ponds pollen data, chronology, and LOI data will be available on the Neotoma Database (https://www.neotomadb.org).
Supplementary Material
The supplementary material for this article can be found at https://doi.org/10.1017/qua.2023.28