I. INTRODUCTION
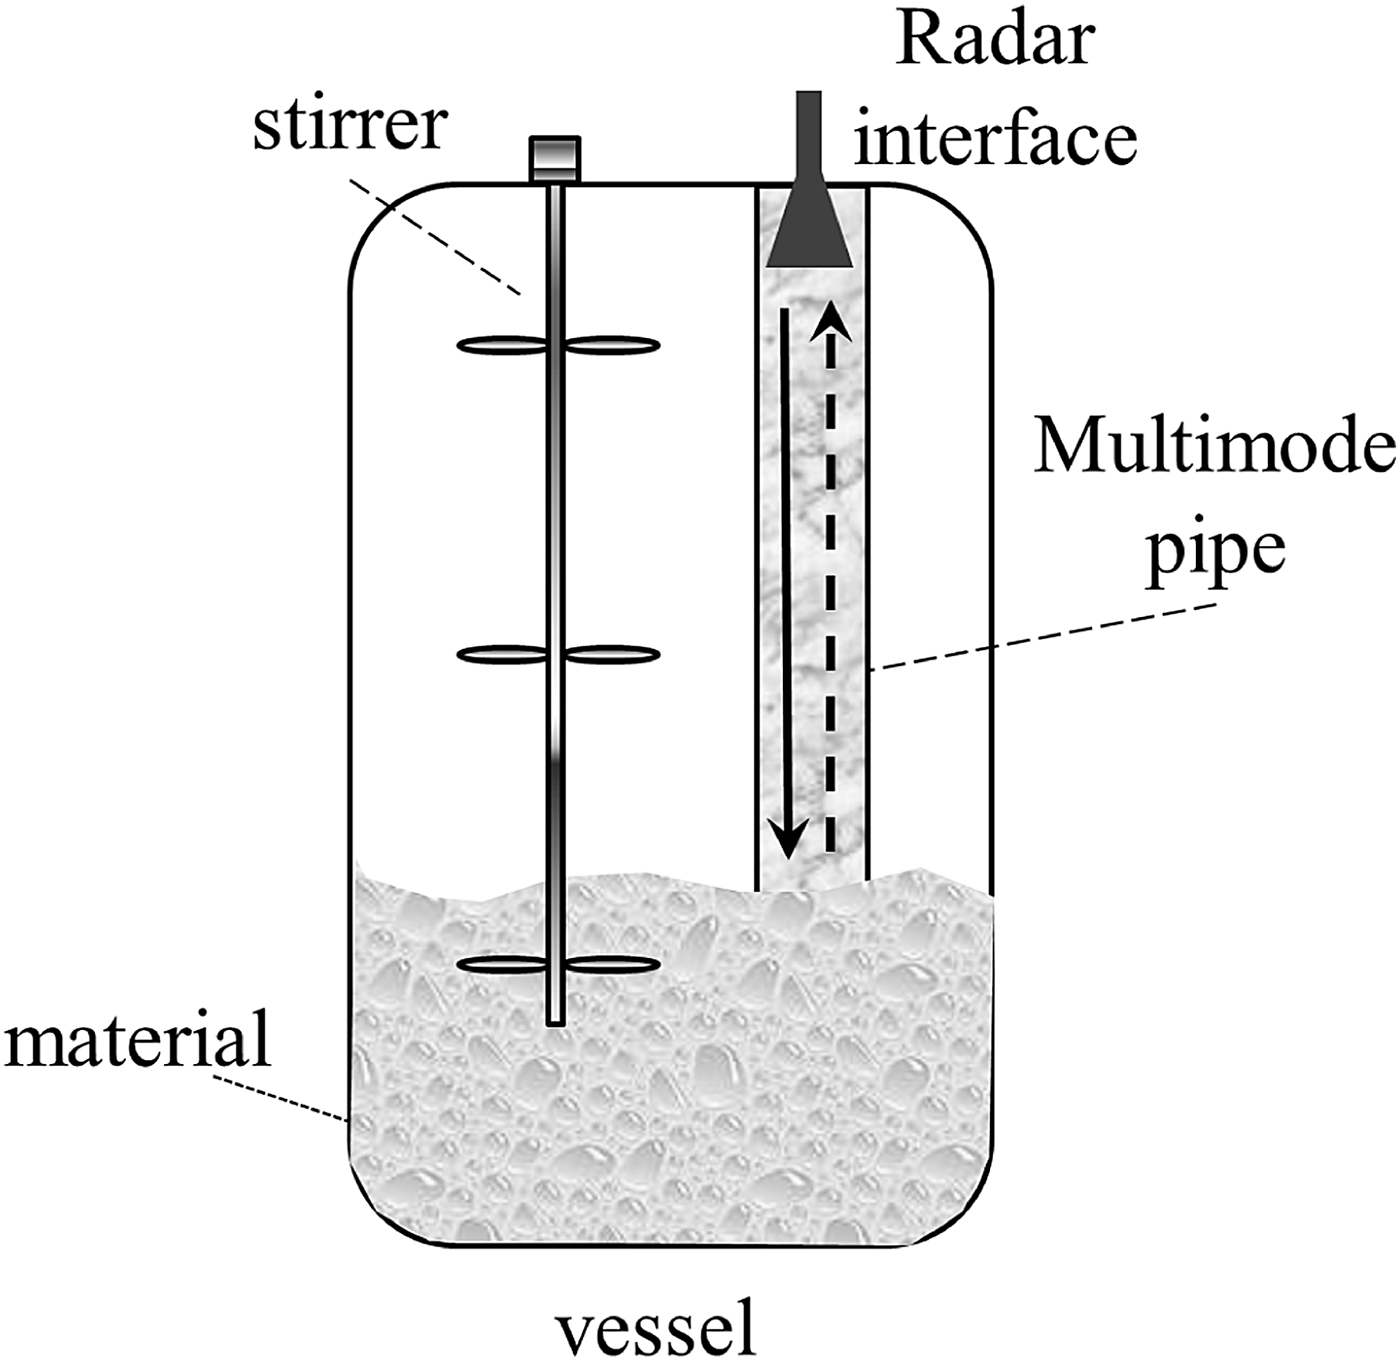
During the last decade radar has become one of the standard methods for continuous level measurement in process or storage tanks in the industrial field of process automation [Reference Kielb and Pulkrabek1]. Being a non-contact method and nearly insensitive to pressure and temperature variations, radar sensors have notable advantages compared to many other continuous level measurement devices, e.g. differential pressure sensors or ultrasonic devices. In a considerable number of process tanks, where there is foam or heavy turbulences, metallic stilling tubes or bypass tubes are installed for level measurement (Fig. 1). Typical diameters of these tubes range from 4 to 10 in. and thus span several wavelengths for the typical sensor frequencies 6, 10, and 25 GHz. For radar-based level measurement these tubes behave like overmoded waveguides, in which the radar signal propagates in the form of several possible propagation modes with different group velocities. Therefore, the received signal and the derived level measurement are disturbed by mode dispersion. With continuously increasing requirements for measurement accuracy solving the mode dispersion problem is an on-going research and design topic [Reference Pohl, Gerding, Will, Musch, Hausner and Schiek2, Reference Armbrecht, Denicke, Pohl, Musch and Rolfes3]. Solutions are found either in special signal processing or in mode selective radiation structures. Additional challenges for possible solutions are substantial discontinuities in the tubes caused by slots, holes, flanges, or welded joints, which differently influence the propagating modes.
Radar level measurement system using a multimode circular pipe.

With its magnetic field being longitudinal at the tube wall and no current density at the wall in longitudinal direction, the TE01 mode is less sensitive to discontinuities and guarantees the lowest attenuation factor among the complete set of modes. These properties make the TE01 the most suitable mode for accurate level measurement applications. In [Reference Pohl, Gerding, Will, Musch, Hausner and Schiek2] a mode launcher with high preservation of the TE01 mode was demonstrated. Mode converters are devices that convert an incoming wave (typically a TEM mode from a coaxial interface) to the wanted output waveguide mode, which is the TE01 mode for this special application.
To support the design and testing procedures of mode converters/launchers for oversized pipes in radar level measurements, producing companies require efficient and complete characterization methods of the mode content excited in the waveguide by the mode launcher, with particular focus on TE0n-type modes. The testing method must prove that the mode launcher is able to generate the TE01 mode with the highest purity by providing negligible amplitude coefficients for the other possible modes. This condition is necessary to reduce unwanted effects during the level detection at the material interface (mode mixing). For the application at hand, we considered liquid materials that offer the incoming wave a flat surface. This results very low spurious modes generated at the material interface.
Obsolete waveguide analysis techniques do not allow a complete description of the mode content of a multimode pipe and their limitations are discussed in the next section.
In this paper, a non-intrusive full characterization method of multimode waveguides is presented, particularly suitable for easily testing fabricated mode launchers. The method is based on a direct extrapolation of the correlation functions of the single modes from measured near-field patterns at the open end of the excited multimode pipe. The technique can be performed easily and cheaply with standard near-field measurement equipment. Through test simulations with ideal mode distributions and experimental validation using an overmoded waveguide supporting a maximum number of 96 modes in the range 4–8 GHz, the accuracy of the method to extract the mode composition is proven.
II. EXISTING MULTIMODE WAVEGUIDE ANALYSIS METHODS
As mentioned in the previous section, several techniques for the extrapolation of the mode content in multimode structures have been developed through the years.
The so-called multiple-probe scanning techniques, presented in [Reference Forrer and Tomiyasu4–Reference Baird, Roper and Grow8], are basically implemented using a considerable number of field probes intrusively inserted along the sidewalls of the overmoded waveguide to determine the amplitude and phase of the single components of the modes to be extracted. The information retrieved from the probes at different element locations are used to extract the propagating modes through several post-processing methods. The critical point of those techniques is the maximum number of the detectable modes, which is directly proportional to the number of used probes (m at the broad walls, n on the narrow walls in rectangular waveguides) and thus to the complexity and costs of the system.
Selective-coupling methods were described in [Reference Beck9, Reference Lewis10] and are based on the use of additional waveguides called “mode couplers” mounted on the sidewalls of a main overmoded waveguide. The single-mode coupler could extract a specific mode from the main waveguide through some opportunely sized and distanced coupling holes. To extract at most N modes from the overall signal in the waveguide under test, N mode couplers must be integrated in the structure under test. This limits the maximum number of detectable modes to five or six.
Techniques based on the analysis of field patterns have also been reported in literature. The methods presented in [Reference Lorbeck and Vernon11–Reference Mitrofanov, Tan, Mark, Bowden and Harrington15] rely on the comparison between pre-calculated and measured near- and far-field patterns from open-ended or drilled overmoded waveguides.
Some other techniques based on the analysis of measured scattering parameters have also been developed. Examples are the methods based on measurement of absorption resonances using a shorted movable piston [Reference Klinger16] and based on the determination of some mode coupling factors A mn between two antennas inserted in the overmoded waveguide [Reference Nikitin, Stancil, Cepni, Xhafa, Tonguz and Brodtkorb17].
The main drawbacks of all these methods are their intrusive nature (holes, through-the-wall probes) and also the very limited amount of modes that can be determined without dramatically increasing the mechanical complexity of the measurement system. A solution that allows a simple full determination of the mode content would be preferred.
III. NEAR-FIELD CORRELATION-BASED MODE ANALYSIS
The mode extrapolation technique that we propose in this work is based on a direct extrapolation of the correlation coefficients through mode orthogonality at the open-end aperture of an overmoded circular pipe to characterize mode converters. The novelty of the proposed approach is the use of a non-intrusive probe and the well-known mode matching technique as a simple and effective solution that overcomes the main limitation of previous methods, namely the maximum number of detectable modes. Indeed, the proposed approach allows the extraction of all possible propagating solutions from a near-field scan of the waveguide open end along two orthogonal polarizations. Furthermore, compared to the complex mechanical architectures required by the previous approaches, this approach requires only a standard planar near-field scanning setup. In this section, the mathematical basics of the method are presented.
A) Mode-correlation from a continuous near-field pattern
In the last few years, spatial correlation functions have received particular attention and have played an important role in the analysis of many communication systems such as multi-element antenna systems and adaptive arrays.
The mode-content extrapolation method proposed in this work applies the correlation technique to the analysis of overmoded waveguides for testing mode converters and it is based on the calculation of the correlation factors between each of the possible propagating modes (here referred as test modes) and a measured near-field distribution across an integration domain represented by the transversal section of an open-ended overmoded waveguide. In the specific case, circular pipes have been analyzed, but the technique can be extended to any possible transversal shape.
Equations (1) describe the transversal components of the electric and magnetic fields propagating along the positive z-direction in terms of  $\overrightarrow f _{mn}^{TE} $ and
 $\overrightarrow f _{mn}^{TM} $, defined as normalized structural functions for the TEmn and TMmn test modes:
 $$\overrightarrow E _{mn}^{TE}=A_{mn} \sqrt {Z_{mn}^{TE} } \left({\widehat z \times \overrightarrow f _{mn}^{TE} } \right)\exp \lpar \!-\! j\beta _{mn} z\rpar \comma \; $$
 $$\overrightarrow H _{mn}^{TE}=\displaystyle{{A_{mn} } \over {\sqrt {Z_{mn}^{TE} } }}\overrightarrow f _{mn}^{TE} \exp \lpar \!-\! j\beta _{mn} z\rpar \comma \; $$
 $$\overrightarrow E _{mn}^{TM}=B_{mn} \sqrt {Z_{mn}^{TM} } \overrightarrow f _{mn}^{TM} \exp \lpar \!- \!j\beta _{mn} z\rpar \comma \;$$
 $$\overrightarrow H _{mn}^{TM}=\displaystyle{{B_{mn} } \over {\sqrt {Z_{mn}^{TM} } }}\left({\widehat z \times \overrightarrow f _{mn}^{TM} } \right)\exp \lpar \!-\! j\beta _{mn} z\rpar \comma \; $$
where Z mnTE, A mn and Z mnTM, B mn are the wave impedances and amplitudes of the TEmn and TMmn modes. The structural functions are in the form of products of cosine functions in the case of rectangular waveguides, products of cosine and Bessel functions in the case of circular waveguides, products of cosine and Mathieu functions for elliptical waveguides.
The correlation between the ith mode, described by its normalized structural function  $\overrightarrow f_{i}$, and the mode composition under test
 $\overrightarrow g$, can be expressed as in (2) in the case of a circular waveguide:
 $$\left\langle \overrightarrow {f}_{i}\comma \; \overrightarrow g ^{\ast} \right\rangle = \vint_{\rho=0}^r \vint_{\phi=0}^{2\pi } \overrightarrow {f}_i \left(\rho\comma \; \phi \right)\cdot \overrightarrow g ^{\ast} \lpar \rho\comma \; \phi \rpar \rho d\phi d\rho \comma \; $$
where ρ and ϕ are, respectively, the radial and angular coordinates in a cylindrical system and r is the radius of the waveguide. The ideal existence condition of the ith mode in the multimode composition is given by (3).
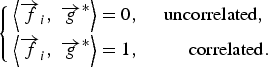 $$\left\{\matrix{\left\langle \overrightarrow {f}_i\comma \; \overrightarrow {g} ^{\ast} \right\rangle = 0\comma \; \quad {\rm uncorrelated }\comma \; \hfill \cr \left\langle \overrightarrow {f}_i\comma \; \overrightarrow {g} ^{\ast} \right\rangle=1\comma \; \hfill \quad {\rm correlated} .} \hfill \right.$$
B) Mode-correlation from a discrete near-field pattern
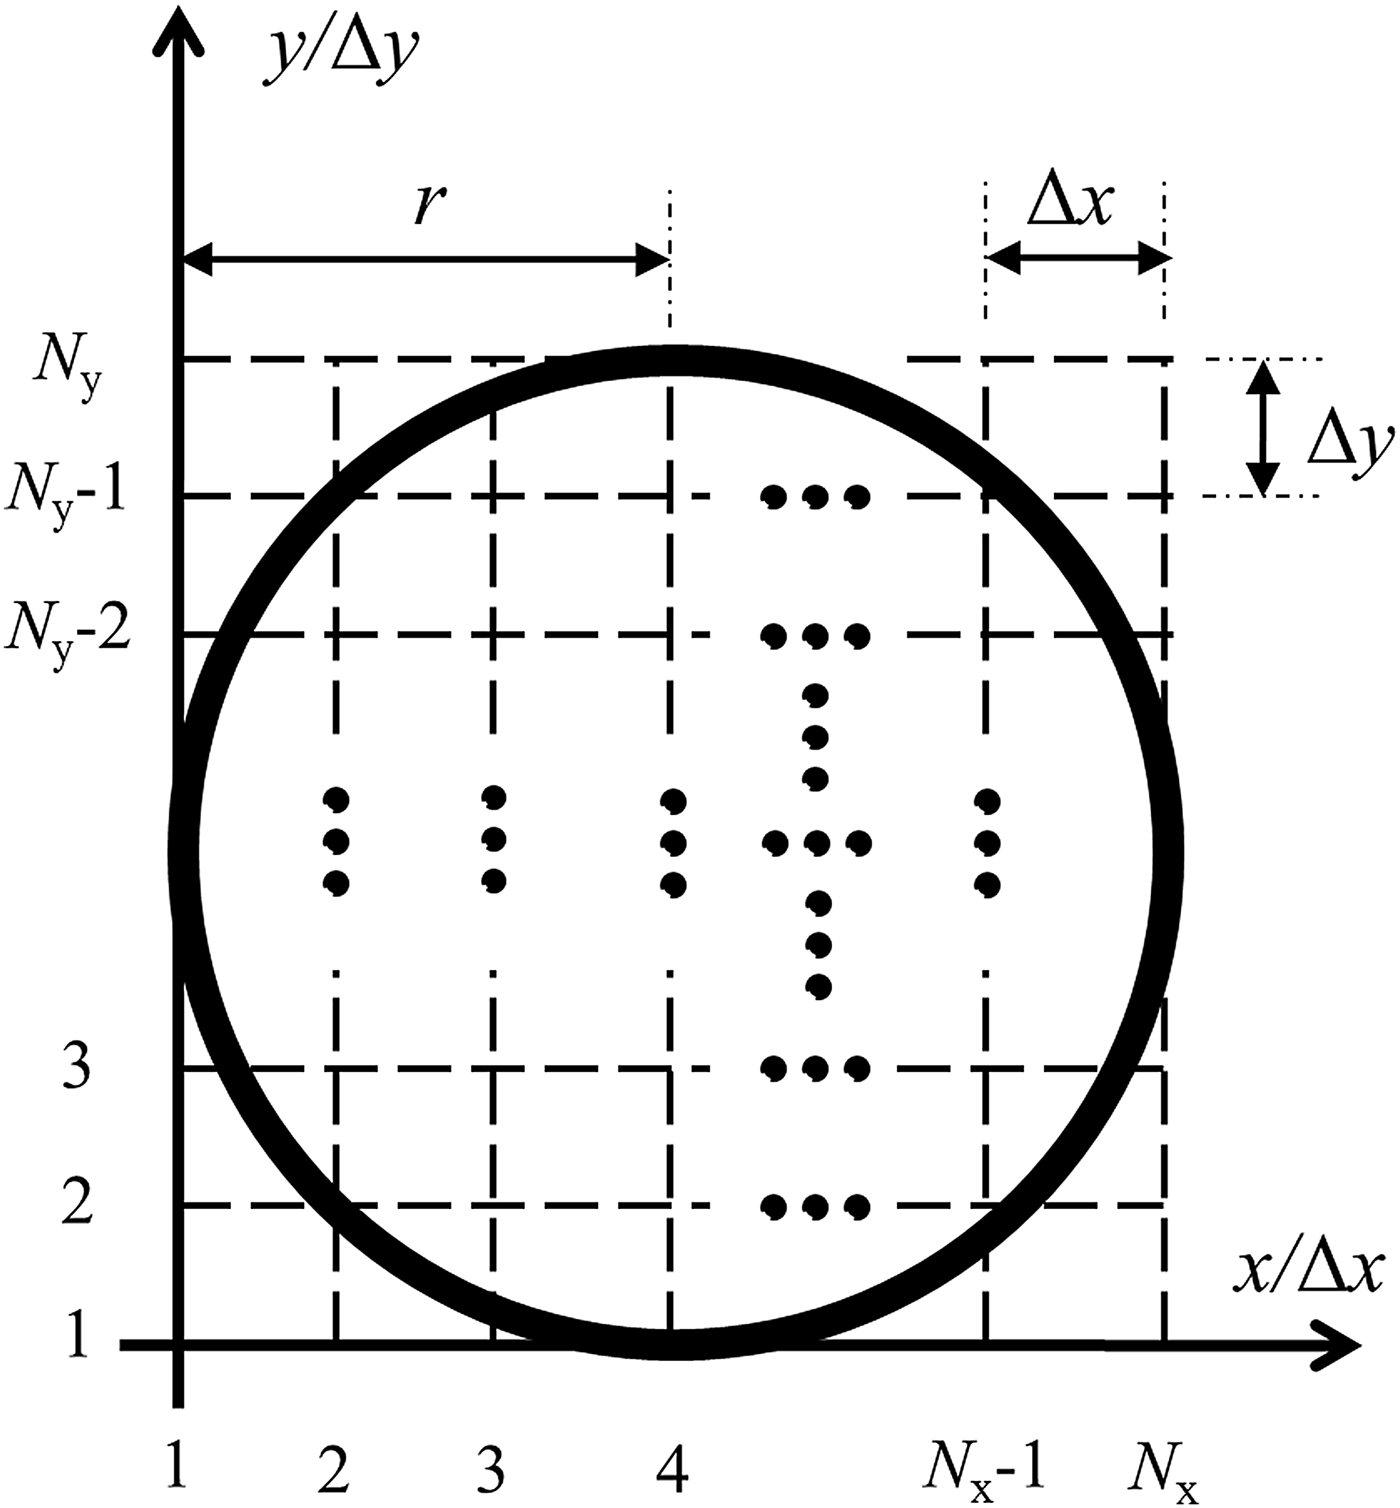
The extrapolation of the correlation factors on a continuous transversal domain is not realizable in practice. The main reason is that only discrete near-field scans can be performed. The maximum grid density depends on the resolution of the probe that is used to determine amplitude and phase, point by point, of the measured waveguide aperture pattern. The Cartesian gridding scheme for a near-field scan of a circular aperture of radius r is shown in Fig. 2. The square grid has dimensions 2r × 2r, N x × N y total points, an x-period equal to Δx and a y-period Δy. The integral in (2) becomes, in the discrete domain, a summation on the points forming the rectangular grid. Being  $\overrightarrow F_{TE_{mn\comma a} } $ and
 $\overrightarrow F_{TE_{mn\comma b} } $ the normalized structural functions for the even and odd degenerate modes of type TEmn in the discrete spatial domain, the correlation for those modes can be calculated as in (4):
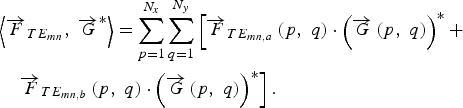 $$\eqalign{& \left \langle \overrightarrow {F} _{TE_{mn} }\comma \; \overrightarrow G ^{\ast} \right \rangle=\sum\limits_{p=1}^{N_x } \sum\limits_{q=1}^{N_y } \left[\overrightarrow {F} _{TE_{mn\comma a} } \left({p\comma \; q} \right)\cdot \left(\overrightarrow {G} \left({p\comma \; q} \right) \right)^{\ast} + \right. \cr & \quad \left. \overrightarrow F_{TE_{mn\comma b} } \left({p\comma \; q} \right)\cdot \left(\overrightarrow {G} \left({p\comma \; q} \right) \right)^{\ast} \right].}$$
Near-field scanning grid for the circular waveguide.
The quantity  $\overrightarrow G $ in (4) represents the discrete scanned pattern during the near-field measurement. Equation (5) reports the respective discrete correlation for the TMmn modes:
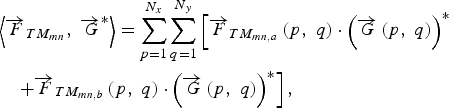 $$\eqalign{& \left \langle {\overrightarrow F_{TM_{mn} }\comma \; \overrightarrow G ^{\ast} } \right \rangle=\sum\limits_{p=1}^{N_x } {\sum\limits_{q=1}^{N_y } {\left[{\overrightarrow F_{TM_{mn\comma a} } \left({p\comma \; q} \right)\cdot \left({\overrightarrow G \left({p\comma \; q} \right)} \right)^{\ast} } \right.} } \cr & \quad \left. +{\overrightarrow F_{TM_{mn\comma b} } \left({p\comma \; q} \right)\cdot \left({\overrightarrow G \left({p\comma \; q} \right)} \right)^{\ast} } \right],} \;$$
where  $\overrightarrow F_{TM_{mn\comma a} } $ and
 $\overrightarrow F_{TM_{mn\comma b} } $ are the normalized structural functions for the even and odd degenerate modes of type TMmn.
The ith discrete structural function  $\overrightarrow {F}_i $ must be calculated from a power normalization of the discrete test fields with respect to a coefficient τ i, derived in the next paragraph. The region of interest for the fields and the structural functions is located within the circular aperture of the waveguide. Therefore, the values of the structural functions at points of the grid outside the waveguide aperture are set to zero. The condition for the existence of the ith mode in the tested discrete pattern is similar to (3) and it is shown in (6). In this case, considered that the internal product between the test mode and the discrete tested pattern is realized using a finite number of points instead of a continuous integration domain, the correlation factors of the uncorrelated modes tends to be extremely close (but not exactly equal) to zero.
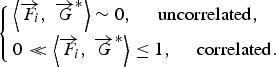 $$\left\{\matrix{\left \langle {\overrightarrow F\!\!_i\comma \; \overrightarrow G ^{\ast} } \right \rangle \sim 0\comma \; \quad {\rm uncorrelated\comma \; } \hfill \cr 0 \lt\!\!\!\lt \left \langle {\overrightarrow F \!\!_i\comma \; \overrightarrow G ^{\ast} } \right \rangle \leq 1\comma \; \quad {\rm correlated} .} \right.$$
C) Power normalization of the structural test functions
An equally weighted calculation of the correlation factors of all test modes is required for a reliable evaluation. It can be obtained through a power normalization applied to the test electric fields with respect to a coefficient τ i. Referring to the definitions of power associated to TEmn and TMmn modes in a circular waveguide given in [Reference Collin18], it is possible to derive the power normalization factor as in (7) for the mode TEmn and as in (8) for the mode TMmn:
 $$\tau _{mn}^{TE}=\sqrt {{\displaystyle {1} \over {\Psi _{0m} }} {\displaystyle {\pi \omega \mu \beta _{mn}} \over {2k_{c\comma mn}^4 }} \left[\left({\chi _{mn}^{\prime} } \right)^2 - m^2 \right]\left[J_m \left(\chi _{mn}^{\prime} \right) \right]^2 \comma \;} $$
 $$\tau _{mn}^{TM}=\sqrt {{\displaystyle{1} \over {\Psi _{0m} }} \displaystyle{{\pi \omega \varepsilon \beta _{mn} } \over {2k_{c\comma mn}^4 }} \left({\chi _{mn} } \right)^2 \left[{J_m^\prime \left({\chi _{mn} } \right)} \right]^2 \comma \;} $$
where χmn and χ′mn are the nth root of a first-type Bessel function of order m and its first-order derivative, ω is the angular frequency, βmn and k c,mn are the propagation constant and the cutoff wavenumber of the mode, ɛ and μ are the electric permittivity and magnetic permeability of the filling material, J m and J′m are a first-type Bessel function of order m and its first-order derivative. The Neumann factor Ψ0m equals 1 if m = 0, otherwise it is equal to 2.
For the ith test mode with normalization factor τi, the discrete structural function can be written as in (9) in terms of electrical x- and y-components, respectively, E ix and E iy:
 $$\vec F_i\lpar x\comma \; \, y\rpar =\displaystyle{1 \over {\tau _i }}\left({E_{ix} \lpar x\comma \; \, y\rpar \hat x+E_{iy} \lpar x\comma \; \, y\rpar \hat y} \right).$$
IV. SIMULATION AND EXPERIMENTAL ANALYSIS
To perform the correlation-based mode extraction, the presented method has been implemented in a MATLAB [19] code in order to elaborate the near-field pattern data and to calculate the correlation coefficients of all possible modes. In the following, both results using ideal field distributions in an overmoded waveguide environment and experimental validation with near-field scanning of a real multimode circular pipe will be presented and discussed.
A) Mode content extraction from ideal field distributions
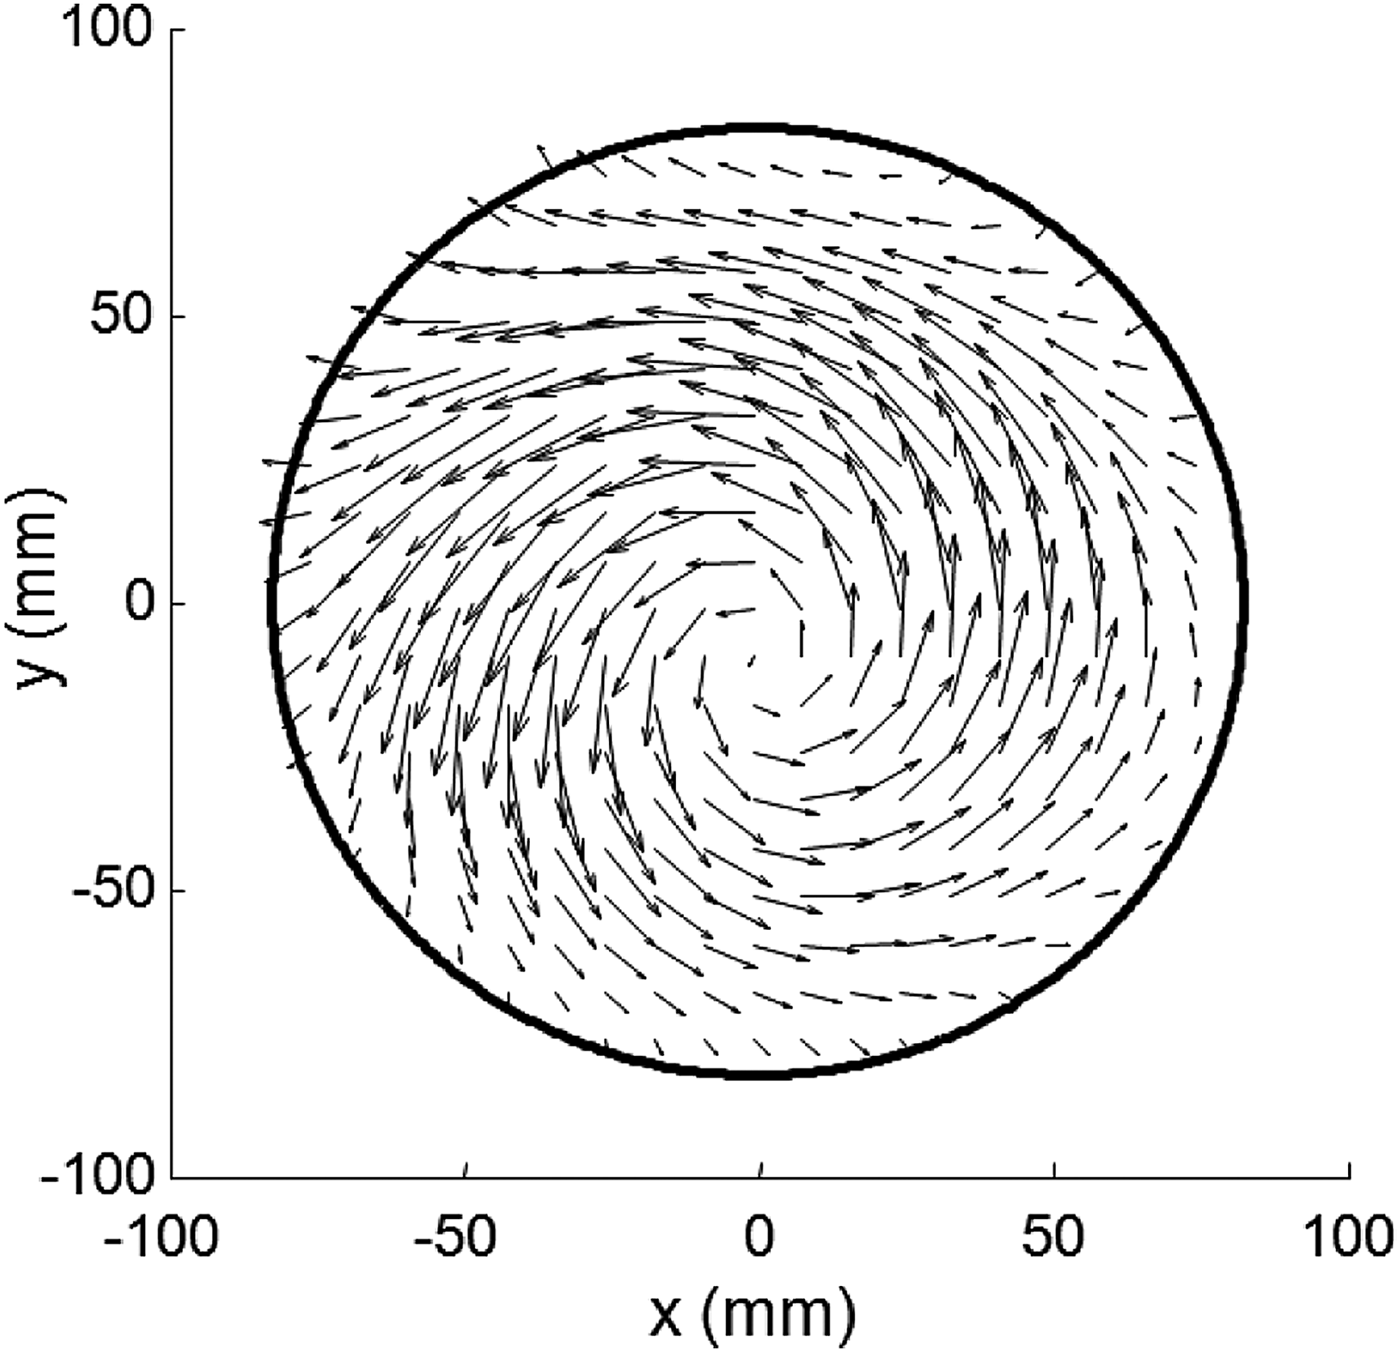
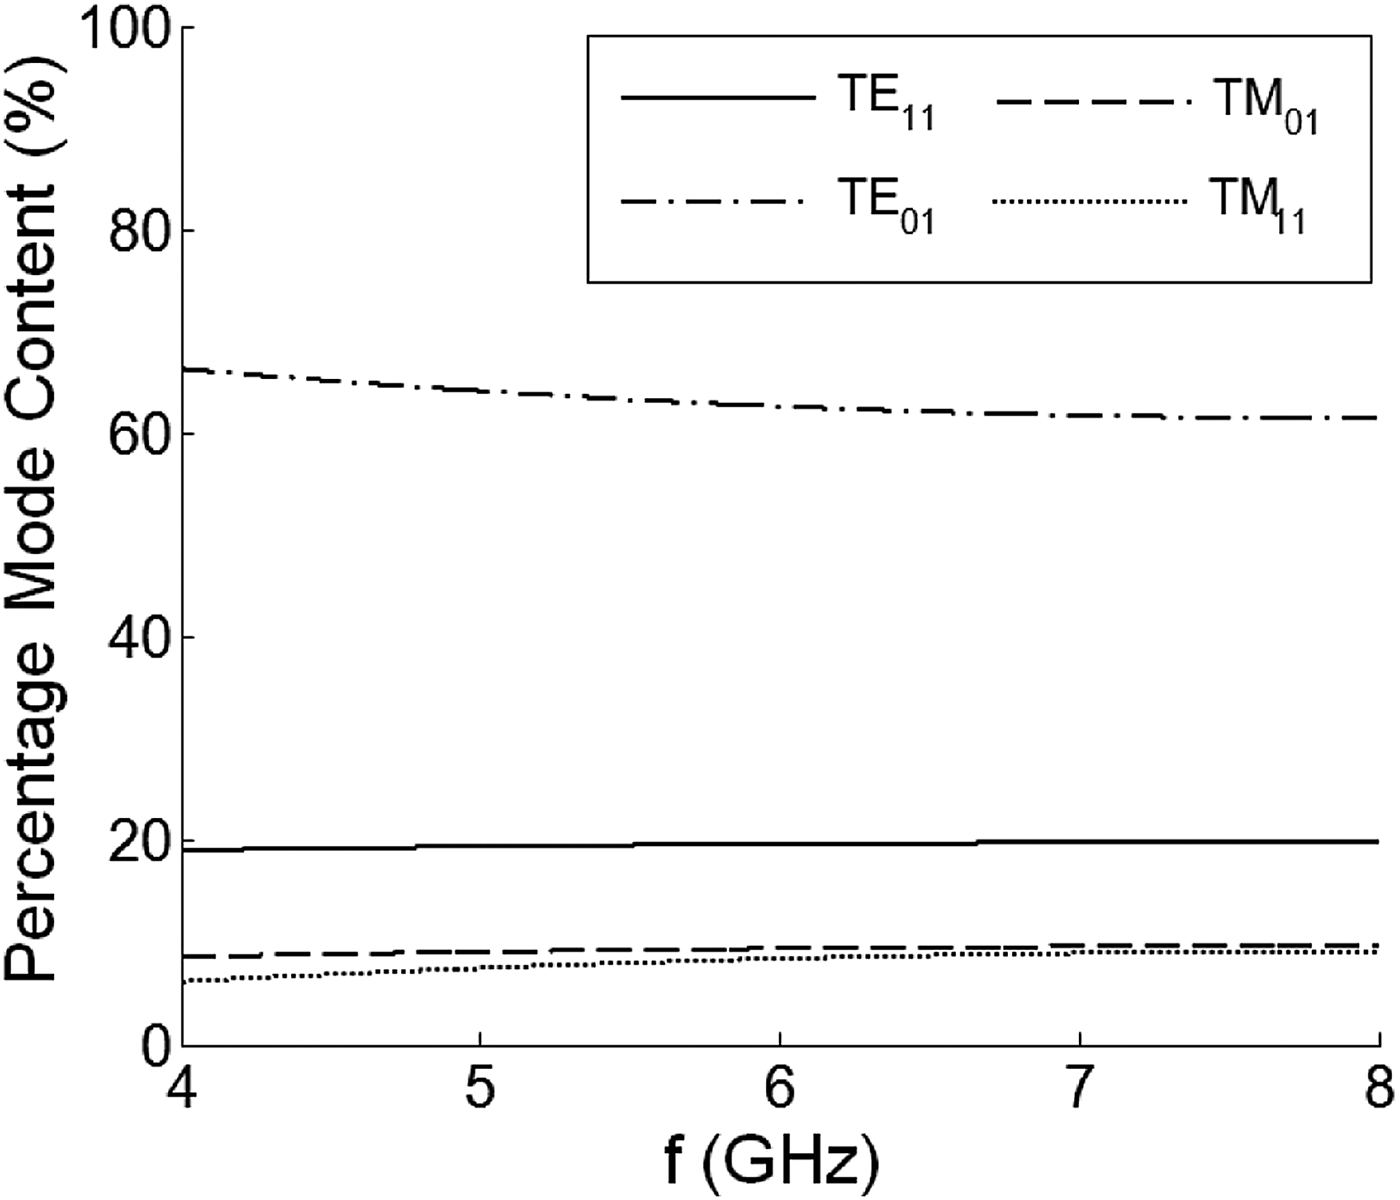
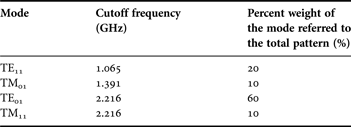
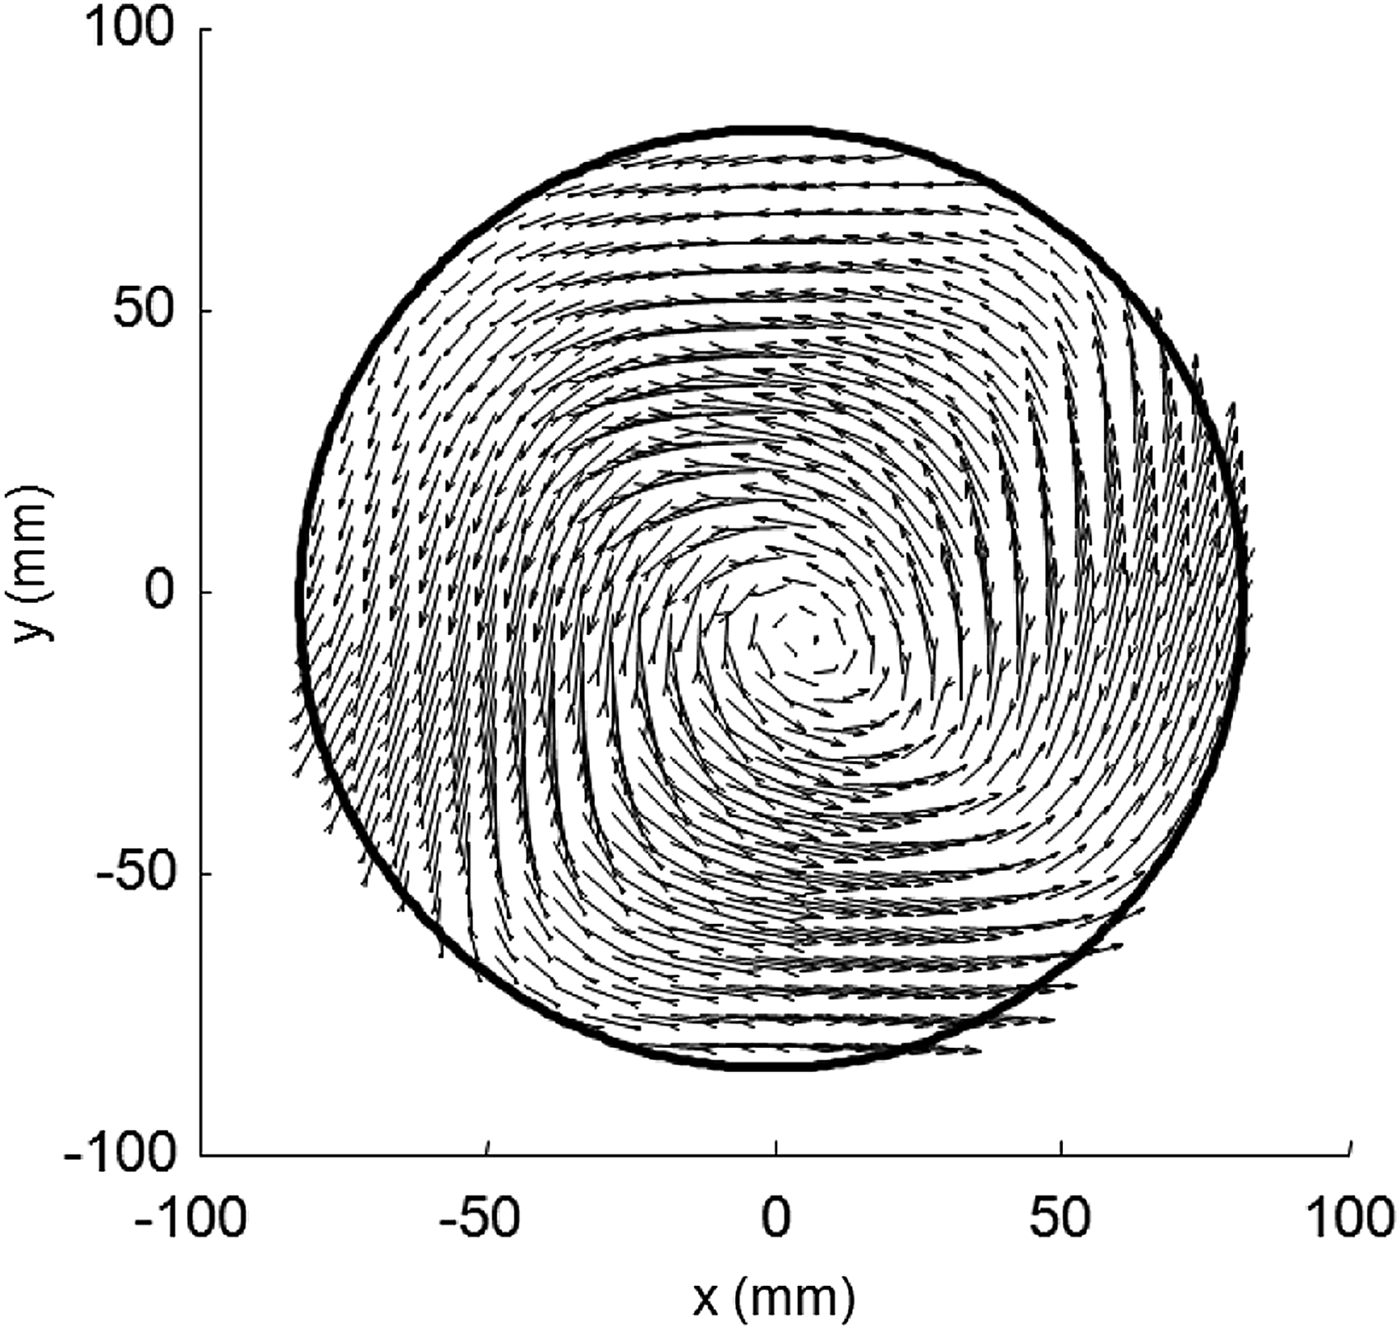
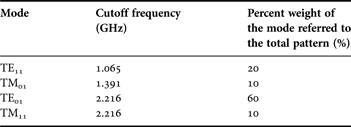
In order to verify the method, a test on an ideal random field distribution in a multimode waveguide has been carried out. The extrapolation has been performed inside a hollow circular waveguide of diameter d = 165 mm to determine the mode content from the superposition of some excited modes over a maximum of 96 possible supported propagating modes in the range 4–8 GHz, considering odd and even degenerations of order mn. As remarked in the previous sections, the mode TE01 is particularly interesting because it shows the lowest attenuation factor and the lowest sensibility to perturbations over the complete set of possible modes in an overmoded circular waveguide. The test has been performed exciting four ideal modes TE11, TM01, TE01 and TM11 in the range 4–8 GHz. The discrete grid step has been set to Δs = Δx = Δy = 2.5 mm. The mode weights of the tested ideal pattern have been set as an example according to Table 1. The resulting transversal vector electric field distribution at 8 GHz is reported in Fig. 3. The correlation-based technique allows the accurate determination of the percentage mode content in the waveguide in agreement with the expected mode content reported in Table 1, as shown in Fig. 4. In particular, the method is able to accurately characterize the less excited modes TE11, TM01 and TM11, even though their weights are much smaller than the dominant TE01. The remaining non-propagating modes have been extracted and show correlation close to zero and are hence not plotted in Fig. 4.
Near-field electric pattern in the overmoded waveguide at 8 GHz for the test with ideal modes.
Percentage mode content of the four-mode ideal pattern with a grid resolution of 2.5 mm along x and y: the extracted weights are in agreement with the expected values in Table 1.
Weight coefficients for the mode set under test.
As for the test with ideal field patterns, there is theoretically no limit to the accuracy, since the error would tend to exactly zero as the number of points in the grid tends to infinity. Equations (4) and (5) in the discrete spatial domain would tend, in this case to (2) in the continuous spatial domain. An amplitude error function could be defined for each tested mode, but this approach would be extremely complicated to represent since a relevant number N T of modes (in our case 96 considering each degeneration) are allowed to propagate. A univocal definition of the amplitude error is therefore needed to estimate the accuracy of the method as a function of the grid density. Being C i the extrapolated relative correlation in a finite discrete grid for the ith mode, M i the actual relative magnitude of the ith mode with respect to the pattern amplitude under test and N T the maximum number of theoretically supported modes, the percentage amplitude error of the extraction method can be univocally defined as in (10) in terms of root mean square error:
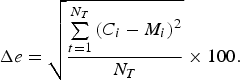 $$\Delta e=\sqrt {\displaystyle{{\sum\limits_{t=1}^{N_T } {\lpar C_i - M_i \rpar ^2 } } \over {N_T }}} \times 100.$$
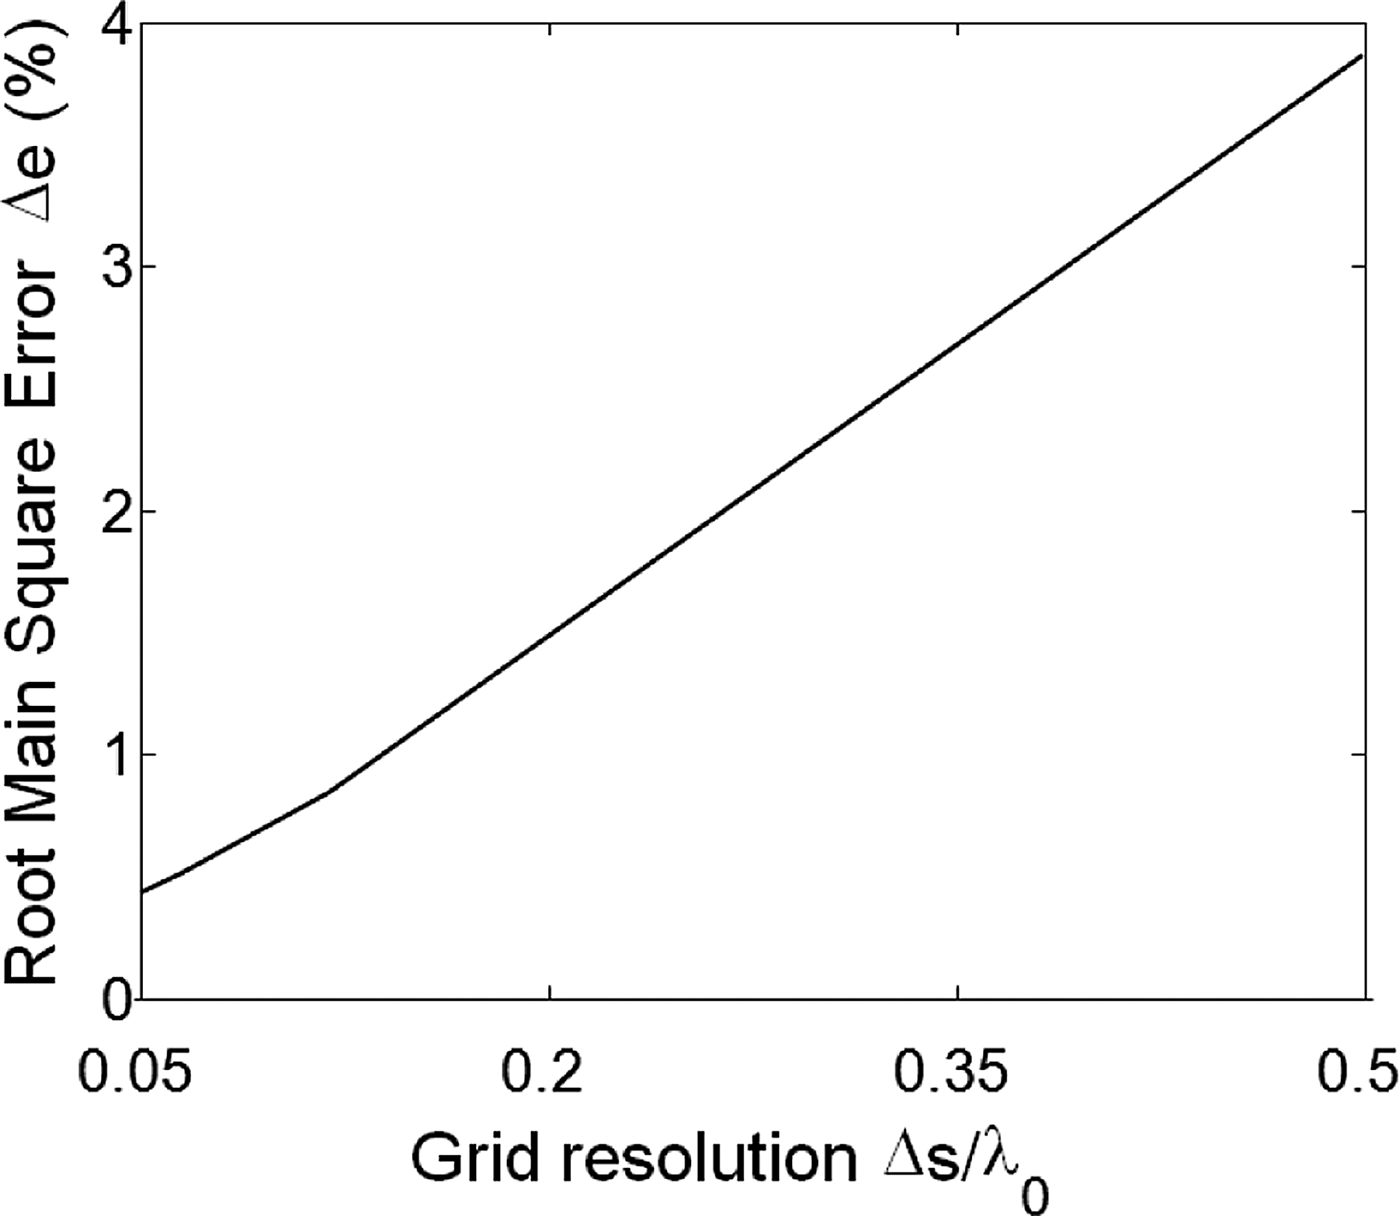
Figure 5 shows the amplitude error function for the tested pattern described in Section IV-A with the intent to show the variation of the extraction error in dependence of the grid resolution. A grid resolution Δs of 0.5λ 0 results in an overall amplitude error of 3.8%. As the grid resolution gets improved, the relative amplitude error is drastically reduced to a value of 0.5% for Δs = 0.05λ 0. A more general definition of the error function is difficult to be obtained, since the error is depending on many other factors characterizing a specific set of modes: the number of excited modes, the identity of the excited modes, the respective amplitude coefficients.
Amplitude error function of the extrapolation method for the field pattern with ideal modes.
B) Mode content analysis of measured near-field patterns
A set of measurements in the 4–8 GHz frequency range has been performed to extract and analyze the modes excited from a TE01 mode converter in a 1-m-long metal multimode pipe with a diameter of 165 mm. The measurements have been used to qualify the purity of the mode converters to excite only the TE01 mode in its operation frequency range from 5.8 to 6.8 GHz. Information on the architecture of the mode converter itself cannot be provided since they are confidential. It is however possible, to provide full-wave simulation results of the converter for comparison with the results from the presented experimental analysis.
A picture of the test setup is reported in Fig. 6. The electric field distributions at the open end of the pipe were measured using a near-field scanning probe. The resolution of the scanned grids on the x- and y-planes has been chosen equal to the best resolution of the probe presented in [Reference Russo and Menzel20], namely 2.5 mm. The mode content at each frequency is obtained by the amplitude and phase combination of the measured x-and y-field patterns. The measured field pattern at 5.8 GHz is depicted in Fig. 7.
Near-field measurement is set up to analyze a mode converter in a multimode pipe (1), with a diameter of 165 mm. The analyzed mode converter is mounted in the front-opening of the pipe (2). The field across the backside opening of the pipe (3) is analyzed with a near-filed scanning probe of the near-filed scanner in the background (4).
Scanned near-field electric pattern of the overmoded waveguide at 5.8 GHz to measure the modes excited by the mode converter.
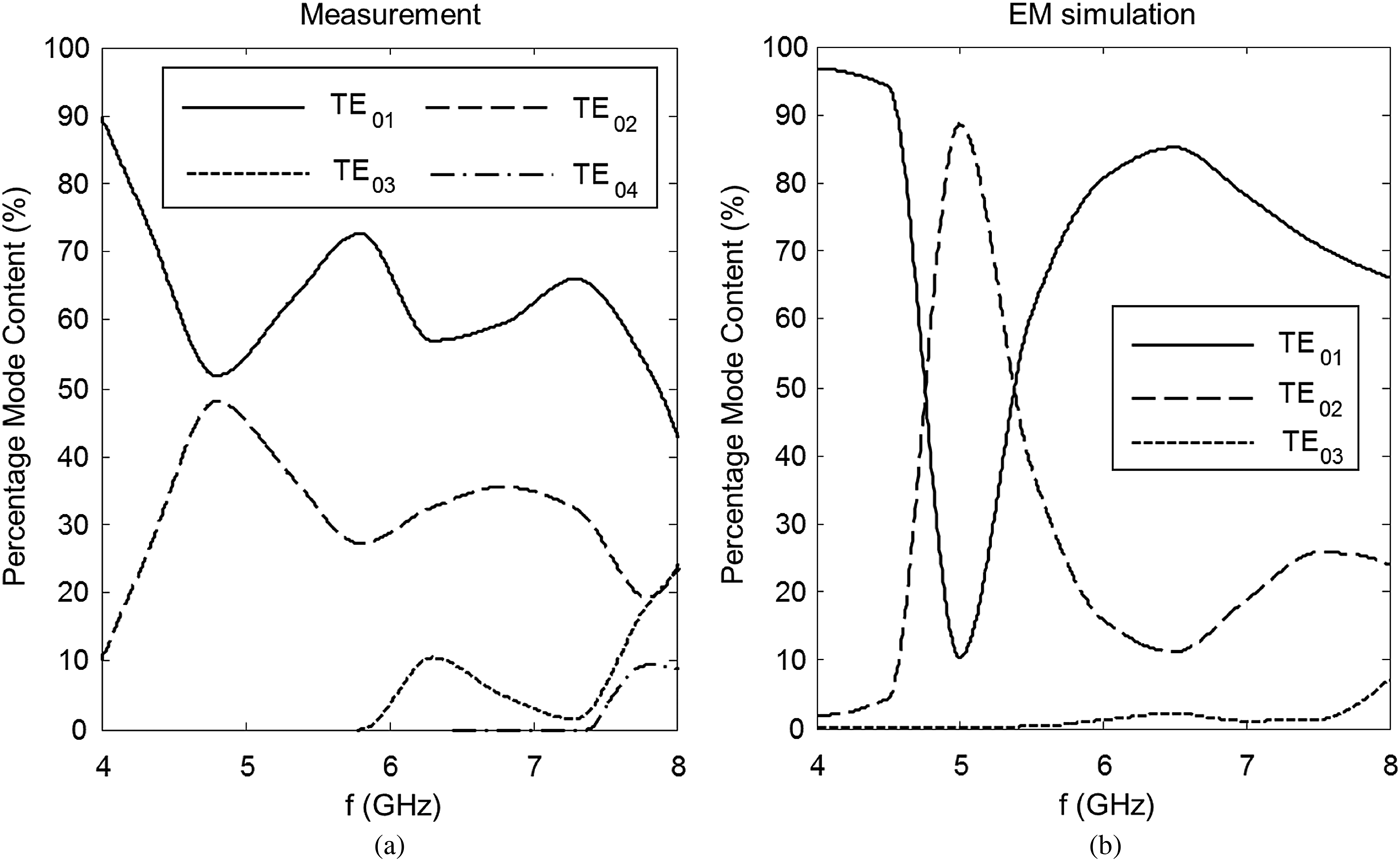
The results of a mode content analysis by near-field measurement using the presented method are shown in Fig. 8 in comparison with a mode analysis from electromagnetic (EM) full-wave simulation [21] of the mode converter. The mode converter itself and the discontinuities in the pipe excite the expected TE01-mode as well as many TEmn- and TMmn-type modes. The main excited modes, however, are the TE0n-type modes from TE01 until TE04. The weight values of the other TEmn and TMmn modes are not plotted in Fig. 8 since they show weight values close to zero. In the experimental analysis, the desired TE01 mode exhibits the highest weight value across the whole frequency range. As the TE02 mode starts to be stronger excited, the weight of the TE01 decreases with a local minimum at 5 GHz. In the full-wave simulation results this local minimum is much more significant and the TE02 mode is even locally higher than the TE01 mode. The reason for this difference between EM simulation and the experimental analysis could be identified in the losses in the real structure that reduce the quality factors of the TE02 mode excitation, which are not taken into account in the simulation. In the operation frequency range from 5.8 to 6.8 GHz, the TE01 is the dominant mode in both experimental analysis and EM simulation. The experimental analysis, however, reveals that the expected excitation level of the TE01 mode in the designated operation frequency band is disturbed by the excitation of the TE03 mode. This effect could be due to some manufacturing details of the structure, which are not modeled in the simulation. Above the cutoff frequencies of the higher order modes TE03 and TE04, the amplitude weight of the TE01 starts to decrease rapidly in experimental analysis and in simulation.
(a) Percentage mode content of a mode converter in a metallic stilling tube with 165 mm diameter analyzed by measurement using the presented method. (b) Percentage mode content obtained from EM simulation of the structure of the analyzed mode converter. Only the modes with relevant amplitudes, which are the TE0n modes, are plotted. From the EM simulation the TE04 mode was not available.
The example in Fig. 8 shows that, with the proposed analysis method, one can gain additional insight into the real behavior of mode converter structures and it is possible to verify and compare mode purity simulations directly with measurement based analysis.
V. CONCLUSION
In this work, a correlation-based technique to characterize the mode content of overmoded waveguides used in radar level measurements has been proposed. The method is based on the calculation of the spatial correlation between a set of test modes and a measured near-field pattern. The method has been first tested using known ideal field distribution. The technique has shown its capability to extract the exact number of modes propagating in the multimode environment as well as the weight of each mode with a total amplitude error ranging between 0.5 and 3.8% from an ideal near-field composition.
The method has been also used for the experimental characterization of a radar level measurement TE01-mode converter for overmoded circular pipes. As expected, the maximum extracted weight for the TE01 mode was determined for the designated frequency band of the mode converter, while the remaining part of the tested spectrum showed a stronger impact of higher order modes of type TE0n. In a comparison with the EM simulations of the mode converters, the presented analysis confirms the design concept but it also reveals differences between experiment and simulation, which can be used for further design optimizations.
Based on the low extraction error and simplicity of the measurement setup, the proposed technique can be used to easily determine the complete mode content in multimode waveguides with high accuracy. The correct knowledge of the mode set propagating in a multimode waveguide is a delicate aspect of the design and optimization of mode converters for radar level measurements in tubes.
ACKNOWLEDGEMENT
The Authors would like to thank Endress + Hauser GmbH + Co. KG for the provided hardware and Mr. Qi Chen for simulation support.
 Ivan Russo received the Laurea degree in Electrical Engineering from the University of Calabria, Cosenza, Italy, in 2003, the Laurea Specialistica degree in telecommunications engineering from the University of Calabria, Cosenza, Italy, in 2007 and the Ph.D. degree in Electrical Engineering from the University “Mediterranea” of Reggio Calabria, Italy, in 2011. From December 2010 until November 2011 he was with the Department of Microwave Techniques, University of Ulm, Ulm, Germany, where he worked on the design of high-resolution near-field probes and analysis techniques for overmoded waveguides. Since December 2011 he is with the Institute for Microwave and Photonic Engineering, Graz University of Technology, Graz, Austria, as University Assistant. His main interests are focused on modeling of QO amplifiers, active FSSs, efficient beam-forming networks for antenna arrays, and UWB SiGe amplifiers, spherical near/far-field transformations, wideband and ultra-wideband antennas.
 Winfried Mayer received the Dipl.-Ing. (BA) degree in communication technology from Berufsakademie Ravensburg, Germany, in 1994 and Dr.-Ing. degree from the University of Ulm, Germany, in 2008. From 1994 to 2001 he was with EADS Deutschland Microwave Factory R&D. From 2002 to 2007 he was doing research on imaging radar sensors and digital beam-forming at the Institute of Microwave Techniques of the University of Ulm. Since 2007 he is with Endress + Hauser GmbH + Co. KG, Maulburg, Germany, responsible for pre-development in radar technology. He has design and system experience in the fields of microwave synthesizers, millimeter-wave modules, front-ends for sensor applications and system aspects of automotive and industrial radar sensors. His present research interests are low-cost and low-power technologies for millimeter-wave sensor front-ends as well as system innovations for future radar level sensors.
 Stefan Pflüger received the Dipl.-Ing. degree in information technology from the University of Ulm, Ulm, Germany, in 2011. From 2006 to 2010, besides his studies, he worked at Daimler AG, Ulm, in the area of wireless telematic systems. From 2011 to 2012, he was with Endress + Hauser Gmbh + Co. KG, Maulburg, Germany, working on the development of radar based level measurement sensors. Since May 2012, he is with EADS Deutschland GmbH. His interests focus on antennas and microwave systems, especially in the area of radar applications.
 Wolfgang Menzel received the Dipl.-Ing. degree in electrical engineering from the Technical University of Aachen, Germany, in 1974, and the Dr.-Ing. degree from the University of Duisburg, Germany, in 1977. From 1979 to 1989, he was with the Millimeter-Wave Department, AEG, Ulm, Germany [now the European Aerospace, Defense, and Space Systems (EADS)]. From 1980 to 1985, he was the Head of the Laboratory for Integrated Millimeter-Wave Circuits. From 1985 to 1989, he was the Head of the entire Millimeter-Wave Department. During that time, his areas of interest included planar integrated circuits (mainly on the basis of fine-line techniques), planar antennas, and systems in the millimeter-wave frequency range. In 1989, he became a Full Professor with the Department of Microwave Techniques, University of Ulm, Germany. His current areas of interest are multilayer planar circuits, waveguide filters and components, antennas, millimeter-wave and microwave interconnects and packaging, and millimeter-wave application and systems.