Laterite is a brownish-red, sticky soil enriched with iron, aluminium oxides and clay minerals. It is formed from its parent rock through laterization under humid and warm climatic conditions (Harder, Reference Harder1977; Nahon et al., Reference Nahon, Colin and Tardy1982; Rashid et al., Reference Rashid, Tabatabaei, Horpibulsuk, Mohd Yunus and Hassan2019). Owing to its use in brick-making, dam construction and as a natural foundation, laterite has become a valuable resource upon which people in tropical and subtropical regions depend for survival. Numerous scholars have extensively studied the genesis, mineral composition, water retention and structural physical and mechanical properties of laterite (Jin et al., Reference Jin, Zhen, Chen, Sun, You and Xiong2021; Pascoal et al., Reference Pascoal, Sagrilo, Baroni, Specht and Pereira2021). Laterite is increasingly recognized in the engineering field for its high water content, high liquid and plastic limits, high porosity, low density and low compressibility, as well as unfavourable characteristics such as its swell–shrink behaviour, fissility and water sensitivity. However, under the recurrent effects of rainfall and fluctuations in groundwater levels, the long-term serviceability of laterite-based engineering structures such as subgrades, cover layers and impermeable layers continues to encounter numerous challenges (He et al., Reference He, Zhang, Chen and Long2022). Thus, when laterite serves as a natural base or subgrade filler, it necessitates the addition of supplements such as cement, fly ash and biochar during its processing (Lim et al., Reference Lim, Yao, Jiang, Lim and Bakar2021) to enhance its strength and water stability, but the mechanisms of action of these additives remain unclear.
Studies indicate that the unique engineering properties of laterite are determined by the cementing action of colloidal oxides and the bonding forms of clay particles, which are closely related to their material composition and structure (Zhang & Kong, Reference Zhang and Kong2014). The diverse presence modes of colloidal oxides lead to various microstructures in laterite. Considering laterite’s high shear strength and low compressibility, some researchers propose that colloidal oxides are distributed on the surfaces of clay particles in a ‘coating’ form, creating stable conglomerate structures (Zeng, Reference Zeng1993); however, Zhang et al. (Reference Zhang, Kong and Wang2013) argue that the colloidal oxides among these particles exist as ‘weld spots’ or ‘bridges’, asserting that the resultant metastable flocculated structures fundamentally contribute to laterite’s high moisture sensitivity (i.e. strong response to changes in water content) and robust structural properties. These studies, based on the macroscopic manifestations of the physical characteristics and mechanical properties of laterite under specific conditions, have laid a solid foundation for accurately understanding certain special engineering properties of laterite. However, laterite typically has a complex microstructure, and hypotheses relating to features such as electrostatic attraction (Zeng, Reference Zeng1993), adsorption (Zhou & Liao, Reference Zhou and Liao2004; Jia et al., Reference Jia, Zaoui and Sekkal2025) and cementation bonds (Cheng, Reference Cheng1994), while they can explain the macroscopic physical and mechanical phenomena observed in experiments, lack corresponding microexperimental evidence and theoretical support. Previous studies have primarily qualitatively assessed the role of colloidal oxides by comparing changes in the physical and mechanical indices of laterite after adding or removing colloidal oxides (Tan et al., Reference Tan, Zhang, Li, Huang and Zhao2007). To date, direct observation and quantification of the interactions between colloidaloxides and clay minerals have not been possible, leaving the control mechanisms by which colloidal oxides affect the unique physical and mechanical properties of laterite unresolved for a long time. Grasping the aggregate structures that arise from interactions between colloidal oxides and clay particles is essential for controlling the particular physical and mechanical behaviours of laterite. However, due to the inherent chemical complexity of clay particles, characterizing and tracking the aggregation processes of clay particles face significant challenges, leading to limited knowledge of the aggregation processes of laterite on a microscopic scale.
Recently, molecular dynamics (MD) simulations and other nanogeochemical characterization and simulation technologies have advanced, offering effective means for investigating the interaction mechanisms between clay minerals and colloidal oxides at micro and nano scales. Cygan et al. (Reference Cygan, Liang and Kalinichev2004) developed the ClayFF force field specifically for clay minerals, and it has seen widespread use. The adsorption behaviours of metal ions and small molecules in clay minerals (Li, Reference Li2018) and the lattice expansion caused by the embedding of small molecules in clay minerals (Zhang et al., Reference Zhang, Liu, Gao, Li, Liu and Li2016) have been discussed, along with the effects of charge location, interlayer cations and temperature on the expansion of clay mineral crystals (Teich-McGoldrick et al., Reference Teich-McGoldrick, Greathouse, Jove Colón and Cygan2015). These simulations have effectively revealed characteristics such as high aggregation of interlayer crystalline water, high viscosity and low self-diffusion ability in clay minerals. Moreover, MD simulation techniques have been employed to explore the mechanical behaviours of geotechnical materials at the microscopic level. Atomic-scale mechanical behaviour simulations of clay mineral crystals indicate that the yielding and failure of these crystals are due to the absence of interlayer chemical bonds (Yang et al., Reference Yang, He, Chun and Gong2019). The number of bonds that break and their corresponding fracture sequences have been determined, and it has been observed that, in tensile and shear processes, as more bonds break and cracks form, there is a marked reduction in stress (Zhu et al., Reference Zhu, Shen, Shao and He2021). While MD simulations have been highly successful in detailing the structure of crystalline water, the electric double layer on clay mineral surfaces, the material transport and the mechanical behaviours of clay minerals, these results are confined to studies of idealized infinite clay films, leaving many critical structural and transport properties of the clay medium unaccounted for (Xu & Zheng, Reference Xu and Zheng2018; Cygan et al., Reference Cygan, Greathouse and Kalinichev2021). Indeed, clay particles frequently aggregate with other mineral components to form complex structures, and research on idealized infinite clay films fails to capture the special structural and environmental conditions inherent in natural clays.
Clay minerals feature intricately complex microstructures, with phenomena such as isomorphous substitution, lattice defects and edge surface protonation effects complicating the interactions between particles of clay minerals or colloidal oxides in natural laterite. Researchers have attempted to use MD simulation methods to study the interactions between nanoscale particles of clay minerals. The potential of mean force (PMF) was obtained for the face-to-face interactions between hydrated illite (IMt-1) and sodium montmorillonite, demonstrating that the PMF results are influenced by the migration of counterions in the interlayer spaces (Zhu et al., Reference Zhu, Whittle and Pellenq2022). Morisada et al. (Reference Morisada, Muranishi, Shinto and Higashitani2005) conducted MD simulations on large charged particles immersed in a NaCl solution using an implicit solvent model based on the PMF to study the distribution of ions around these large particles and the interactions between them. Simulations of the interactions between kaolinite nanoparticles in pure and saline water (Zen et al., Reference Zen, Bui, Tran, Tay, Chellappah and Collins2022) revealed highly anisotropic behaviour in the interactions among clay nanoparticles, varying from attraction to repulsion based on the relative orientations of the nanoparticles. This research also analysed the scope of the electrostatic effects and hydration. Furthermore, utilizing the PMF from interactions between clay nanoparticles to construct coarse-grained simulations with Gay–Berne potentials is an important method for understanding the aggregation and dispersion of clay sheets at the mesoscale (Ebrahimi et al., Reference Ebrahimi, Whittle and Pellenq2014).
In natural laterite, particles often form complex aggregates with other mineral components, making it crucial to understand the aggregate structures formed by the interactions between colloidal oxides and clay particles to control the unique physical and mechanical properties of laterite (Schwertmann, Reference Schwertmann1988). However, previous studies have primarily focused on the macroscopic physical and mechanical properties of laterite (Rozos & Koukis, Reference Rozos and Koukis1986), with limited exploration of the specific microscopic interaction mechanisms between colloidal oxides and clay minerals. The aforementioned MD simulations play an important role in understanding interactions among microscopic particles, offering new perspectives for studying the interactions between clay minerals and colloidal oxides in natural fills. Consequently, this article utilizes MD simulations, alongside umbrella sampling and the weighted histogram analysis method (WHAM), to compute the PMF for the interactions between montmorillonite particle faces and colloidal alumina particles, thereby elucidating the interaction mechanisms between colloidal alumina and montmorillonite in laterite. The results of this research provide a scientific basis and theoretical guidance for controlling the engineering properties of laterite and for the development of new laterite-based materials possessing significant scientific importance and application potential.
Simulation method
Model construction
During laterization, clay minerals such as montmorillonite, illite and kaolinite often engage in complex physicochemical reactions with iron and aluminium oxides, giving natural laterite its distinct physical and mechanical properties. This reseadrch utilizes MD simulations to specifically investigate the interaction mechanisms between colloidal alumina and montmorillonite in laterite.
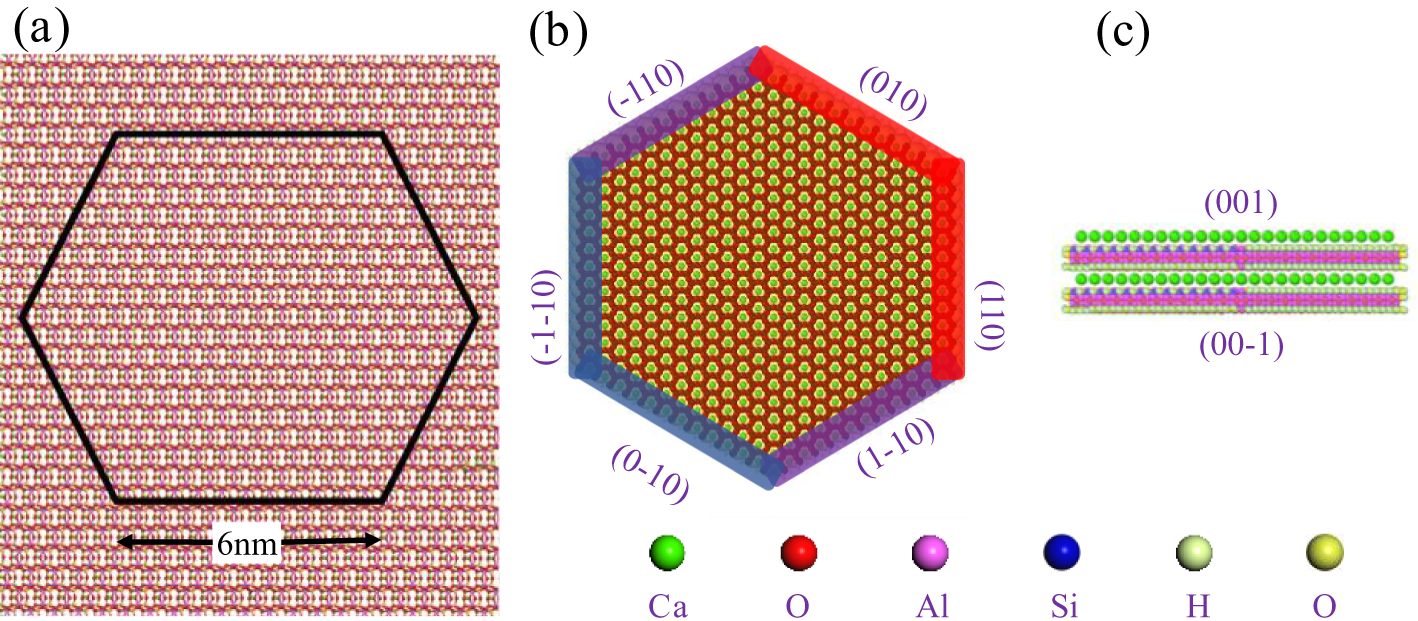
Montmorillonite is a typical TOT structure composed of two layers of tetrahedral silica (T) and a layer of octahedral alumina (O). To study the edge structure and electronic properties of montmorillonite, the method proposed by Lammers et al. (Reference Lammers, Bourg, Okumura, Kolluri, Sposito and Machida2017) was used to construct the edge surface. Initially, a rectangular Ca-montmorillonite model was created using Materials Studio software (Fig. 1a), followed by cutting the crystal structure (Churakov, Reference Churakov2006) along the so-called AC crystallographic direction, which is defined by the periodic bond chain theory (White & Zelazny, Reference White and Zelazny1988) as a primary growth direction based on the strongest bonding within the crystal. This cutting process forms a hexagonal montmorillonite crystal structure with a side length of 6 nm (Fig. 1b). As the edge surface of montmorillonite is created by cutting the montmorillonite crystal along the so-called AC chain, the atoms on the edge face are in a state of under-coordination. By simulating the edge surface repair process, the natural chemical properties of clay minerals can be modelled. Oxygen atoms are attached to under-coordinated edge metal atoms to repair the cut edge surfaces. The resulting edge surface features four different types of oxygen atoms: aluminol O atoms coordinated with octahedral Al atoms (≡Al–O), bridging O atoms coordinated with tetrahedral Si and octahedral Al atoms (≡Al–O–Si≡) and two types of silanol O atoms coordinated with tetrahedral Si atoms (≡Si–O). Finally, under near-neutral pH conditions, the edge oxygen atoms are protonated as expected. In particular, each of the two silanol O atoms (≡Si–O) receives a proton, the aluminol O atom (≡Al–O) undergoes double protonation and the bridging O atom (≡Al–O–Si≡) remains unprotonated (Bourg et al., Reference Bourg, Sposito and Bourg2007; Liu et al., Reference Liu, Chen, Sprik, Lu and Wang2014). It is important to note that when octahedral metal atoms are combined with OH2 functional groups, they usually engage in ligand exchange with neutral water molecules. Therefore, in this study, the OH2 functional groups at the clay edges were removed, and the remaining charge was transferred to the uncoordinated octahedral metal cations.
Modelling of montmorillonite particles. Montmorillonite particles with a side length of 6 nm are (a) cut from a rectangular montmorillonite sheet, along with (b) their edges and (c) a basal face.

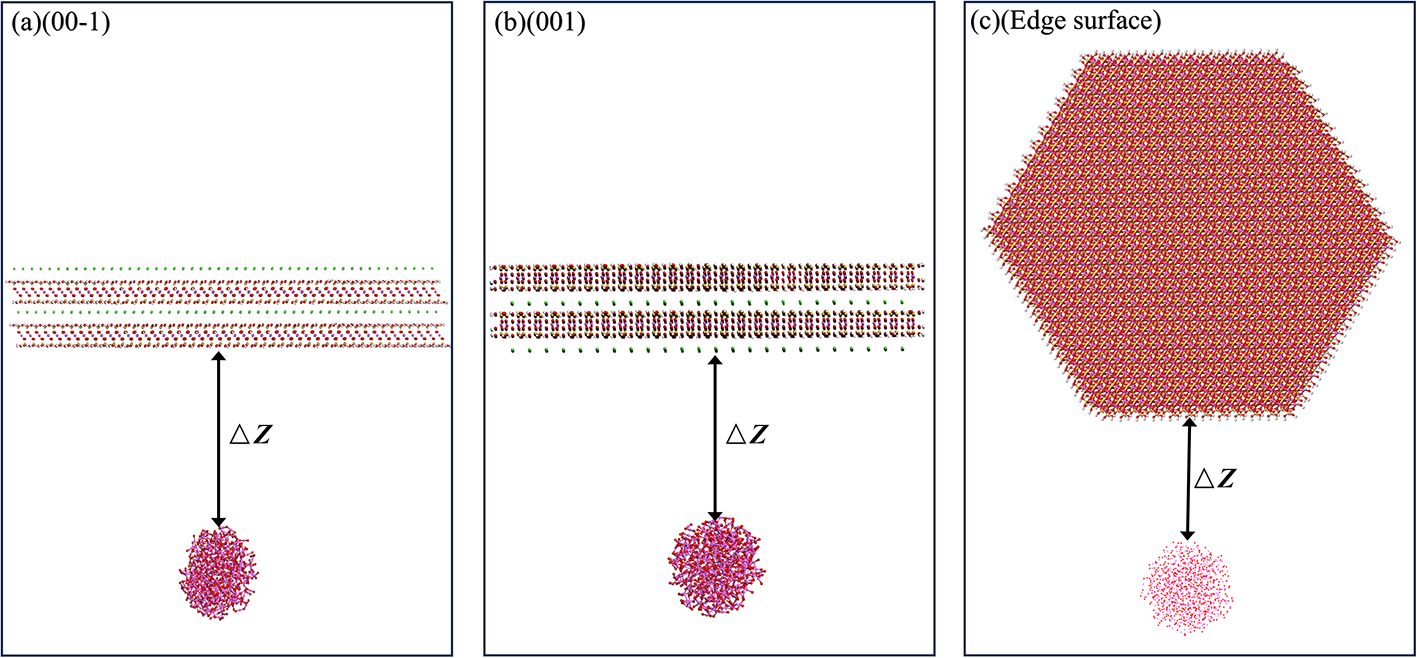
The montmorillonite particles resulting from this cutting had six edge faces and two basal faces: edge faces (-110), (010), (110), (1-10), (0-10) and (-1-10) and basal faces (001) and (00-1). Detailed analysis of the six edge faces revealed that some are remarkably similar (Fig. 1b): (010) resembled (110), (0-10) resembled (-1-10) and (1-10) resembled (-110). Hence, only three pairs of non-equivalent edge faces could be distinguished. Therefore, a representative edge from each equivalent category was selected to simulate the interaction process between different basal and edge faces of montmorillonite with alumina, namely (010), (1-10) and (0-10). Amorphous colloidal alumina was constructed into a spherical structure with a diameter of 3 nm using the Packmol program. Figure 2 displays the interaction relationships between spherical amorphous colloidal alumina and the various surfaces of montmorillonite used to calculate the PMF of the interparticle interactions.
Interaction relationships between spherical amorphous colloidal alumina and montmorillonite basal faces (a) (00-1) and (b) (001) and (c) edge faces. Δz denotes the distance between the surfaces of the two particles.

Simulation details
MD simulations were conducted using the LAMMPS software package (Plimpton, Reference Plimpton1995). The ClayFF force field was used to describe the interactions between the montmorillonite clay sheets and the colloidal alumina particles, with computation parameters provided by Cygan (Reference Cygan, Liang and Kalinichev2004). To simulate water molecules and their interactions at interfaces, the SPC/E water model was adopted. Compared with other commonly used water models (such as SPC or TIP3P), the SPC/E model demonstrates greater accuracy in reproducing the density, diffusion coefficient, dielectric constant and hydrogen bond network of liquid water. This superiority is particularly evident when describing the dynamic adsorption characteristics of water molecules on clay mineral surfaces, thereby enhancing the reliability and physical consistency of these simulation results. Additionally, the Smith–Dang parameters were used to model the behaviour of hydroxyl groups and charge-balancing cations (Ca; Berendsen et al., Reference Berendsen, Grigera and Straatsma1987). The valence bond model was applied to recalculate the partial charges on edge atoms, allowing for more accurate simulation and understanding of the electronic properties of the edge structures of clay minerals, thereby laying a solid theoretical foundation for studying their reactivity and physical properties under various environmental conditions.
First, the simulation was equilibrated in the NPT ensemble (number of particles, pressure and temperature) at a temperature of 298 K and a pressure of 1 bar for 1 ns to ensure the system reached thermodynamic equilibrium under the specified temperature and pressure conditions, stabilizing the initial structures of the montmorillonite clay sheets and colloidal alumina. The NPT ensemble was chosen because it allows the system to freely adjust its volume at fixed temperature and pressure, thereby accurately simulating natural environmental conditions, particularly for interfacial dynamics involving liquid water. To accurately describe long-range interactions, the simulation employed the particle–particle particle–mesh (PPPM) solver for Coulomb interactions, with a cutoff radius of 12.5 Å and a calculation precision of 1.0 × 10⁻⁴. Temperature and pressure were controlled using the Nose–Hoover thermostat, which is widely used in MD simulations due to its capability to accurately couple the system with a heat bath. Compared to other control methods (such as the Berendsen thermostat), the Nose–Hoover thermostat better maintains the system’s true dynamic properties and statistical consistency, ensuring stable temperature and pressure. A time step of 1 fs was chosen to balance computational efficiency with the ability to capture critical high-frequency vibrations (such as H–O bond vibrations), thereby avoiding the numerical errors or system instability caused by excessively large time steps. These settings provided a reliable initial state for subsequent umbrella sampling and PMF calculations.
To evaluate the interactions between montmorillonite and colloidal alumina particles, umbrella sampling was employed, and the PMF was calculated using the collective variable module in LAMMPS software. During the simulation, an external driving force was applied to the amorphous alumina particles, causing them to approach the Ca-montmorillonite clay particles at a rate of 1 nm ns–1. Special attention was given to the interparticle distance Δz in the range of 0–3 nm. Preliminary calculations indicated that the PMF reaches a reasonable level of convergence when the simulation time exceeded 3 ns. To ensure effective overlap between the various sampling windows, a harmonic potential strategy was used to maintain a certain distance between the two particles. A WHAM was used to examine the sampling of the distance between two particles using n outputs and to construct the PMF.
Results and discussion
PMF of the interaction between montmorillonite and amorphous alumina particles
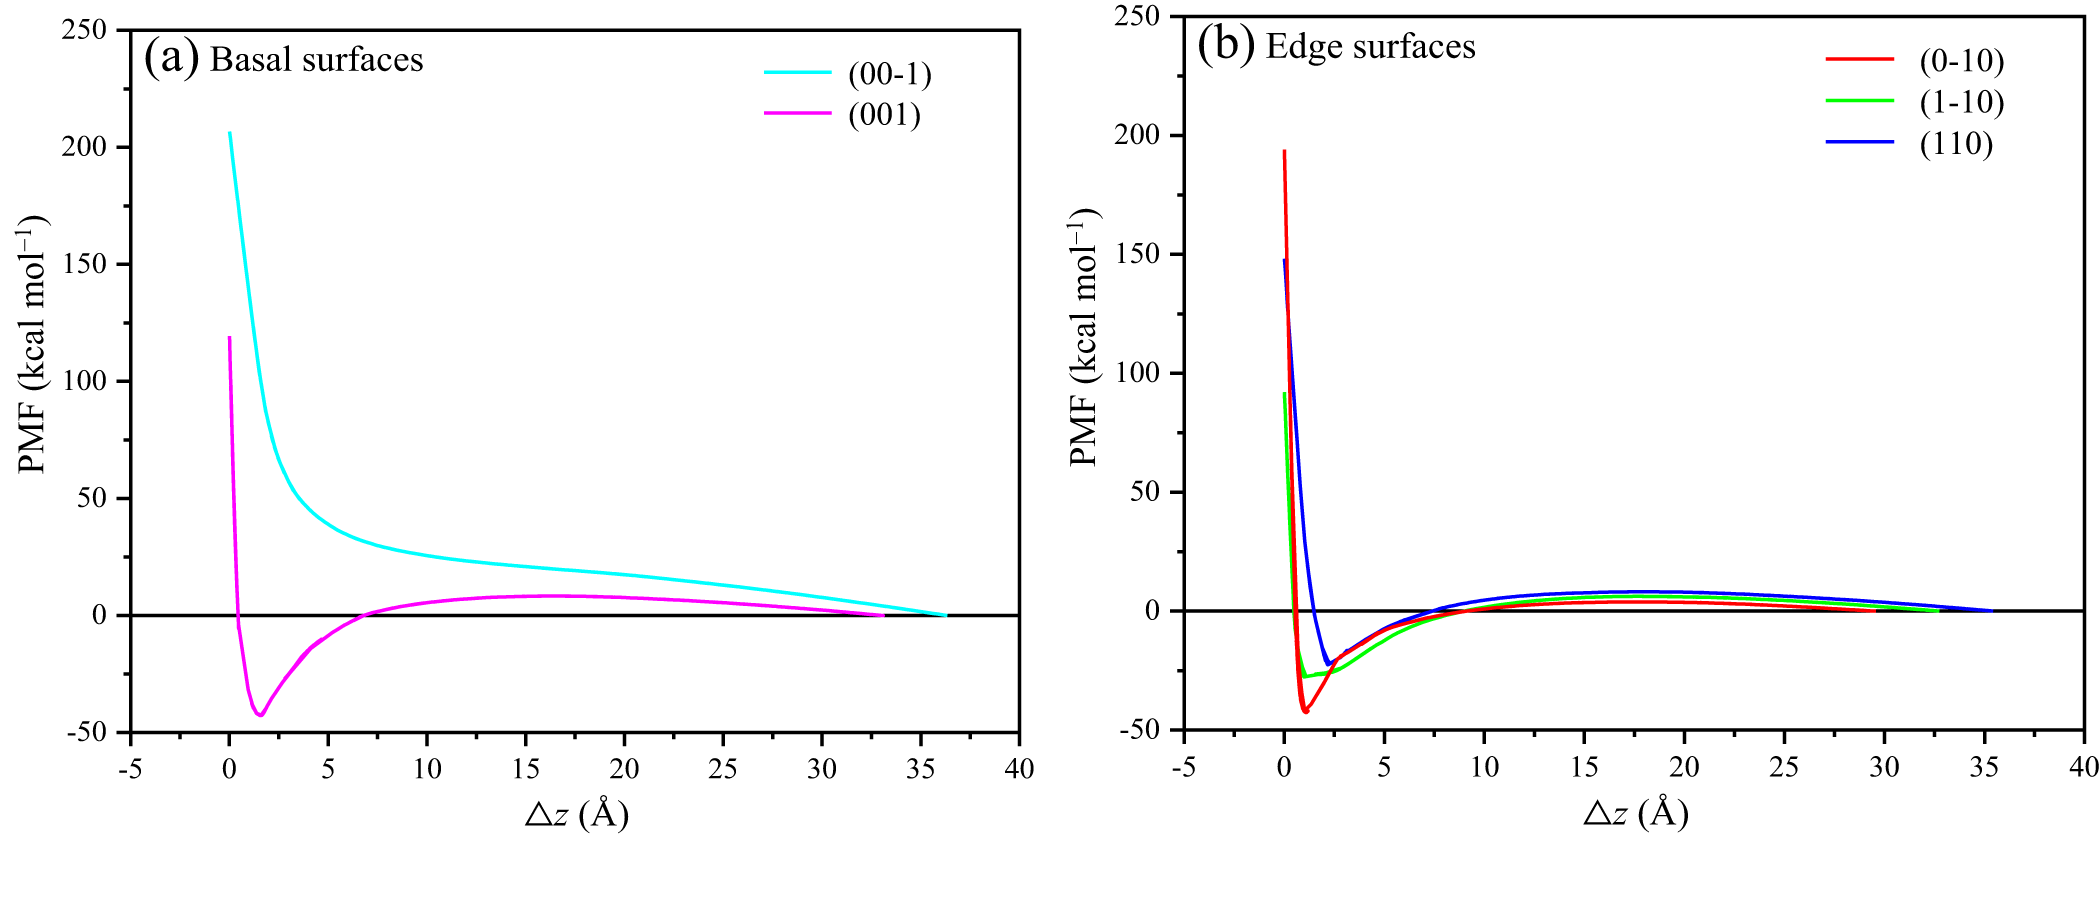
The PMF curve of the interaction between amorphous alumina and montmorillonite is illustrated in Fig. 3. Apart from the (00-1) basal face, the PMF curves for the interactions between montmorillonite edge faces and amorphous alumina particles are notably similar. At greater distances between the montmorillonite clay sheets and colloidal alumina, there is a slight repulsive force between the particles. As this distance decreases, this repulsive force gradually diminishes to zero, marking the onset of an attractive force. This attraction strengthens as the distance continues to decrease, before reaching a maximum. Beyond this point, the attractive force weakens until it diminishes to zero, and the interaction transitions back to a repulsive force. This repulsive force quickly intensifies, creating a noticeable potential well on the PMF curve. In contrast, the interaction between the montmorillonite (00-1) basal face and amorphous alumina particles is always repulsive, and the repulsive force increases as the distance between them decreases. Figure 1c shows that the montmorillonite (001) face has a large number of charge-balancing Ca cations attached, whereas the (00-1) face lacks Ca ions. The significant differences in the interactions between the amorphous alumina and montmorillonite basal faces may be related to the effects of these Ca ions.
PMF curves for the interactions between amorphous alumina and the montmorillonite (a) basal face and (b) edge face.

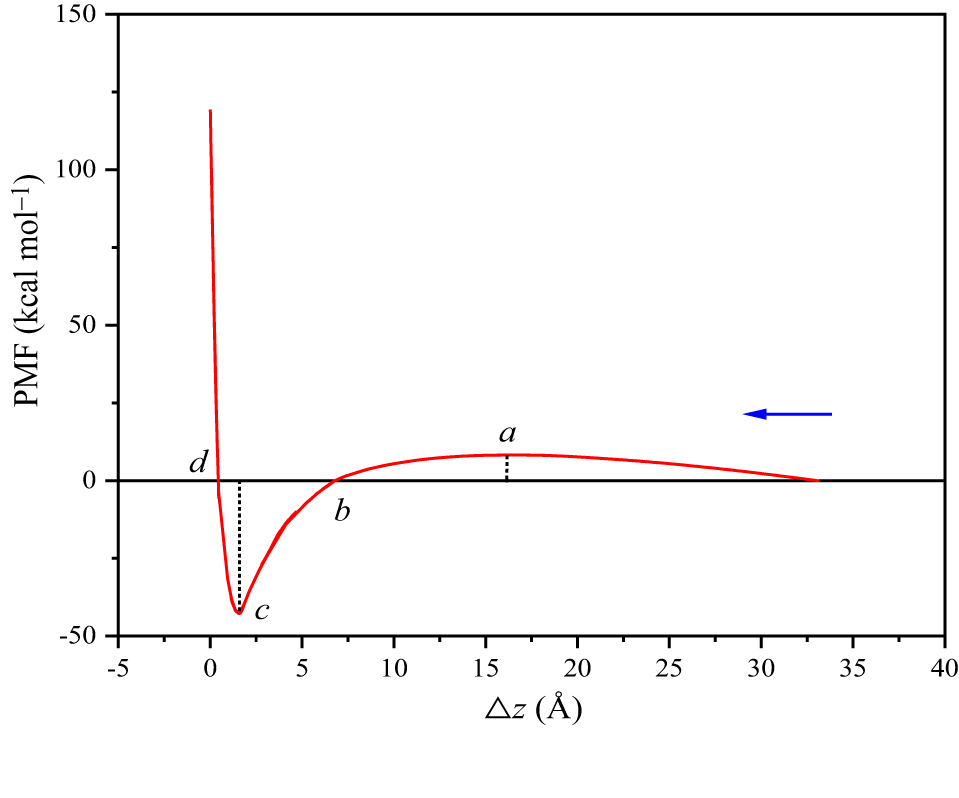
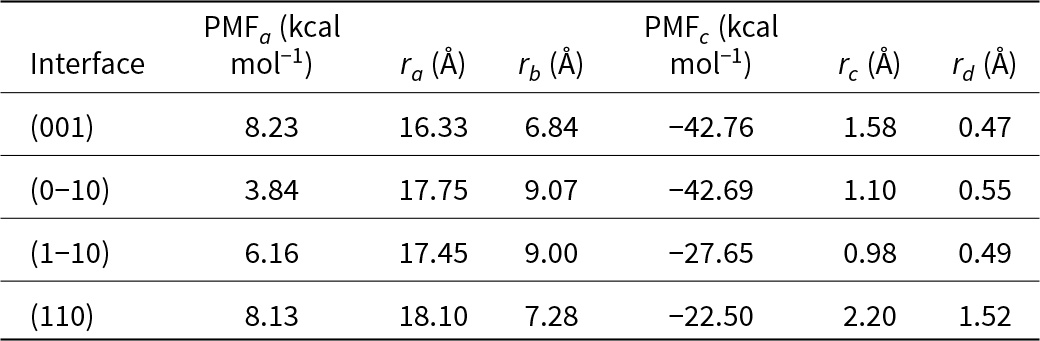
Figure 4 illustrates the typical characteristics of the PMF for particle interactions, excluding the (00-1) basal face. Points a and c, respectively, indicate the maximum repulsive and attractive forces, while points b and d denote the positions where the interaction forces between particles are 0. To help explain of the effects of the various interfaces on the interactions between montmorillonite and amorphous alumina in laterite, Table 1 lists the values at each typical position on the PMF curve. Although the interactions between amorphous alumina and the various montmorillonite interfaces show similar trends, there are specific numerical differences. The repulsive force gradually increases as the distance between the particles decreases. When the distance is 16.33 Å, the repulsive force on the (001) face peaks at 8.23 kcal mol–1, marking the shortest distance among the various cases, with the interparticle interaction force being the highest. For the (110) face, at an interparticle distance of 18.10 Å, the maximum repulsive force is 8.13 kcal mol–1. For the (0-10) face, at an interparticle distance of 17.75 Å, the maximum repulsive force is 3.84 kcal mol–1, the smallest among the interfaces. Compared to the (0-10) face, the distance ra at which the maximum repulsive force occurs on the (1-10) face is not significantly different, but the interaction force increases by more than 60%. As the distance decreases, the attraction between particles gradually increases. At a distance of 1.58 Å, the attraction on the (001) face reaches its maximum of –42.76 kcal mol–1. When the distance is 2.20 Å, representing the greatest interparticle distance among all of the cases, the maximum attraction on the (110) face is only –22.50 kcal mol–1. The distance rd at which the interaction force between particles is 0 on the (110) face is 1.52 Å, which is much greater than in the other cases. On the (1-10) face, the minimum distance at which maximum attraction between particles occurs is 0.98 Å, yet the peak attraction is only –27.65 kcal mol–1. The differences in interaction forces between the amorphous alumina particles and the various montmorillonite interfaces highlight the importance of clay mineral edge faces to the special structure and physicomechanical behaviours of laterite, an aspect that has often been overlooked in previous studies. The subsequent discussion will explore the interaction mechanisms between montmorillonite clay mineral interfaces and colloidal alumina, providing a foundation for further research into the aggregation and evolution processes of natural laterite.
Characteristic points on the PMF curve. Points a and c, respectively, indicate maximum repulsion and attraction, while points b and d denote locations where the force between particles is 0.

Characteristic values at typical positions on the PMF curves under various substitution conditions.

The microscopic interaction mechanisms between montmorillonite and amorphous alumina particles
Calcium ion-dominated adsorption on the (001) surface
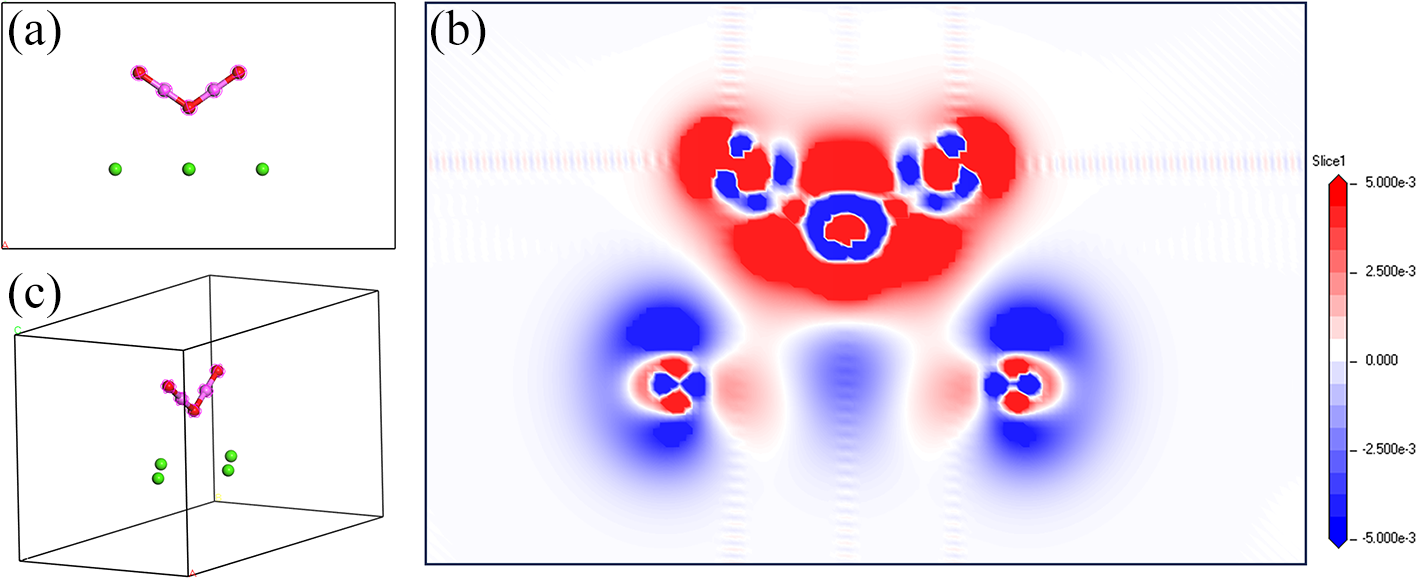
The (001) and (00-1) faces of montmorillonite have the same structure. The simulation was conducted under dry conditions, where the charge-balancing Ca cation does not undergo hydration, resulting in a stable complex structure of Ca ions on the montmorillonite (001) face. This means that the interaction between the colloidal alumina and the montmorillonite (001) face may be influenced by the Ca ions. Based on the relative positions and distributions of Ca ions in montmorillonite and colloidal alumina, the differential charge density distribution of local Ca ions interacting with the alumina surface was calculated (Fig. 5). Figure 5 shows a significant increase in electron density near the O atoms in alumina, while a loss of electrons predominates around the Ca ions. This suggests that the positive charge on the Ca ions induces local polarization in the alumina, with electrons from the Ca ions redistributing towards the O atoms in the alumina. Therefore, as the colloidal alumina approaches the montmorillonite (001) face, there is a clear change in the electron cloud density between the Ca ions and the alumina due to differential charge density. When the distance between alumina particles and montmorillonite is large, the weak repulsive force generated by the particle interactions becomes the primary reason why a natural sticky soil can be dispersed: as the distance between particles decreases, the polarizing effect of Ca ions on the colloidal alumina increases, leading to a significant electrostatic attraction between the Ca ions and the O atoms in the alumina; as the distance between particles further decreases, the colloidal alumina gradually approaches the montmorillonite clay sheet, exerting a compressive effect on the surface atoms of montmorillonite, which is the main reason for the rapid increase in repulsive force when the particle distance is small.
Alumina colloids interacting with Ca ions: (a) side view, (b) differential charge density diagram and (c) three-dimensional view. Here, red atoms denote oxygen, purple atoms denote aluminium and green atoms denote calcium.

Polarization-induced repulsion on the (00-1) face
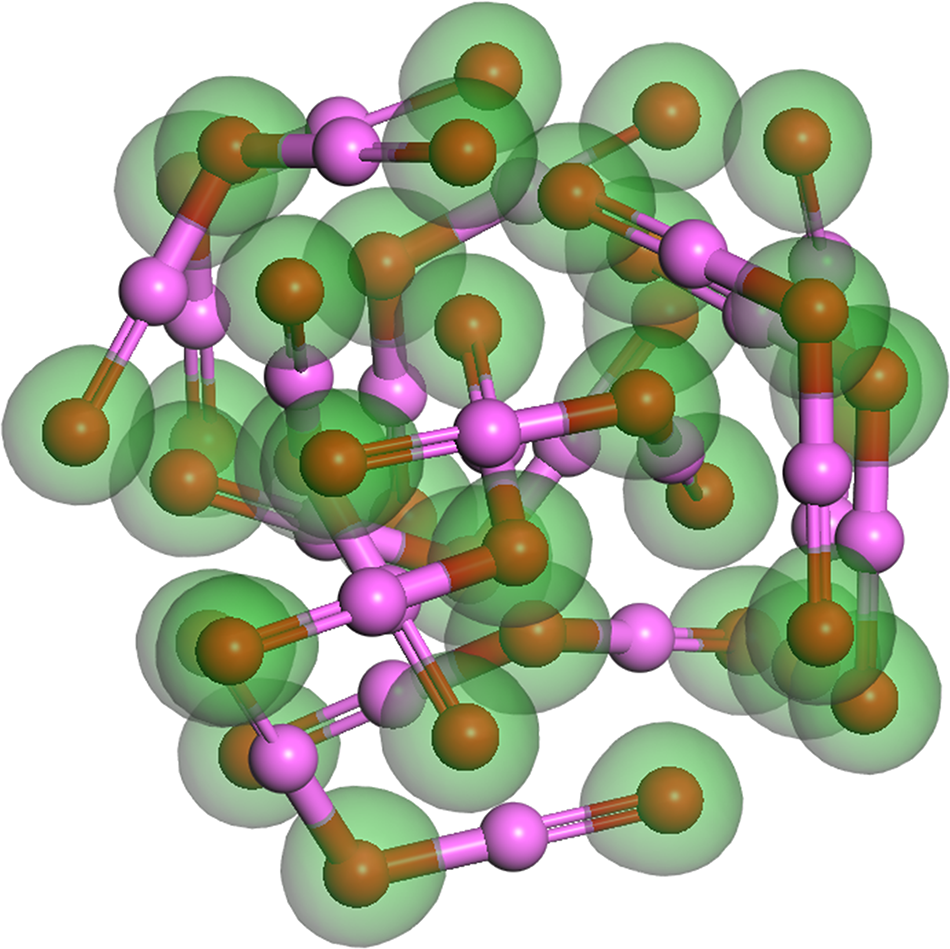
Interactions between colloidal alumina particles and the montmorillonite (00-1) surface are predominantly repulsive, with the repulsive force increasing as the distance between particles decreases. Montmorillonite surfaces carry a net negative charge due to lattice defects and isomorphous substitutions, which are neutralized by balancing cations such as Na and Ca. Balancing cations tend to form complex structures on the interlayer (001) face of montmorillonite, causing an uneven charge distribution and generating dipole moments. These dipole moments make montmorillonite particles polar, resulting in electrical differences between the upper and lower basal faces, with the (001) face being positively charged due to Ca ions and the (00-1) face being negatively charged. To clarify the repulsion in the interactions between colloidal alumina particles and the montmorillonite (00-1) face, the charge density of alumina aggregates was computed (Fig. 6) to assess their surface charge distribution. The charge density around O atoms in colloidal alumina particles is depicted as a –0.5e/Å3 isosurface in Fig. 6. Due to the unique structure of alumina molecules, when a large number of molecules aggregate to form colloidal particles, the O atoms at the ends of alumina are always located at the particle surface. The distribution of O atoms at the ends of colloidal alumina particles gives their surface a distinctly negative charge. Charges always exhibit the properties of like repelling like and opposites attracting; the surfaces of colloidal alumina and the montmorillonite (00-1) face both display negative charges, which is the main reason for the repulsion between them. These findings are similar to those of Zen et al. (Reference Zen, Bui, Tran, Tay, Chellappah and Collins2022), who, in their simulations of interactions between two illite clay particle basal faces, found that the faces were positively and negatively charged, respectively, causing the illite particles to form dipoles and resulting in significant electrostatic repulsion.
Atomic distribution and charge density in colloidal alumina aggregates: purple represents aluminium (Al), red represents oxygen (O) and green represents the electron cloud around oxygen at a –0.5e/Å3 isosurface.

Hydrogen bond and electrostatic interactions control the adsorption characteristics of edge faces
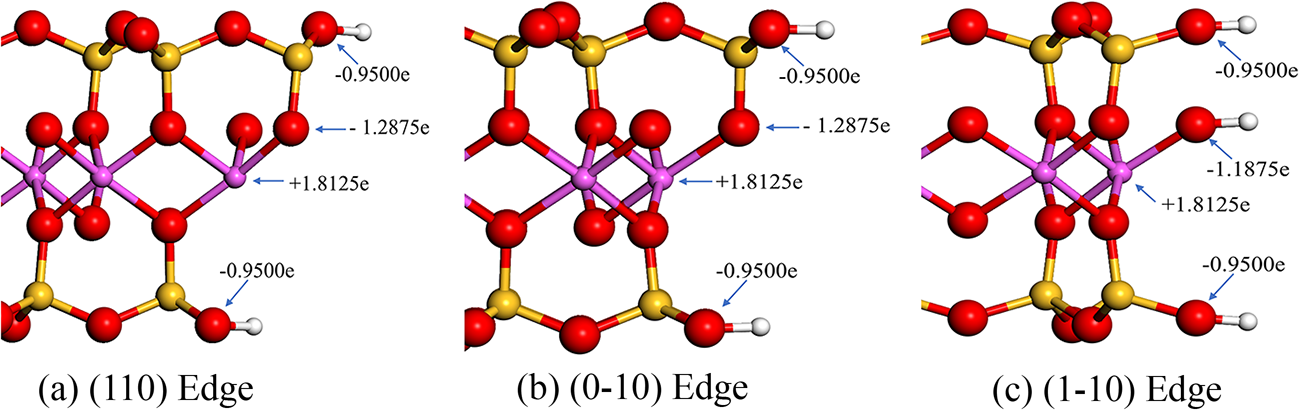
Compared to the basal faces, the edge structure of montmorillonite is more complex; the stable structure and charge distribution of edge atoms were recalculated during the simulation (Fig. 7). At the edges of montmorillonite, there are under-coordinated Al and Si atoms. Additionally, there are two types of hydroxyl groups: one linked to Si atoms and the other linked to octahedral Al atoms. The charge of octahedral Al atoms is +1.8125e, that of bridging O atoms is –1.2875e, that of hydroxyl O atoms connected to Si atoms is –0.9500e and that of those connected to Al atoms is –1.1875e. As previously mentioned, O atoms in amorphous alumina carry a negative charge, whereas Al atoms carry a positive charge. Therefore, when amorphous alumina interacts with the edge faces of montmorillonite, electrostatic attraction may occur between the O atoms in alumina and under-coordinated Al and Si atoms at the montmorillonite edges. Furthermore, hydrogen bonding may occur between hydroxyl H atoms at montmorillonite edges and O atoms in alumina, constituting another significant mechanism of interaction between alumina and montmorillonite edges.
Montmorillonite edge atomic charges: (a) (110) edge, (b) (0-10) edge and (c) (1-10) edge. The different colours represent the following atomic types: red for oxygen atoms, yellow for silicon atoms, purple for aluminum atoms and white for hydrogen atoms.

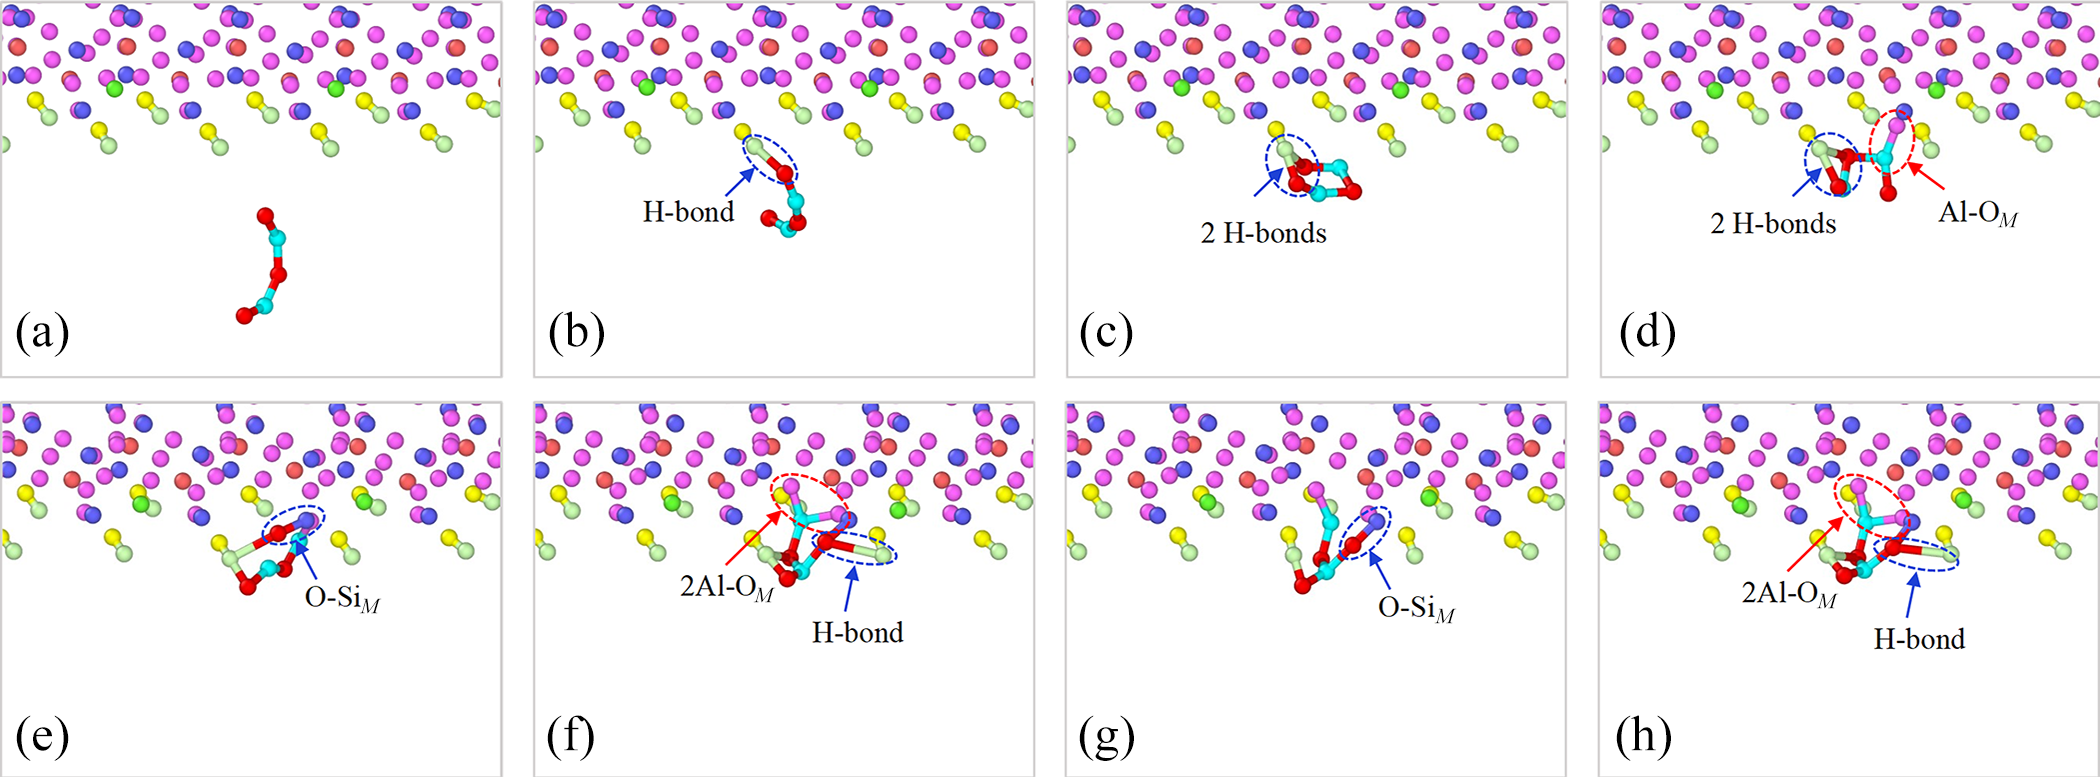
The differences in edge structure and charge distribution in montmorillonite result in variations in the PMF curves for the interactions between alumina and montmorillonite edges. To clarify the interactions between the various montmorillonite edge faces and amorphous alumina, an analysis was conducted on a single unit within the amorphous alumina particles. Figure 8 illustrates the process of structural evolution during the interaction between amorphous alumina and the montmorillonite (0-10) edge. During the interaction between amorphous alumina and the montmorillonite (0-10) edge, one of the terminal O atoms always moves towards the hydroxyl (OH) group (Fig. 8a). As they come closer, a hydrogen bond initially forms (Fig. 8b), followed by a rotation of the alumina particle, leading to another terminal oxygen atom bonding with the same hydrogen atom (Fig. 8c). Further interaction leads to the breaking of the hydrogen bond and another rotation of the alumina particle, with the middle O atom of alumina forming a hydrogen bond with the same H atom and another Al atom on the opposite side forming an Al–OM chemical bond with an under-coordinated O atom in montmorillonite (Fig. 8d). Subsequently, the terminal O atom in alumina, which did not form a hydrogen bond, detaches and coordinates with a silicon atom in montmorillonite to form an O–SiM chemical bond (Fig. 8e). Notably, the Al atom that already formed an Al–OM chemical bond forms another Al–OM chemical bond with an under-coordinated O atom in montmorillonite (Fig. 8f), at which point the structure becomes stable. Ultimately, at the montmorillonite edge, colloidal alumina formed two Al–OM bonds, three hydrogen bonds and one O–SiM bond (Fig. 8h).
Interaction between alumina and the montmorillonite (0-10) edge. See text for details of parts (a)–(h).

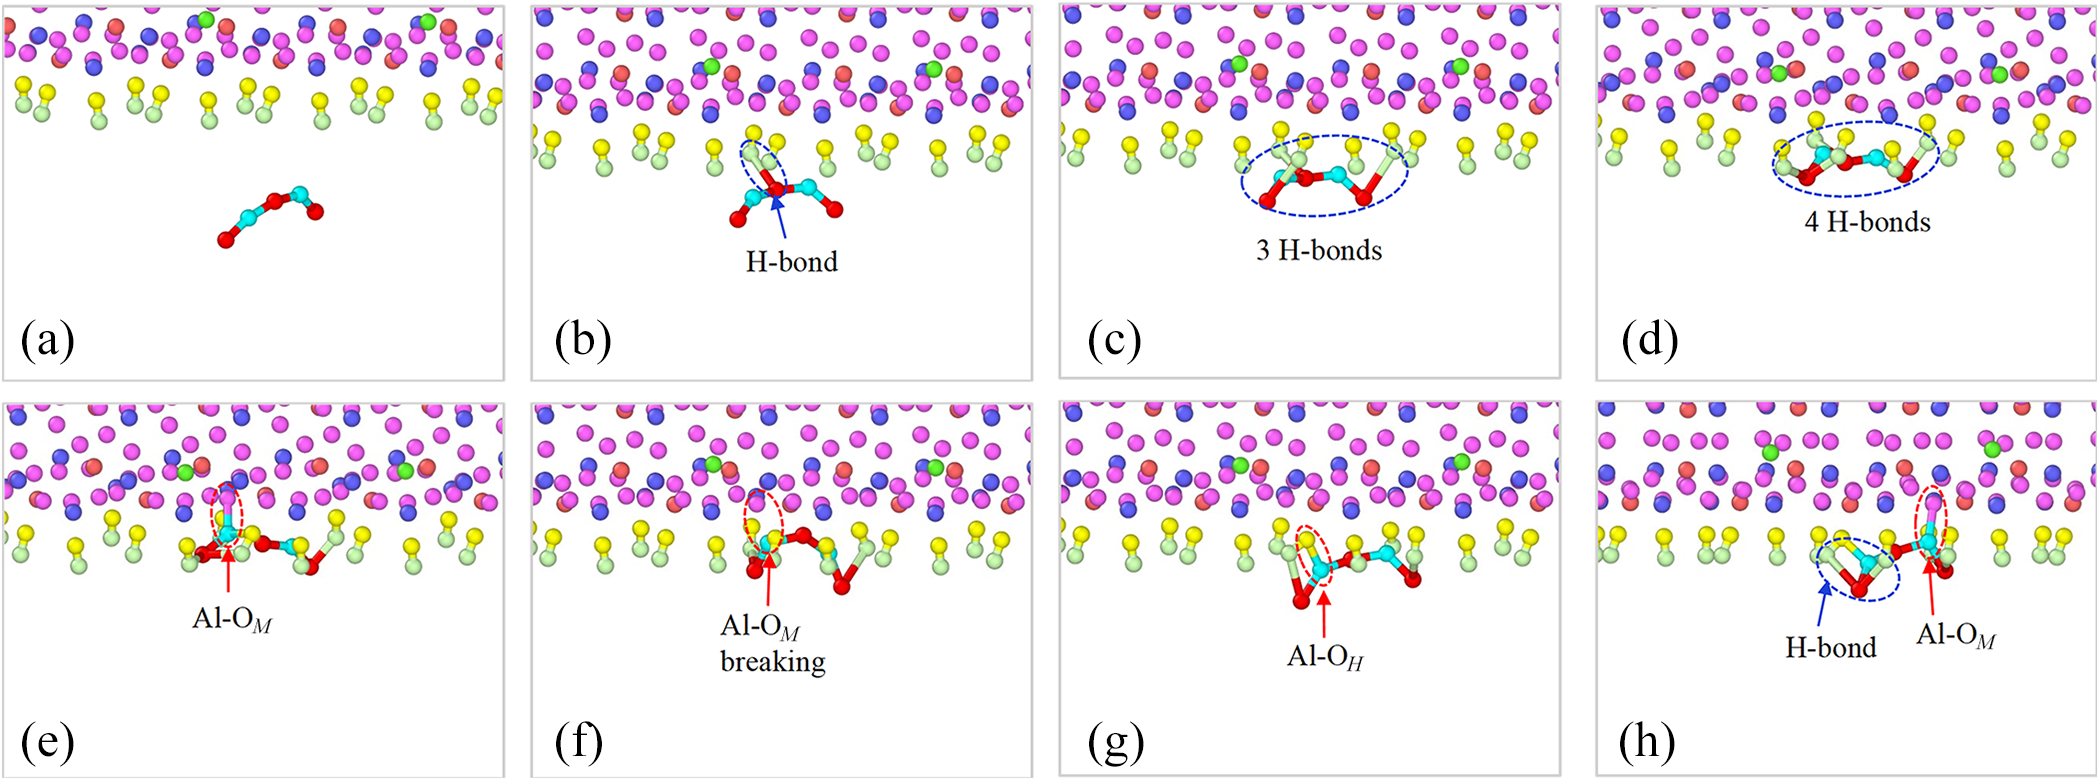
Figure 9 illustrates the process of structural evolution in the interaction between colloidal alumina and the montmorillonite (1-10) edge. Compared to the (0-10) edge, the central O atom in the alumina is observed moving towards the hydroxyl (OH) group (Fig. 9a), initially forming a hydrogen bond with an H atom (Fig. 9b). As the interaction progresses, influenced by the hydroxyl in montmorillonite, the Al–O bond angle in alumina rotates, and both terminal O atoms form hydrogen bonds with H atoms (Fig. 9c). Further observations show that one of the terminal O atoms in alumina forms a hydrogen bond with another hydroxyl group (Fig. 9d). Figure 9e shows an Al atom in alumina forming an Al–OM bond with an under-coordinated O atom in montmorillonite, but this Al–OM bond has poor stability and is prone to breaking (Fig. 9f). After such a break, the Al atom forms a stable coordinated Al–OH bond with a hydroxyl O atom (Fig. 9g), while another Al atom continues to form an Al–OM bond (Fig. 9h). The structural evolution of the interaction between colloidal alumina and the montmorillonite (1-10) edge shows that the hydroxyl groups in montmorillonite dominate this edge interaction, forming stable hydrogen and Al–OM bonds. However, it is worth noting that compared to Al–OM and O–SiM bonds, hydrogen bonds provide much less bond energy, which might explain why the maximum attraction at the (1-10) edge is less than that at the (0-10) edge.
Interaction between alumina and the montmorillonite (1-10) edge. See text for details of parts (a)–(h).

Figure 10 shows the structural evolution during the interaction between alumina and the montmorillonite (110) edge. Similarly to the (0-10) edge, a terminal O atom in alumina is first seen forming a hydrogen bond with a hydroxyl group (Fig. 10b). However, unlike the other two edges, further interaction leads to the disappearance of the hydrogen bond, and correspondingly an Al atom in alumina forms an Al–OM bond with an under-coordinated O atom in montmorillonite (Fig. 10c). Subsequently, that Al atom forms another Al–OM bond with an under-coordinated O atom in montmorillonite, and the terminal O atom connected to this Al atom forms an O–SiM bond with a Si atom (Fig. 10d), but the O–SiM bond is unstable and prone to breaking (Fig. 10g). It is noteworthy that although hydrogen bonds appear during the interaction at the (110) edge, these bonds are highly unstable; ultimately, when the interaction stabilizes, two Al atoms in alumina each form Al–OM bonds with under-coordinated O atoms in montmorillonite (Fig. 10h), and the hydrogen and O–SiM bonds disappear, resulting in the minimal attractive force between alumina and the montmorillonite (110) edge.
Interaction between alumina and the montmorillonite (1-10) edge. See text for details of parts (a)–(h).

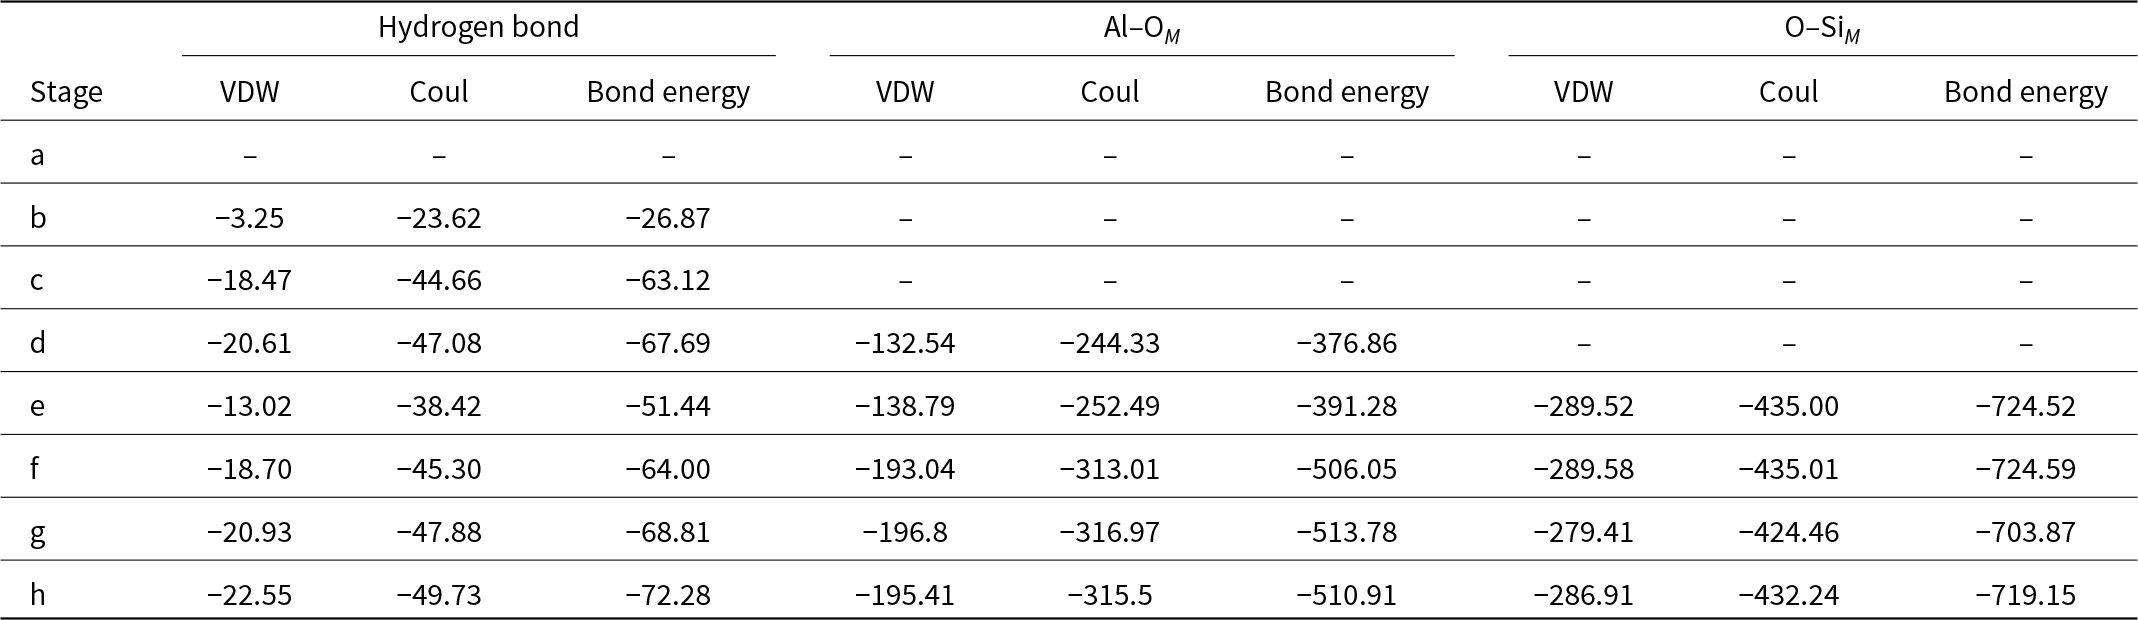
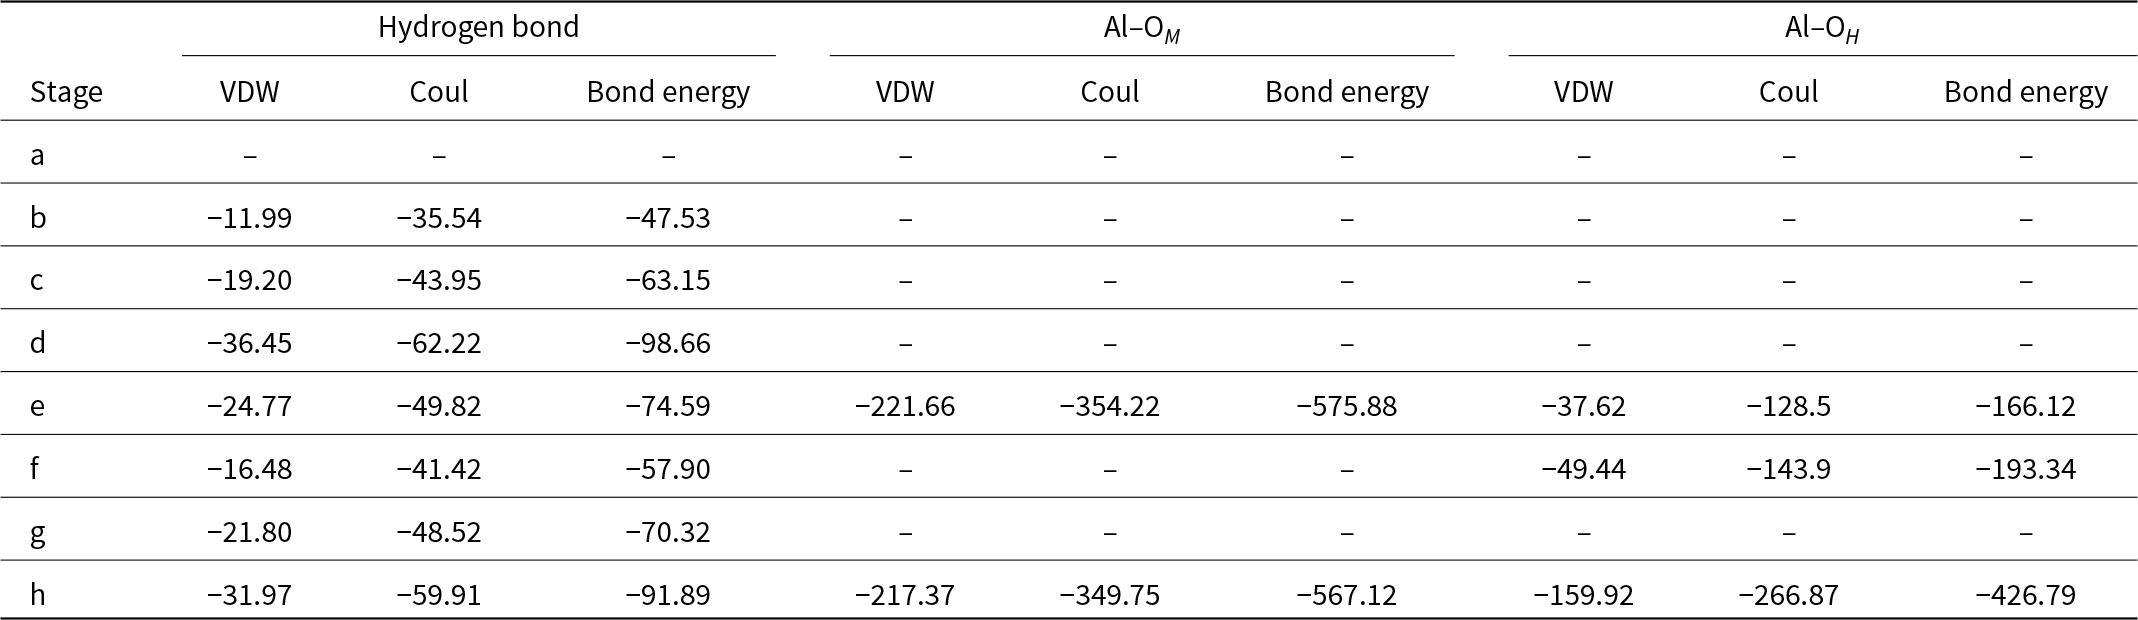
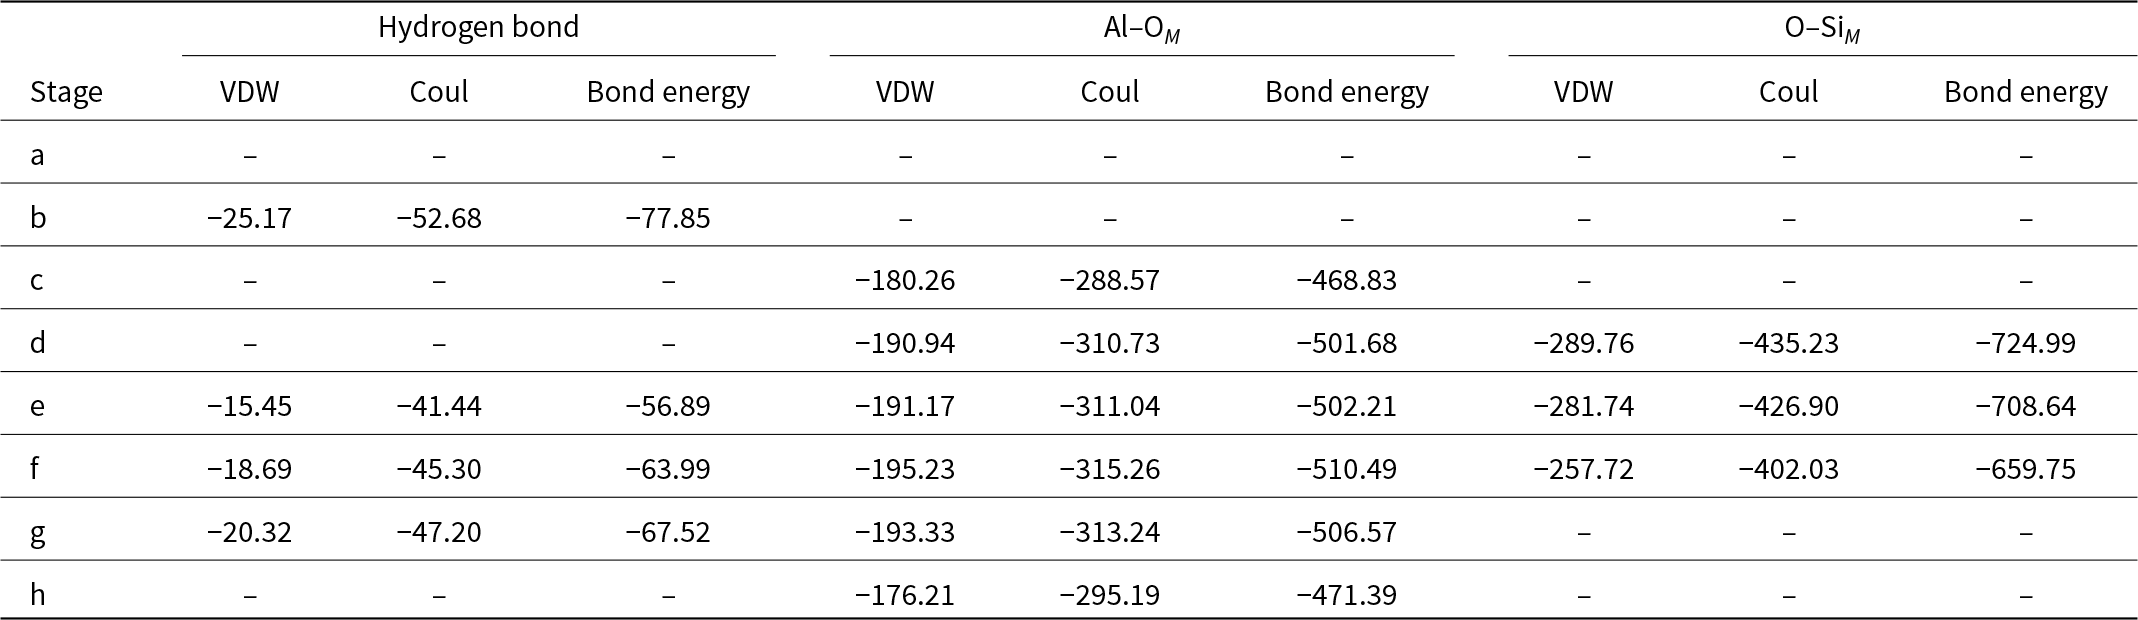
In this study, the energy changes of various chemical bonds during the adsorption process of edge alumina molecules on three different clay particle edges (0-10 edge, 1-10 edge and 110 edge) were analysed in detail (Tables 2–4).
Interaction energies (kJ mol–1) of chemical bonds at the (0-10) edge.

Coul = Coulomb; VDW = van der Waals.
Interaction energies (kJ mol–1) of chemical bonds at the (1-10) edge.

Coul = Coulomb; VDW = van der Waals.
Interaction energies (kJ mol–1) of chemical bonds at the (110) edge.

Coul = Coulomb; VDW = van der Waals.
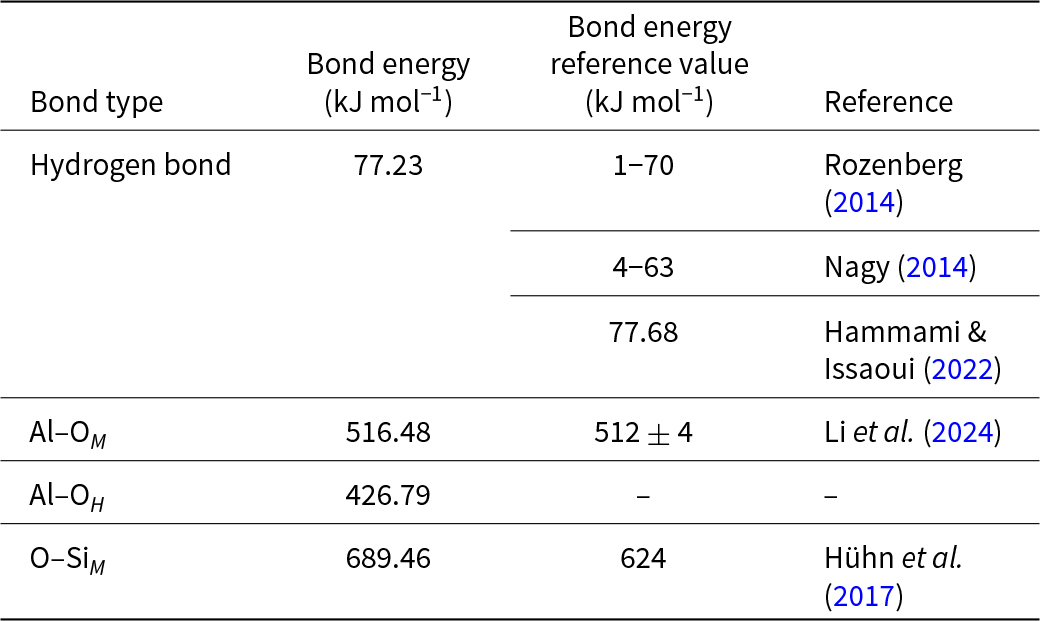
At the (0-10) edge, the bond energy of hydrogen bonds changed significantly, increasing from –26.87 to –72.28 kJ mol–1, indicating enhanced stability of hydrogen bonds as adsorption progresses. Additionally, the bond energy of Al–OM bonds increased from –376.86 to –510.91 kJ mol–1, indicating greater stability of Al–OM bonds during adsorption. For O–SiM bonds, the bond energy fluctuated between –724.59 and –703.87 kJ mol–1, showing dynamic changes of this bond type during adsorption. At the (1-10) edge, a similar trend was observed, with some bonds showing even more significant changes, such as hydrogen bonds changing from –47.53 to –91.89 kJ mol–1, Al–OM bonds changing from –575.88 to –567.12 kJ mol–1 and Al–OH bonds changing from –166.12 to –426.79 kJ mol–1. At the (110) edge, the change in hydrogen bonds was from –77.85 to –75.57 kJ mol–1, that of Al–OM bonds was from –468.83 to –471.39 kJ mol–1 and that of O–SiM bonds was from –724.99 to –659.75 kJ mol–1, reflecting the complex dynamics of bond energies across the various edges and chemical environments (Table 5).
Chemical bond energy comparisons.

This study conducted a detailed analysis and comparison of the bond energies involved in the adsorption behaviour of alumina molecules on clay particle edges, including hydrogen bonds, Al–OM bonds, Al–OH bonds and O–SiM bonds, comparing these data with data from the existing literature. Such comparisons validated the reliability of the computational methods and results while also uncovering potential new directions for future research.
The calculated bond energy for hydrogen bonds was 77.23 kJ mol–1, which is relatively close to the values reported previously in the literature. Any discrepancy could be due to differences in the hydration state of the experimental samples or the theoretical methods and basis sets used in the computational models. In studies of clay particles, hydrogen bonds are particularly important as they directly affect the surface properties and interaction mechanisms of the particles. Therefore, more accurate measurement and calculation of this type of bond energy are essential for understanding and optimizing the application of clay particles. The energy of Al–OM bonds in this study was 516.48 kJ mol–1, demonstrating good consistency with the 512.00 kJ mol–1 value reported previously in the literature. This consistency indicates that the computational model and parameter choices can reliably predict the behaviour of Al–OM bonds in clay particles. The Al–OM bond, as a primary structural bond in clay particles, has a decisive impact on the structural integrity and chemical activity of these particles. For Al–OH bonds, the data show an energy of –426.79 kJ mol–1, differing from that of Al–OM bonds. Finally, the calculated value for O–SiM bonds is 689.46 kJ mol–1, greater than the 624.00 kJ mol–1 reported previously in the literature. This significant discrepancy may indicate that the computational model has captured some complex physical phenomena not fully considered in traditional models. This outcome highlights the importance of more in-depth studies into these potential complexities in future work.
Conclusion
The internal particle interaction mechanism of laterite was unclear. Therefore, this study, based on MD simulations, first measured the interaction strength between amorphous alumina and montmorillonite particles in laterite using the umbrella sampling method. The results showed that, except on the (00-1) surface, the interaction between the two particles exhibited continuous repulsion. However, on other edge surfaces such as (010), (1-10) and (0-10) and the basal surface (001), clear dynamic behaviour was observed, including initial weak repulsion, followed by strong attraction, and eventually sustained strong repulsion. This variation reflected the complexity and condition sensitivity of the interparticle forces. The main causes of this variation are proposed to be as follows:
(1) Electrostatic interaction: the electrostatic interaction between calcium ions and alumina (attraction between positively charged calcium ions and negatively charged alumina) significantly affected the strength and nature of the interaction. This electrostatic force directly influenced the adsorption during the interaction between montmorillonite particles and amorphous alumina on the basal surface (001).
(2) Regulation by Ca ions: Ca ions played a key role in the interactions in laterite. The positive charge of Ca ions caused local polarization of montmorillonite particles, significantly altering the nature of the interaction. Due to polarization induced by Ca ions, montmorillonite particles exhibited a negative charge on the (00-1) surface, which was similar to the negative charge on the surface of amorphous alumina, leading to repulsion.
(3) Role of hydrogen bonds and chemical bonds: hydrogen bonds and chemical bonds played crucial roles in the interactions on the edge surfaces. Especially during adsorption, the formation of hydrogen bonds, Al–OM bonds, Al–OH bonds and O–SiM bonds usually determined the stability of the adsorption process.
This study deepens our understanding of the micro-mechanisms of particle interactions in laterite and provides a scientific basis for practical applications. For example, the findings can be applied to improve building materials and soil stability and optimize environmental remediation techniques. Furthermore, the study demonstrates the potential for translating such laboratory research into practical applications, particularly for improving the physical properties and environmental functions of laterite. Additionally, this research is of significant importance to the scientific community, especially for researchers focusing on clay minerals and their applications. By revealing the interaction mechanisms between amorphous alumina and montmorillonite particles, the study further elucidates how the structure and surface properties of clay minerals influence their physical and mechanical behaviours. These insights are invaluable for advancing soil stabilization techniques, developing novel laterite-based materials and exploring the sustainable applications of clay minerals. At the same time, the methodologies and findings of this study provide a solid theoretical foundation for future molecular-scale research, fostering interdisciplinary collaboration in this field.
Future research should consider the impacts of various environmental factors such as temperature and humidity on these interactions. Considering the simplifications in the model’s assumptions and scale limitations, future work needs to be conducted under more extensive conditions to increase the universality and improve the accuracy of the research results. In this way, the understanding of the complex system of laterite can continue to improve, and its applications in various important fields can be optimized.
Acknowledgements
During the preparation of this work the authors used ChatGPT to improve the text’s language and readability. After using this tool/service, the authors reviewed and edited the content as needed and take full responsibility for the content of the publication.
Financial support
This research was supported by the National Natural Science Foundation of China (Grant No. 42002280), the Science and Technology Foundation of Guizhou Province (No. ZK[2022]Key018) and Zhejiang Provincial Natural Science Foundation of China under Grant No. LTGG24E090002.
Competing interests
The authors declare none.