Introduction
Climate change models predict that global warming and associated weather changes will continue in the coming decades (IPCC, 2007). Climate-driven changes in habitats could decrease the intrinsic physiological performance of organisms or lead to phenological mismatches with other organisms (Berg et al., Reference Berg, Kiers, Driessen, van der Heijden, Kooi, Kuenen, Liefting, Verhoef and Ellers2010; Buermann et al., Reference Buermann, Chaves, Dudley, McGuire, Smith and Altshuler2011; Morris et al., Reference Morris, Moore, Ale and Dupuch2011). As a result, many species could face local extinction or large shifts in their geographic distribution (Thomas et al., Reference Thomas, Cameron, Green, Bakkenes, Beaumont, Collingham, Erasmus, de Siqueira, Grainger, Hannah, Hughes, Huntley, Jaarsveld, Midgley, Miles, Ortega-Huerta, Peterson, Phillips and Williams2004; Botkin et al., Reference Botkin, Saxe, Araújo, Betts, Bradshaw, Cedhagen, Chesson, Dawson, Etterson, Faith, Ferrier, Guisan, Hansen, Hilbert, Margules, Loehle, New, Sobel and Stockwell2007; Beever et al., Reference Beever, Ray, Wilkening, Brussard and Mote2011). An understanding of the underlying mechanisms, from physiology to demography, behind responses to climate warming is essential to accurately predict biotic responses to climate change. However, in many studies the temperature regime is oversimplified, which means that the results may not apply to organisms living outdoors.
In nature, oscillating temperature regimes, not constant regimes, are the norm over both short- (daily) and long-term (annual) timescales. Current debate and discussion about global warming focus on increases in the mean temperature predicted by climate models. However, the mean value is only one component of the temperature regime that can have large effects on the biotic and abiotic components of ecosystems (Dang et al., Reference Dang, Schindler, Chauvet and Gessner2009). Organisms have evolved a range of biological traits that enable them to avoid, survive, or even exploit natural environmental fluctuations (Lytle, Reference Lytle2001; Lytle et al., Reference Lytle, Bogan and Finn2008; Brennan et al., Reference Brennan, Christie and York2009). The effects of constant and oscillating temperature regimes are known to be different at all levels of organization, from organisms to communities (Vargas et al., Reference Vargas, Walsh, Kanehisa, Stark and Nishida2000; Uvarov, Reference Uvarov2004; Dang et al., Reference Dang, Schindler, Chauvet and Gessner2009). Still, temperature fluctuation, a crucial characteristic of temperature regimes (Robeson, Reference Robeson2002), is frequently neglected in estimates of the future impacts of global warming on ecosystems and their components (Karl et al., Reference Karl, Stoks, De Block, Janowitz and Fischer2011).
Many ectotherms, including insects, will likely be affected by climate warming because ambient temperature strongly affects their physiological functions (Kuo et al., Reference Kuo, Lu, Chiu, Kuo and Hwang2006b; Lu & Kuo, Reference Lu and Kuo2008; Karl et al., Reference Karl, Stoks, De Block, Janowitz and Fischer2011). High-latitude insects might experience increased fitness as climate warming will bring them closer to their physiological optima (Kingsolver, Reference Kingsolver2009). Warming will likely negatively affect tropical insects because their thermal optima could be exceeded (Deutsch et al., Reference Deutsch, Tewksbury, Huey, Sheldon, Ghalambor, Haak and Martin2008). The effects of warming on populations at low latitudes are much less well known (Stange & Ayres, Reference Stange and Ayres2010). When insects are exposed to extreme temperatures, their development rate, reproduction and survival decrease (Davis et al., Reference Davis, Radcliffe and Ragsdale2006; Hazell et al., Reference Hazell, Neve, Groutides, Douglas, Blackburn and Bale2010). Insects at low latitudes will be most likely to suffer decreases in growth, reproduction and fitness during the summer, when they will be exposed to the highest, potentially lethal, temperatures, and to the longest periods of high, sub-lethal temperatures.
Among the most important agricultural pests, aphids reduce crop yields directly, through their feeding, and indirectly, through the transmission of viral infections (Blackman & Eastop, Reference Blackman and Eastop2000). The cosmopolitan cowpea aphid, Aphis craccivora Koch, 1854 (Hemiptera: Aphididae), feeds on plants in eight families (Hsu, Reference Hsu1980; Tao, Reference Tao1999) and transmits over 50 kinds of plant viruses (Stoetzel & Miller, Reference Stoetzel and Miller2001). Among these are viruses that cause serious physical and economic damage to legumes, including alfalfa fields in California and Arizona in 1999 (Natwick, Reference Natwick1999). In Taiwan, the cowpea aphid migrates to Alternanthera philoxeroides (Amaranthaceae) in the summer, and then switches to legumes such as Phaseolus vulgaris and Sesbania cannabina (Fabaceae) in autumn and winter, when it is cooler and drier (Hsu, Reference Hsu1980; Chang & Chen, Reference Chang and Chen1993; Tao, Reference Tao1999; Huang, Reference Huang2004). In Taiwan, cowpea aphid sexuparae (sexual morphs with males and oviparae) occur on Mirabilis jalapa (Nyctaginaceae) during December and January (Hsu, Reference Hsu1980; Tao, Reference Tao1999). A. craccivora probably originated in warm, temperate areas of the Palearctic, but it is now widespread in the tropics (Blackman & Eastop, Reference Blackman and Eastop2000). In Taiwan, the cowpea aphid occurs in subtropical and tropical areas. In a previous study, the cowpea aphid had a development threshold temperature of 7.4 °C, and very high reproductive potential. At 25 °C, fecundity is 97.1 offspring per female during a reproductive life of 16.4 days (Kuo & Chen, Reference Kuo and Chen2004).
We exposed A. craccivora to four mean daily temperatures (each with constant and oscillating regimes) that reflected current conditions and different levels of warming (from 1.1 °C to 6.4 °C) projected for the end of the 21st century (IPCC, 2007). We predicted that A. craccivora longevity and reproduction would decrease as the simulated summer temperatures increased, based on the hypothesis that climate warming will eventually exceed their physiological optima (Kuo & Chen, Reference Kuo and Chen2004; Deutsch et al., Reference Deutsch, Tewksbury, Huey, Sheldon, Ghalambor, Haak and Martin2008; Kingsolver, Reference Kingsolver2009). As the daily highs are higher in the oscillating temperature regimes, we predicted that aphid survival and reproduction will be more severely affected than in the constant temperature regimes.
Materials and methods
Materials
In April 2010, a parthenogenetic clone of A. craccivora was collected from snap bean in Wufeng District, Taichung City, Taiwan. A stock culture was maintained on asparagus bean leaves, Vigna unguiculata sesquipedalis (L.) (cv. ‘Kaohsiung Ching Chia’), in a growth chamber at a 25 °C, 12L:12D, conditions appropriate for maintaining the stock population (Kuo & Chen, Reference Kuo and Chen2004). Within 24 h of larviposition by its apterous mother, each first instar nymph was transferred to its own leaf from a pre-flowering plant sown 4–5 weeks earlier. The leaf was placed in a Petri dish and the cut end of the petiole was covered with a saturated cotton ball. Throughout the experiments, the wet cotton ball was also used to avoid desiccation in each Petri dish. We replaced leaves every 2–3 days to prevent nutritional deficiencies.
Experimental design
Aphids can complete their entire lifecycle in 1 month or less at high temperatures (Kuo et al., Reference Kuo, Chiu and Perng2006a, Reference Kuo, Lu, Chiu, Kuo and Hwangb; Lu & Kuo, Reference Lu and Kuo2008). Based on the meteorological data from the Taiwan Agricultural Research Institute, the warmest mean monthly temperature in 2010, 28.6 °C in July, was taken to represent current climate conditions. We also simulated three levels of warming, 1.4, 3.9 and 6.4 °C above the mean temperature in July 2010, which are within the range of increases (1.1–6.4 °C) predicted (IPCC, 2007). The average temperatures represented a slight (+1.4 °C; mean: 30.0 °C), moderate (+3.9 °C; mean: 32.5 °C) and severe (+6.4 °C; mean: 35.0 °C) warming (fig. 1). For each mean temperature, there were constant and oscillating regimes. The amplitude and pattern of temperature change in the oscillating regimes was based on the mean temperatures of the odd-numbered hours (e.g., 01:00, 03:00, etc.) in July 2010 (fig. 1). The photoperiod for all treatments was 14 h light:10 h dark. Nymphal development, fecundity and survivorship were recorded daily. There were 40 aphids in each temperature treatment. This experiment was conducted from mid-July to early September 2011.
Daily temperature oscillation curves for three levels of warming (30.0, 32.5 and 35.0 °C) and the current climate (28.6 °C). The curves are based on July 2010, meteorological data from the Taiwan Agricultural Research Institute.

Statistical analyses
Our records of cowpea aphid growth and reproduction in each temperature regime were used to calculate population growth statistics, including age-specific survival rate (l x) and fecundity (m x) at age x, intrinsic rate of increase (r), net reproductive rate (R 0) and mean generation time (GT) (Goodman, Reference Goodman1982; Schneider et al., Reference Schneider, Sanchez, Pineda, Chi and Ronco2009).
We used multiple regression analysis to determine effects of the temperature regime (constant versus oscillating) and average temperature (28.6, 30.0, 32.5 and 35.0 °C) on the life-history traits and demographic parameters of A. craccivora. For each categorical variable with K categories, the variable must be converted to K-1 dummy variables in the analysis (SAS Institute, 2004). Therefore, the temperature regime (constant versus oscillating) was converted to one dummy variable (two categories–1) in which 0 represented constant temperature and 1 represented oscillating temperature. Results were analyzed with the SAS statistical framework using the procedure REG (SAS Institute, 2004). Multiple regression analysis model selection was conducted using minimized Akaike's information criterion (AIC) value, which is a likelihood-based tool for optimal model selection (Akaike, Reference Akaike1974).
Results
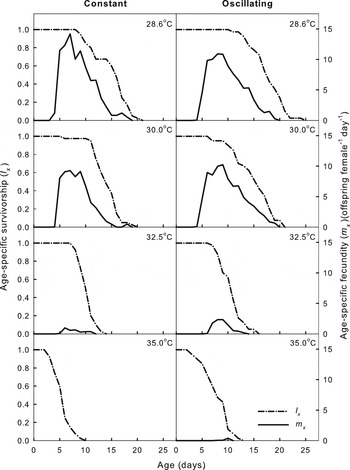
All the nymphs reached adulthood at daily mean temperatures of 28.6, 30.0 and 32.5 °C, in both the oscillating and constant regimes. At 35.0 °C, only 65% and 13% of the nymphs reached adulthood in the oscillating and constant regimes, respectively. The age-specific survival rate (l x) decreased as the daily mean temperature increased from 28.6 °C to 35.0 °C in both oscillating and constant regimes (fig. 2). In the constant regimes, 50% mortality (nymphs and adults) occurred on day 16 at 28.6 °C, but on day 7 at 35.0 °C. In the oscillating regimes, 50% mortality ranged from day 18 at 28.6 °C to day 8 at 35.0 °C (fig. 2). In the constant regimes, peak age-specific fecundity (m x) occurred on days 6–7 and was 14.2, 9.3, 1.0 and 0.0 offspring per female at 28.6, 30.0, 32.5 and 35.0 °C, respectively (fig. 2). In the oscillating regimes, peak fecundity occurred on days 8–10 and was 10.9, 10.2, 2.3 and 0.4 offspring per female at 28.6, 30.0, 32.5 and 35.0 °C, respectively.
Age-specific survivorship (l x) and age-specific fecundity (m x) of A. craccivora reared on asparagus bean at different constant (left panels) and oscillating temperature regimes (right panels). There were 40 individuals in each temperature treatment.

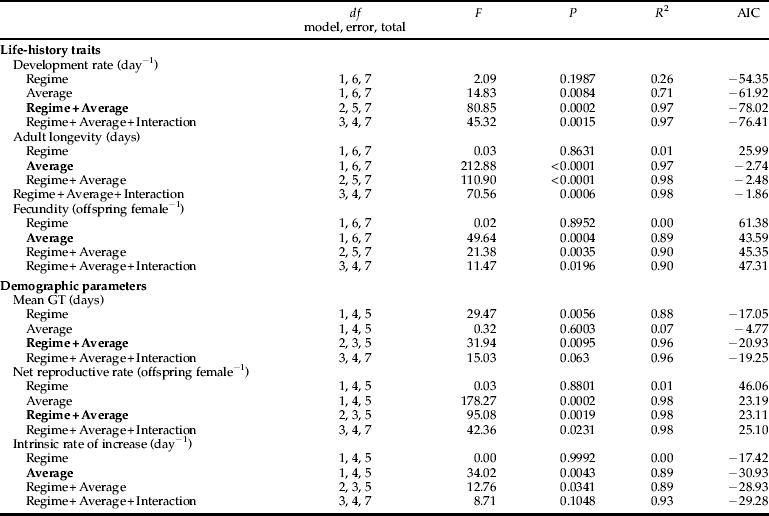
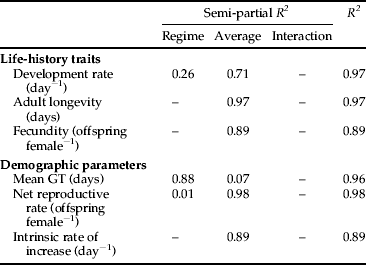
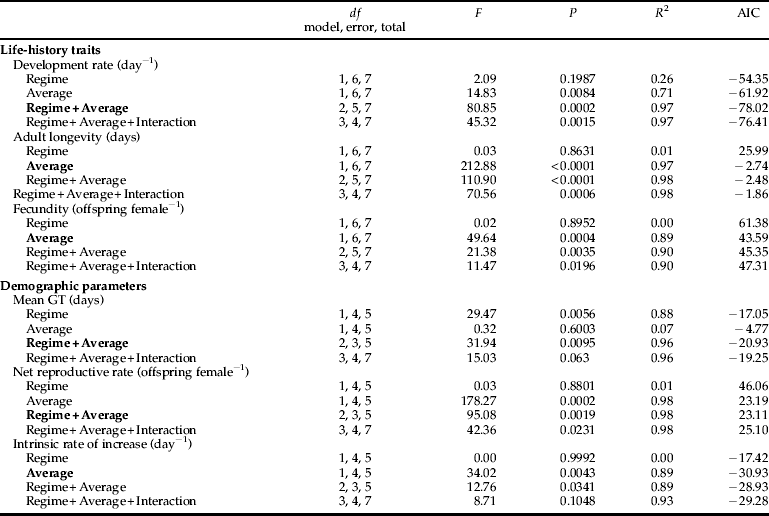
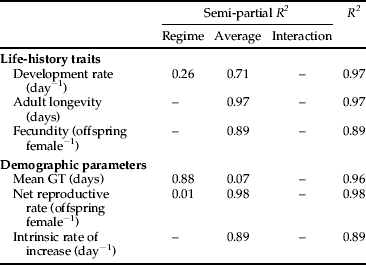
We used multiple regression analysis to determine the influence of the temperature regime (constant versus oscillating) and average (28.6, 30.0, 32.5 and 35.0 °C) on the life-history traits and demographic parameters of cowpea aphids (table 1 and Appendix). As aphids in the constant, 35.0 °C treatment failed to reproduce, we could not calculate r, R 0 and GT for this population and excluded these demographic parameters (for both constant and oscillating regimes) from statistical analyses. Except for mean generation time (GT), average temperature had major effects (semi-partial R 2 of 0.71–0.98) on all the life-history traits and demographic parameters (table 1). The temperature regime had a major effect on mean GT (semi-partial R 2 of 0.88), a minor effect on development time (semi-partial R 2 of 0.26) and few effects on the other variables (semi-partial R 2 of 0.01) (table 1).
The contribution of the temperature regime (constant versus oscillating) and average temperature (28.6, 30.0, 32.5 and 35.0 °C) to the variance in the life-history traits and demographic parameters of A. craccivora in the best model (see Appendix). All regressions are significant at P < 0.05.
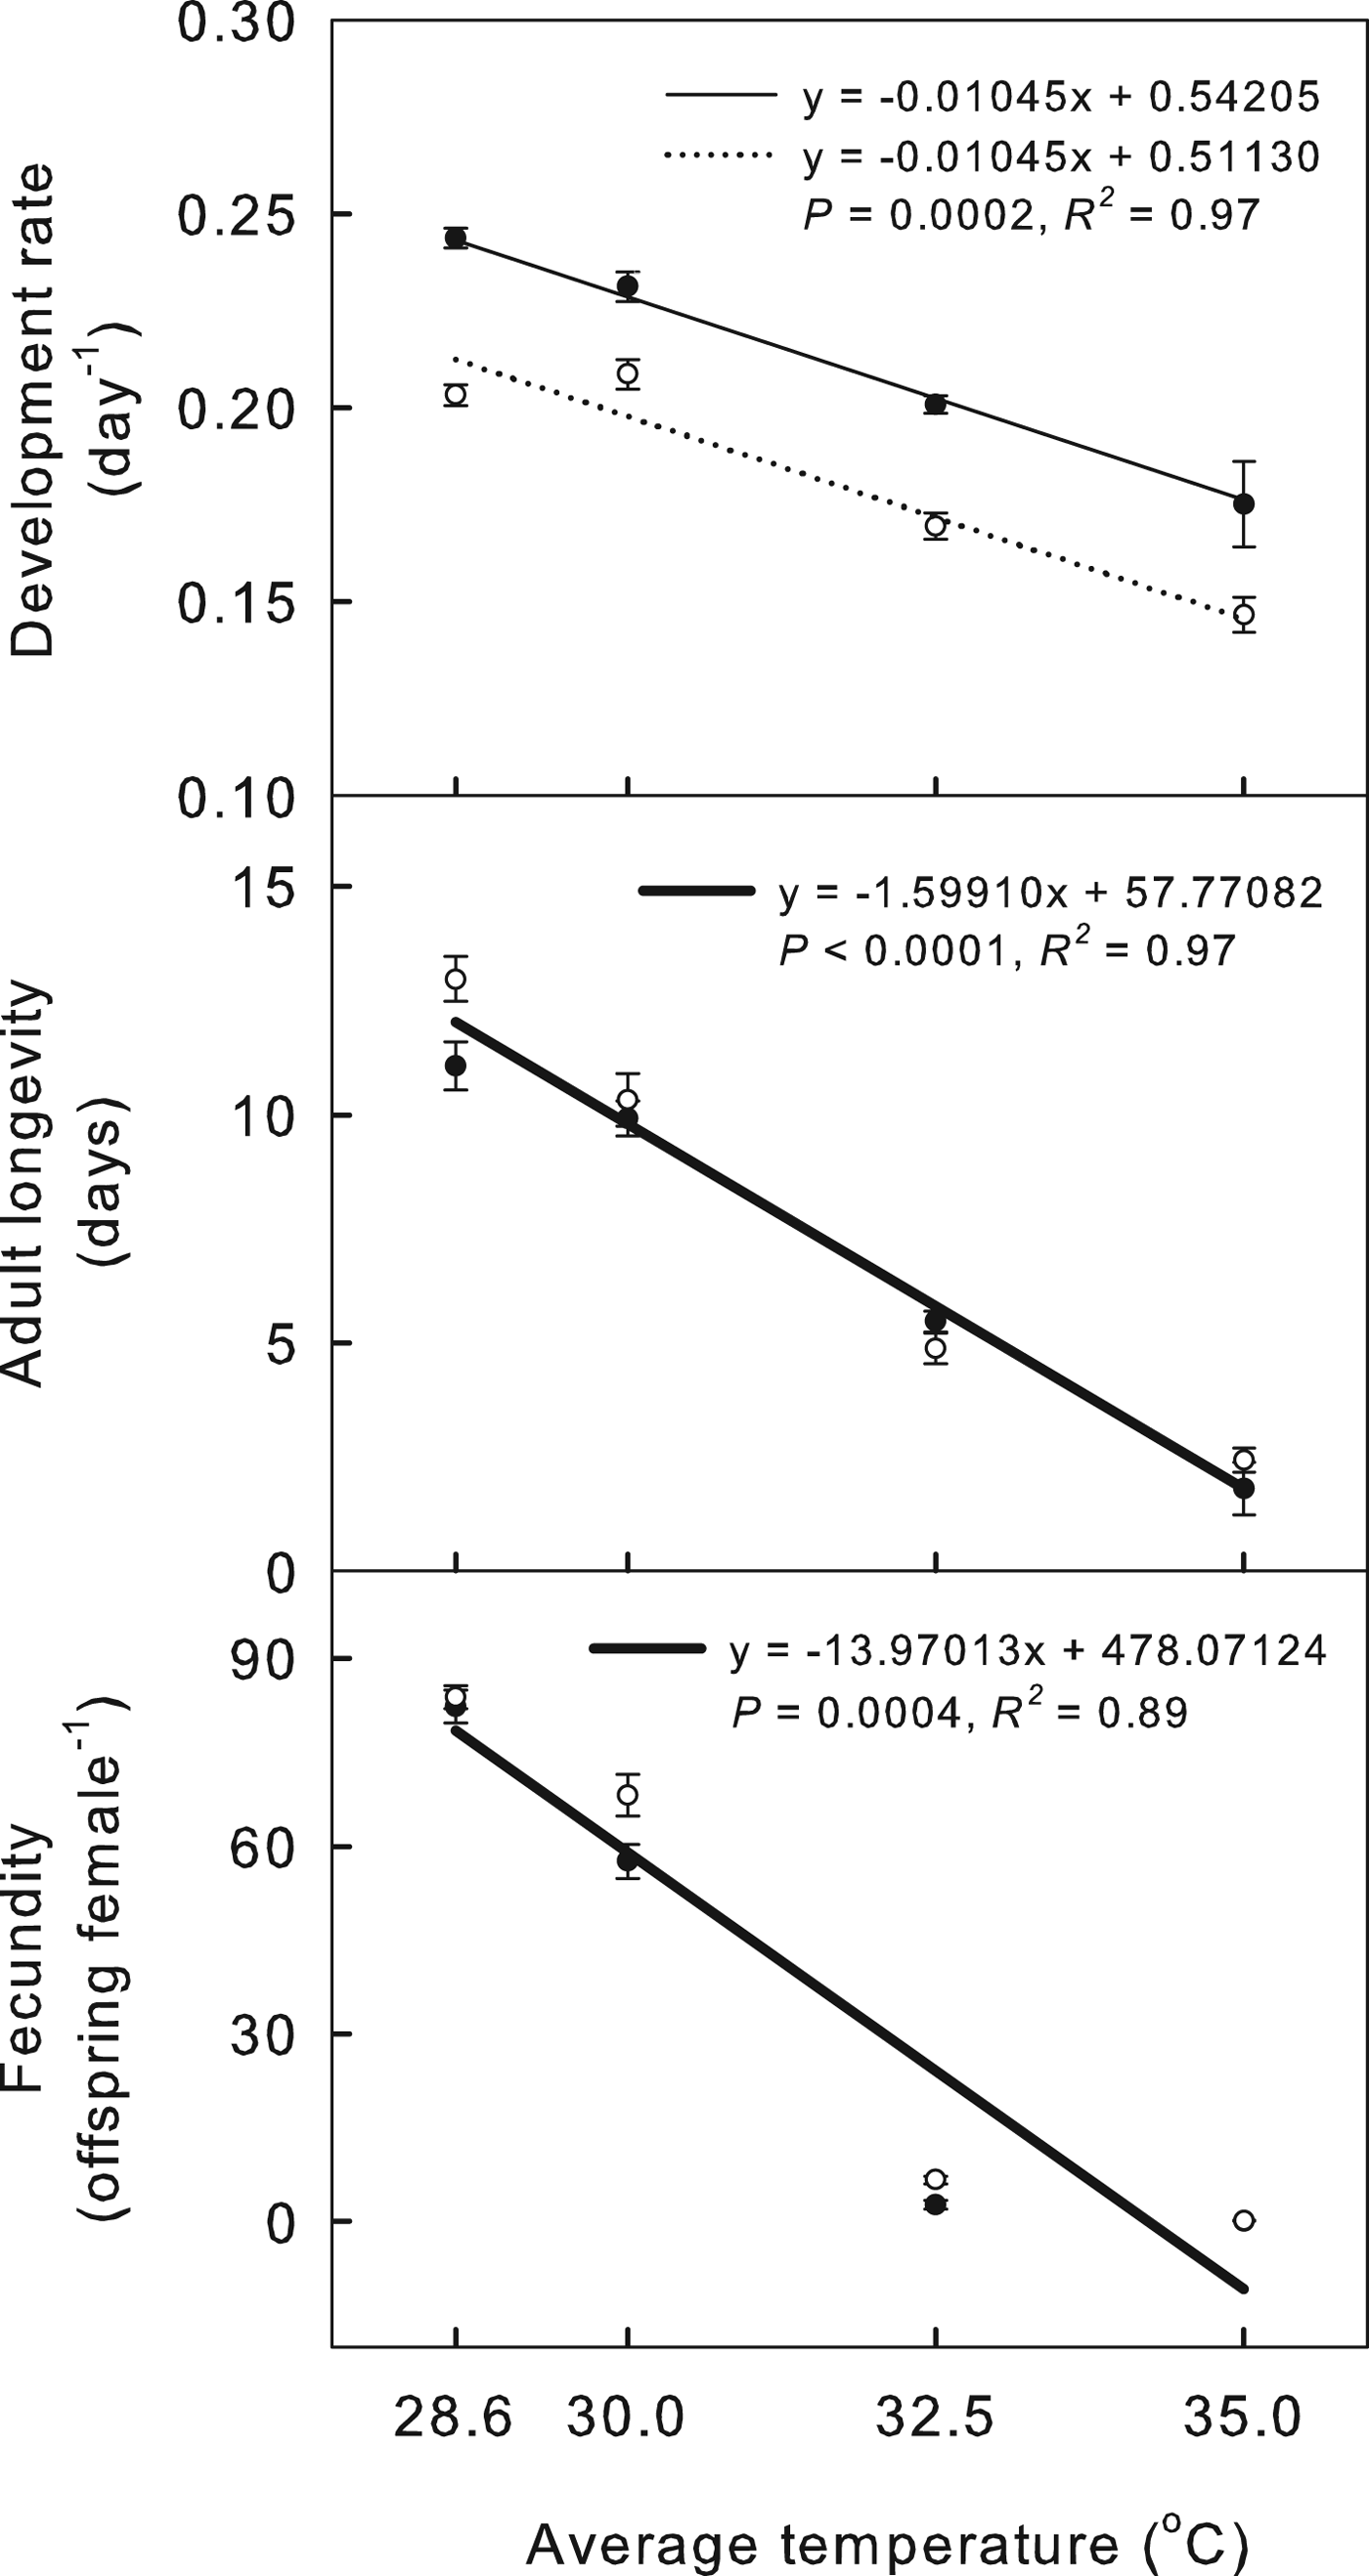
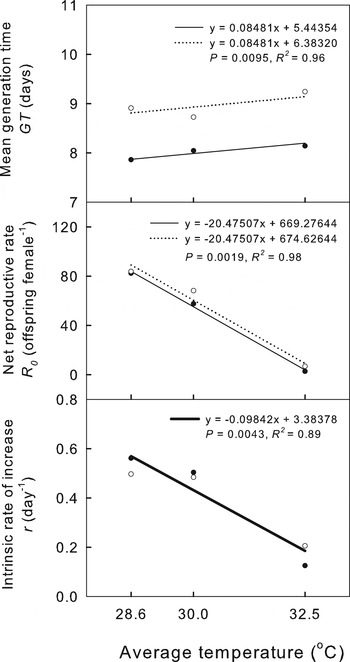
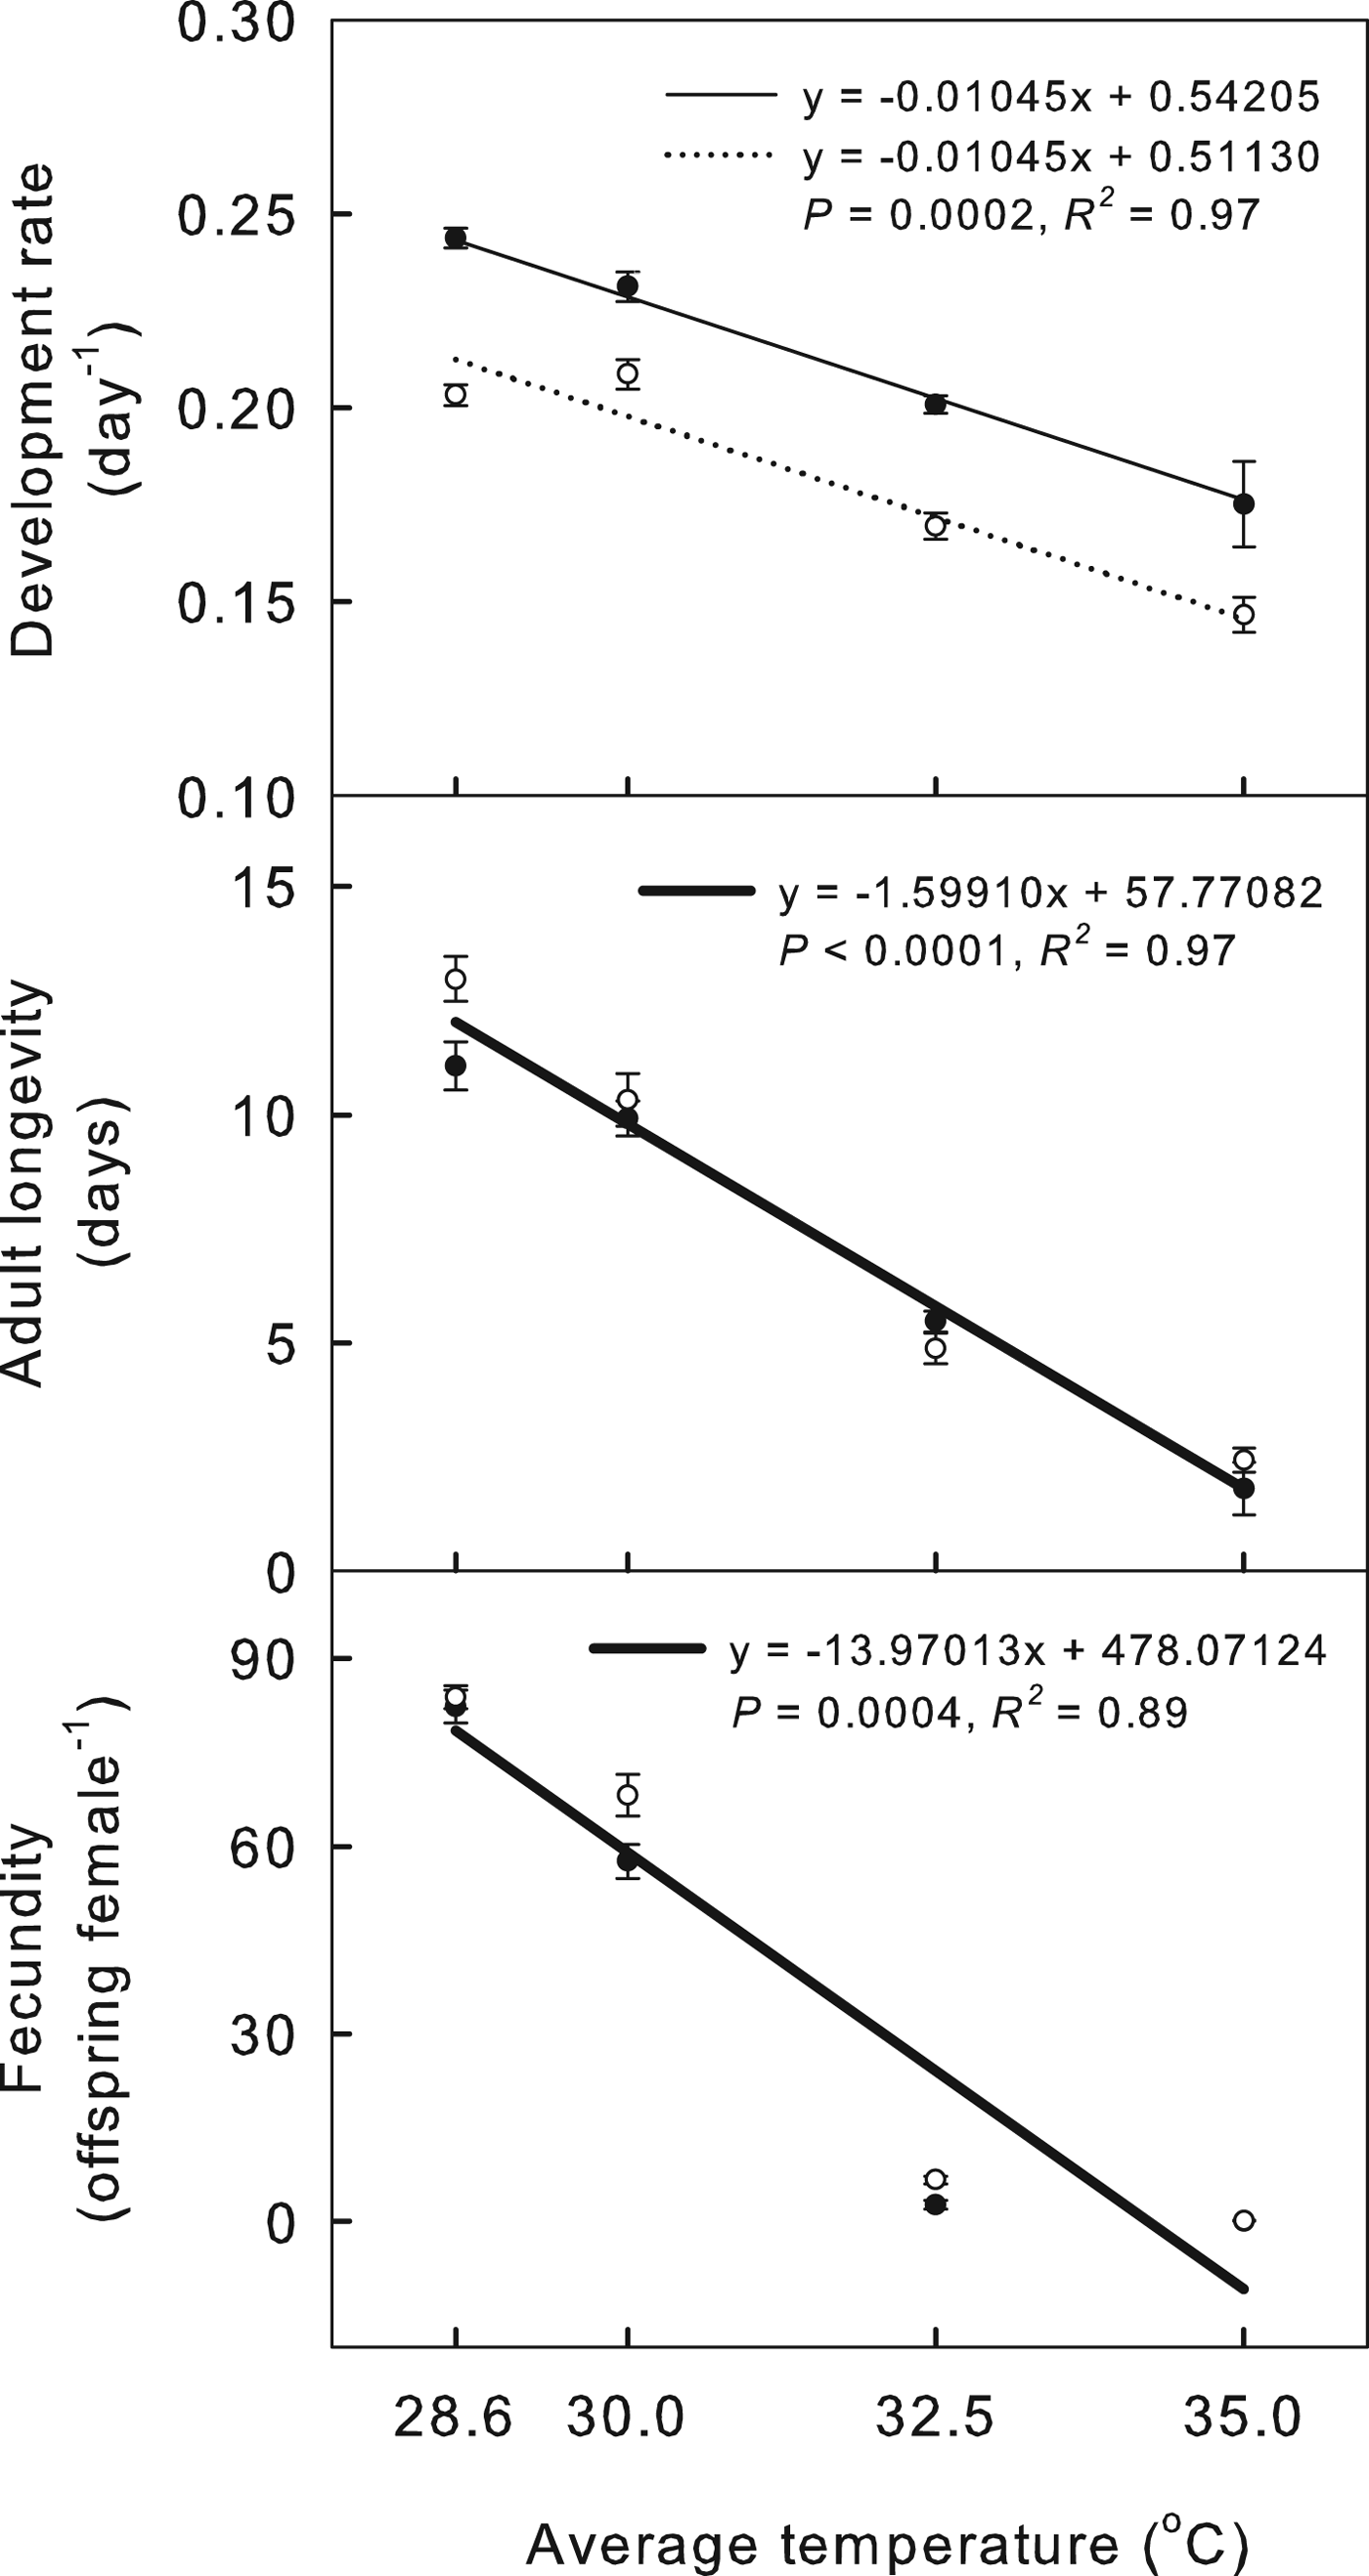
Regression equations show how the temperature regime and the average temperature affect the demographic parameters of cowpea aphids (figs 3 and 4). Values for cowpea aphid life-history traits, including development rate, longevity and fecundity, decreased as temperature increased (fig. 3). Cowpea aphid demographic parameters were also negatively affected by increasing temperature: mean GT increased and net reproductive rate (R 0) and intrinsic rate of increase (r) decreased (fig. 4). The development rate of aphids in oscillating temperature treatments was slower than that of aphids in constant regimes, but longevity and fecundity were not significantly different between constant and oscillating regimes (fig. 3). At 28.6 and 30.0 °C, aphids reared in constant regimes were larger as adults than aphids reared in oscillating regimes (fig. 3). Cowpea aphids reared in the oscillating temperature regimes had a longer mean GT and slightly higher R 0 than aphids in constant regimes, but r was not affected (fig. 4).
Effects of the temperature regime (constant versus oscillating) and average temperature (28.6, 30.0, 32.5 and 35.0 °C) on the life-history traits of A. craccivora in the best model. Black circles indicate the constant regimes, and white circles indicate the oscillating regimes. Thin lines show regression equations for constant temperatures, and dotted lines show regression equations for oscillating temperatures. A thick line indicates that the regime treatment has no effect. Bars indicate the standard error of the mean.
Effects of the temperature regime (constant versus oscillating) and average temperature (28.6, 30.0, 32.5 and 35.0 °C) on the demographic parameters of A. craccivora in the best model. Data from 35 °C treatments were excluded. Black circles indicate the constant regimes and white circles indicate the oscillating regimes. Thin lines show regression equations for constant temperatures and dotted lines show regression equations for oscillating temperatures. Thick lines indicate that the regime treatment has no effect.

Discussion
In this study, our objective was to understand and predict how low-latitude aphids will respond to warming, and to assess the consequences of diel temperature fluctuation on their demography. We described the effects of simulated increases in temperature on the physiology and demography of the aphid A. craccivora, a pest species in subtropical and tropical Taiwan. The results support the hypothesis that increased temperatures because of global climate change (IPCC, 2007) will likely exceed the physiological optima of aphids and have deleterious consequences because they are currently living very close to their optimal temperatures (Deutsch et al., Reference Deutsch, Tewksbury, Huey, Sheldon, Ghalambor, Haak and Martin2008). We found that the deleterious effects only on development rate and mean GT were more severe in oscillating regimes than in constant regimes. However, the temperature regime (constant or oscillating) had little or no effect on the other biotic variables. This was surprising because, for part of the day, aphids are exposed to higher, potentially lethal temperatures in the oscillating regimes.
Effect of average temperature
How insects respond to increasing environmental temperature depends on whether the temperatures fall within or beyond the range of temperatures suitable for the species in question. In general, within the range of suitable temperatures below the optimum, as temperature rises, so do metabolic rates (Dillon et al., Reference Dillon, Wang and Huey2010), which leads to faster developmental rates (Joshi, Reference Joshi1996; Musolin et al., Reference Musolin, Tougou and Fujisaki2010). In contrast, we found most life-history traits and demographic parameters were negatively affected by increasing temperature, indicating that most of the temperatures used in this study exceeded the range optimal for A. craccivora (Kuo et al., Reference Kuo, Chiu and Perng2006a; Hazell et al., Reference Hazell, Neve, Groutides, Douglas, Blackburn and Bale2010). In the severe warming treatment (35 °C), the temperature was high enough to kill some nymphs outright, decreasing their survival rate in this and other studies (Davis et al., Reference Davis, Radcliffe and Ragsdale2006; Kuo et al., Reference Kuo, Lu, Chiu, Kuo and Hwang2006b). As with other aphid species (Kuo et al., Reference Kuo, Chiu and Perng2006a, Reference Kuo, Lu, Chiu, Kuo and Hwangb; Lu & Kuo, Reference Lu and Kuo2008; Chiu et al., Reference Chiu, Chen and Kuo2012), at all elevated temperatures at least some nymphs reached adulthood, but they suffered decreased longevity and fecundity as adults.
As shown in our results, the negative effects of experimental warming on development, reproduction and survival negatively affected demographic parameters, including reproduction and population growth. Therefore, as a result of global warming, it is possible that large numbers of aphid nymphs will survive to adulthood, but most adults could fail to reproduce resulting in smaller populations during the summer.
Effect of the temperature regime
Most experiments on the effects of global warming have used constant temperatures, but this is not what organisms experience under natural conditions. As aphids would experience higher highs in the oscillating regimes, it was hypothesized that the aphids would perform better in constant regimes. However, the results are more complex and nuanced than expected. While development time and GT were longer in aphids reared in oscillating regimes, these aphids lived longer and had higher fecundity and reproductive rates. However, these differences are not significant. Interestingly, the intrinsic rate of growth at 32.5 °C was higher in the oscillating regime and no aphids were able to reproduce in the constant, 35.0 °C treatment. In addition, the difference between constant and oscillating regimes at 35 °C provides an interesting, tangential observation concerning the ability of aphids to survive acute versus chronic stress. Aphids in the oscillating regime faced temperatures greater than 35 °C, yet showed higher survival than those held at a constant 35 °C. This implies that aphids can survive higher, short-term temperatures as long as they have a chance to recover at lower temperatures.
Oscillating temperatures have been shown to have a number of effects, not all deleterious, on the growth, reproduction and other life-history traits of ectotherms (Montagnes & Weisse, Reference Montagnes and Weisse2000; Dhillon & Fox, Reference Dhillon and Fox2007; Estay et al., Reference Estay, Clavijo-Baquet, Lima and Bozinovic2010). In some cases, oscillating temperatures seem to benefit organisms, such as insects that exhibited faster development, and increased fecundity and longevity (Sweeney & Schnack, Reference Sweeney and Schnack1977; Joshi, Reference Joshi1996). In oscillating regimes, the intervening cooler intervals may allow ectotherms to recover from exposure to high temperatures or to resist the thermal stress from the hotter intervals (Davis et al., Reference Davis, Radcliffe and Ragsdale2006; Putnam et al., Reference Putnam, Edmunds and Fan2010). Moreover, behavioral or physiological periodicity may match the thermal regime. For example, feeding can occur during the cooler night and food assimilation during the hotter day to, possibly, produce more efficient growth (Brakefield & Kesbeke, Reference Brakefield and Kesbeke1997).
Constant versus oscillating regimes
The effects of simplified, constant temperature regimes versus oscillating regimes or natural temperature fluctuations probably will differ across species and depend on any trade-offs among life-history traits. In a different study, other aphid species in the oscillating temperature regime had greater fecundity and faster development than those reared at a constant temperature (Davis et al., Reference Davis, Radcliffe and Ragsdale2006). Even within a species, thermal optima and the effects of the temperature fluctuation may depend on where the source population originates (Ragland & Kingsolver, Reference Ragland and Kingsolver2008).
To understand the effects of oscillating temperatures, we must consider both the costs and benefits. Genetic variation within and among populations also must be considered. Clearly, while it is difficult to predict the effect of climate warming on populations of aphids and other organisms, it is equally clear that experiments designed to assess the effects of climate change must use temperature regimes that mimic those expected to result from global warming.
Conclusion
Worldwide concerns about the consequences of global warming have prompted efforts to understand and predict the responses of populations to changes in temperature (e.g., Davis et al., Reference Davis, Radcliffe and Ragsdale2006; Klapwijk et al., Reference Klapwijk, Gröbler, Ward, Wheeler and Lewis2010; Musolin et al., Reference Musolin, Tougou and Fujisaki2010). To evaluate biotic responses to warming we must look beyond simple increases in the mean temperature and include daily and seasonal fluctuations. These fluctuations may expose organisms to periods of sub-lethal and lethal temperatures, or they may allow organisms to better survive the warming than constant temperatures, as found in this study. In general, responses to temperature variability with warming are little studied and poorly understood (Estay et al., Reference Estay, Clavijo-Baquet, Lima and Bozinovic2010).
Global warming could have significant negative effects on tropical species (Deutsch et al., Reference Deutsch, Tewksbury, Huey, Sheldon, Ghalambor, Haak and Martin2008). We found that higher temperatures decreased the survival and reproduction of A. craccivora populations. However, thermal adaptation and migration could mitigate these effects (Hazell et al., Reference Hazell, Neve, Groutides, Douglas, Blackburn and Bale2010; Buermann et al., Reference Buermann, Chaves, Dudley, McGuire, Smith and Altshuler2011). To estimate the net effect of climate change on natural populations we must take into account the positive and negative effects of daily temperature oscillations and climate variability. This is especially important given the growing demand for accurately predicting biotic responses to climate change (Botkin et al., Reference Botkin, Saxe, Araújo, Betts, Bradshaw, Cedhagen, Chesson, Dawson, Etterson, Faith, Ferrier, Guisan, Hansen, Hilbert, Margules, Loehle, New, Sobel and Stockwell2007; Lawler et al., Reference Lawler, Shafer, White, Kareiva, Maurer, Blaustein and Bartlein2009; Musolin et al., Reference Musolin, Tougou and Fujisaki2010).
Acknowledgements
We thank several anonymous referees who commented on the manuscript. Meteorological data were provided by the Taiwan Agricultural Research Institute climate station in Wufeng District, Taichung City, Taiwan.
Appendix:
Multiple regression analysis for the effects of the temperature regime (constant versus oscillating) and average temperature (28.6, 30.0, 32.5 and 35 °C) on the life-history traits and demographic parameters of A. craccivora.