

Despite significant advances in the study of gender and politics and the roles of organized interests in the policy process, few studies consider their intersection. As women's presence in Washington, DC, and state capitols has expanded, political scientists have considered how gender shapes political behaviors ranging from voting (both in the electorate and governmental institutions), to the linkage between descriptive and substantive representation, and to styles of governing and communication. Similarly, as the number of organized interests has grown, political scientists have sought to understand the activities and influence of organizations in the political process. However, few scholars have considered how gender matters in communities of organized interests, particularly with respect to the male-dominated field of government relations, lobbying, and policy advocacy. Given findings regarding women's unique contributions and experiences in political office, the question of how women fare as professional lobbyists remains somewhat open. We address this gap by considering the following question: what consequences does gender have for professional lobbyists as elite political actors?
In answering this question, we extend research on gender and politics, lobbying, and the policy process in several ways. First, our research draws on a comprehensive dataset comprised of more than 550,000 Lobbying Disclosure Act (LDA) reports filed by nearly 30,000 interest organizations on behalf of more than 25,000 individuals registered to lobby the federal government from 2008 to 2015. We augment these publicly available data with new, originally collected data on lobbyists’ gender, information that is not provided in LDA records. Second, we examine gender differences at the interest organization and lobbying firm levels to reveal gendered patterns of participation in the lobbying profession both in terms of the nature of male and female lobbyists’ work and the extent to which women are over- or underrepresented in particular organizations and firms. Finally, we draw on original qualitative data collected from in-depth interviews with 23 female lobbyists to contextualize the findings of our large-N sample and to better understand how lobbying disclosure rules and uniquely political work structure influence women's professional lobbying experiences.
Interest Groups: Attention to Female Lobbyists
Studies of organized interests have underemphasized the role of individual lobbyists in the policy-making process. Frequently, the lobby organization itself, rather than its lobbyists, serves as the unit of analysis (Gray and Lowery Reference Gray and Lowery1996; Schlozman Reference Schlozman1984), whereas studies of lobbying tactics and strategies typically focus on issues and account for the political context in which they are considered (Baumgartner et al. Reference Baumgartner, Berry, Hojnacki, Kimball and Leech2009; Kollman Reference Kollman1998). Inattention to the role of individual lobbyists in the policy-making process assumes a uniform experience in the lobbying profession regardless of lobbyists’ descriptive identities. Furthermore, this approach sheds little light on whether the lobbying industry perpetuates racial, gender, and class imbalances in society and politics, topics that draw significant attention in studies of the political institutions engaged by lobbyists, such as Congress or the bureaucracy (Dittmar, Sanbonmatsu, and Carroll Reference Dittmar, Sanbonmatsu and Carroll2018; Dolan Reference Dolan2000; Keiser et al. Reference Keiser, Wilkins, Meier and Holland2002; Lazarus and Steigerwalt Reference Lazarus and Steigerwalt2018; Mastracci and Bowman Reference Mastracci and Bowman2015; Meier and Nicholson-Crotty Reference Meier and Nicholson-Crotty2006; Swers Reference Swers2002, Reference Swers2013).
Although scholars have examined organized interests for more than 50 years, studies of how gender shapes the world of lobbying are generally scarce, and they provide mixed evidence of how gender operates in federal and state lobbying. Kay Schlozman's (Reference Schlozman, Tilly and Gurin1990) study of female lobbyists working on behalf of women's rights organizations in Washington found differences in female lobbyists’ tactics, experience, and overall representation in the lobbying profession. Moreover, such representation differences may be exacerbated at the intersection of multiple marginalized identities (Marchetti Reference Marchetti2014; Strolovitch Reference Strolovitch2007). In their study of lobbyists across a variety of state-level organizations, Nownes and Freeman (Reference Nownes and Freeman1998) found women to be underrepresented in the state lobbying community and at the highest levels of the profession. Despite their numerical underrepresentation, female lobbyists were treated similarly to their male counterparts. Similarly, Bath, Gayvert-Owen, and Nownes (Reference Bath, Gayvert-Owen and Nownes2005) not only found women to be underrepresented in Washington lobbying communities but also found few behavioral differences between male and female lobbyists. Taken together, these studies suggest that as women become assimilated into lobbying communities, they conform to standards defined largely by men, thereby diminishing gender-based differences in treatment and behavior.
Lucas and Hyde (Reference Lucas and Hyde2012) provide a more recent study of gender differences in lobbying across all 50 states and introduce a temporal component by comparing survey data from 1994–1995 and 2004–2005. In keeping with previous research, women continued to lag behind men in terms of representation in state lobbying communities and had less experience working in the field. Men were more likely to be contract lobbyists working on behalf of a range of clients and were also more likely to represent business interests. In contrast, female lobbyists were more likely to work on behalf of public interest groups and to use grassroots lobbying tactics.
These findings are reinforced by LaPira and Thomas’ (Reference LaPira and Thomas2017) study of revolving-door lobbying, which shows that women are less likely to work as lobbyists after working in the federal government and that women are more likely to work as “in-house” lobbyists under a single employer. Among contract lobbyists, women are less likely than men to work for major, multiclient, K-Street firms that tend to recruit more clients and generate higher per-lobbyist revenues, a finding that reflects previous work by Rosenthal (Reference Rosenthal2001) and Thompson (Reference Thompson2002). Although they did not directly measure women's and men's compensation, these findings suggest that female lobbyists likely fall behind their male counterparts in terms of lobbying income and prestige within the profession. The gaps between men and women in the lobbying profession do not appear to be insurmountable, yet these studies collectively suggest that women remain outsiders in government relations. They also raise questions of whether the extent of gender imbalance in lobbying is similar to well-documented gender imbalances in other professional work.
Gendered Structures of Work
Research on gendered patterns of work have shown that sex segregation occurs across a variety of fields and that men and women often work in gender stereotypic substantive areas for differing levels of pay and prestige. For example, within the medical field women comprise more than 90% of nurses (Department of Labor 2014) whereas men comprise more than 60% of all physicians and surgeons (Bureau of Labor Statistics 2012). Among doctors, women are overrepresented in family-oriented care, such as pediatrics and general family medicine, in women's health as obstetricians and gynecologists, and in psychiatry. Meanwhile, men are overrepresented in lucrative fields such as surgery, neurosurgery, and anesthesiology and within emergency medicine and radiology (American Medical Association 2015).
In the legal profession, which has a fair degree of overlap with that of lobbying (Heinz et al. Reference Heinz, Laumann, Nelson and Salisbury1993), women comprise approximately 36% of all lawyers, but they are overrepresented at lower levels of the profession, comprising only 20% of equity and managing partners at the 200 largest law firms (American Bar Association 2017; National Association of Women Lawyers 2018). In terms of prestigious legal positions, 75% of legal counsels for Fortune 500 companies are men. Both trends likely contribute to persistent pay disparities between male and female lawyers (American Bar Association 2017). In business, only 27% of chief executives are women (Department of Labor 2017), and although women constitute nearly 45% of all employees in Standard and Poor's 500 companies, they are overrepresented at the lowest levels of the corporate hierarchy. Women comprise only 37% of first and mid-level managers and only 5% of chief executive officers (Catalyst 2017). Across the professional fields of medicine, law, and business, women are overrepresented in less lucrative, lower-level positions in gender stereotypic substantive areas.
Within politics, women comprise just less than 24% of members of Congress and approximately 29% of state legislators. Women fare similarly in state-wide elected office and mayoral positions: approximately 18% of state governors and 26% of mayors of major US cities are women (Center for American Women and Politics 2019). In terms of substantive focus in office, women legislators are more likely than their male colleagues to work on bills related to women, families, and health care, particularly women's health (Jeydel and Taylor Reference Jeydel and Taylor2003; Swers Reference Swers2002). Although research shows that gender imbalances in elected office are largely due to gendered differences in political ambition rather than in voters’ willingness to support women candidates (Lawless and Fox Reference Lawless and Fox2010), the fact remains that women are underrepresented in both politics and in the professions that often lead to political careers.
We anticipate that the forces driving gender differences in lobbying, politics, and other professions have similar effects in D.C. lobbying and expect to find fewer women working in the most prestigious and lucrative subsets of the profession.
Explanations for gendered trends in occupation and politics vary, but they frequently engage the effects of gender socialization, gender bias within social networks, and issues of work–life balance. Traditional gender role socialization emphasizes women's roles as caretakers, and women may turn to gendered career paths such as nursing, elementary school teaching, and caretaking because of societal expectations and/or familiarity with these occupations (Correll Reference Correll2001). Given the connection of lobbying to male-dominated governmental institutions, it is likely a gender atypical career choice for women, which contributes to the overrepresentation of men in government relations.
Gender bias in social networks may also affect hiring and promotion patterns within a range of occupations, including politics and lobbying.
As people tend to hire and promote others like themselves, male-dominated fields such as business, law, and politics have been slow to incorporate women at all levels and particularly at the leadership level where the bulk of hiring and promotion decisions are made (Cohen, Broschack, and Haveman Reference Cohen, Broschak and Haveman1998; Glass and Cook Reference Glass and Cook2016; Reskin Reference Reskin2000). This may similarly affect gendered patterns of hiring and promotion in lobbying organizations, with women concentrated at lower levels of firm hierarchies and/or in less lucrative lobbying positions.
Even though women now work outside the home at rates that are nearly equal to that of men (Bureau of Labor Statistics 2017), they continue to shoulder the bulk of household labor and caretaking (Bureau of Labor Statistics 2016). A good deal of lobbying work takes place outside of typical 9-to-5 work schedules, including campaign fundraising, professional networking, work-adjacent socializing with current and prospective clients, and events related to “lobbying days” and “fly-ins” to the capitol. Female lobbyists may structure their career choices around their ability to balance these politically idiosyncratic demands on their time with their disproportionate labor expectations at home. This may result in fewer women working in lobbying positions that require long hours or frequent time spent at evening networking and fundraising events.
Although prior studies provide some idea of how gender matters in lobbying work, interest group research that places gender at the fore is based primarily on surveys drawn from samples of the lobbying profession. Although survey findings may generalize to the population of lobbyists, a complete view of how gender matters in DC lobbying is missing.
By linking lobbying information disclosed in documents required under the Lobbying Disclosure Act of 1995 and the Honest Leadership and Open Government Act of 2007, we examined gendered patterns of work among the full universe of lobbyists, their employers, and the interests they represent. We used a deductive approach to identify broad patterns of men's and women's lobbying employment within the full universe of lobbyists working in Washington, DC, from 2008 to 2015. We augment these analyses with an inductive approach using qualitative data from in depth interviews with a subsample of female lobbyists. These interviews have provided deeper insight and explanations for the gendered patterns that emerge from the aggregate data.
Quantitative Data and Classification of Gender
To analyze gendered patterns in lobbying, we used the census of 25,281 lobbyists registered at the federal level between 2008 and 2015 collected by the Center for Responsive Politics (CRP) from records made public as part of the Lobbying Disclosure Act (LDA). This dataset contains information about organized interest clients, lobbying firms, and the lobbyists employed or retained by them. For each client or lobbying firm, registrantsFootnote 1 report expenditures (or lobbying revenue) and the identities of individual lobbyists associated with these activities.
To these new data, we added lobbyists’ gender, defined simply here as male or female, which allowed us to examine patterns in men's and women's employment as lobbyists. To classify the gender of each of these 25,000 lobbyists, we parsed the first names of each lobbyist from their full name records provided and cleaned by the CRP. Next, we used an automated matching method to compare first names of lobbyists to individuals born in the United States between 1940 and 1995.Footnote 2 We matched 3,283 unique first names to the Social Security Administration (SSA) Baby Names database (Mullen Reference Mullen2016).Footnote 3 When a match was found, we recorded the proportion of individuals in the SSA dataset that are either male or female in gender. Although some first names have high proportions of matches for one gender or the other (e.g., Scott was 99.6% male and Wendy was 99.7% female), whereas others are less reliably matched (e.g., Casey was 58.8% male and Pat was 59.8% female).
After dropping 341 lobbyists whose genders were not manually identifiable by name alone and accounting for additional name disambiguation issues (e.g., such as lobbyists with different first names or initials listed across multiple disclosure forms), we engaged in a manual process to classify and verify the coding of each lobbyist's gender. In fall 2016, three research assistants conducted supervised online searches for all lobbyists whose names were not found in the SSA database and for those whose matches were less than 85% female or male. This resulted in the addition of 568 nonmatching observations and the coding of 608 lobbyists below the threshold. In addition, we manually verified the coding of 1,172 lobbyists whose name matches were between 85% and 98% female or male, and we made corrections in 7% of cases. Searches involved locating and browsing associated lobbying firm or organization staff directories, commercial lobbyist and lawyer directories, LinkedIn profiles, and news articles that mentioned gender pronouns. Our resulting dataset includes gender information on 24,103 lobbyists, with 2,348 (9.7%) manually coded or verified because they fell below conservative thresholds for matching.Footnote 4 Overall, we categorized 15,039 (62.4%) as men and 9,064 (37.6%) as women.
By adding gender information to our dataset of more than 550,000 lobbying disclosure reports, we examined gender across registrants (lobbying firms or in-house employers). Thus, we linked individual-level characteristics to population-level patterns in lobbyists’ structure of work and representation of interests. We generated two simple measures to study aggregate gender distributions across our data: percentage women and gender balance.
For any given interest organization that employs in-house lobbyists or lobbying firm that contracts services of lobbyists to multiple clients, the percentage of women was calculated as the number of female lobbyists divided by the total number of lobbyists, multiplied by 100. The second measure, gender balance, was the number of female lobbyists minus the number of male lobbyists. Positive values indicate an imbalance favoring women to men (and vice versa for negative values) within any given interest organization or lobbying firm. Although the percentage of female lobbyists enabled direct comparisons in proportional terms across registrants, a percentage of 25% would occur for both an organization with one woman among four lobbyists and an organization with 25 women among a staff of 100. In contrast, gender balance provides a distinct and similarly descriptive measure of gender differences across both lobbying registrants and clients. Using the same example as above, a firm with one woman out of four lobbyists has a gender balance of −3. In contrast, an organization with 25 women among 100 lobbyists has a gender balance of −75. We used both measures to assess patterns of male and female lobbying across different lobbying work settings (i.e., in-house vs. contract), firms, and organizations.
Qualitative Interviews
We supplement our empirical analysis with in-depth interviews conducted with active female lobbyists from May to July 2017. We drew on three sources to generate respondents: pre-existing contacts with lobbyists (three respondents, 11%), suggested contacts from a professional organization representing female lobbyists (six respondents, 22%), and a randomly ordered list of registered lobbyists (evenly mixed between contract/in-house lobbyists active in the fourth quarter of 2015) whom we had previously classified as women using our automated and manual processes (15 respondents, 56%), and snowball sample contacts (three respondents, 11%). When contact information was not readily available for those respondents listed in lobbying disclosures, a simple Internet search of organization/firm webpages yielded phone numbers and e-mail addresses. Through a mix of cold calls and e-mails, we recruited 23 total respondents and conducted interviews either in person (in Washington, DC) or via telephone. Each interview lasted approximately 40 minutes, on average. We used a semistructured interview protocol that included questions about respondents’ pathways to lobbying, the structure of their firms/offices, their issue expertise, gender-related issues specific to the lobbying profession and the political nature of their work, and work–life balance.
Our interviewee recruitment efforts were not intended to be representative of the lobbyist population because we were limited by resource constraints associated with time and travel. Thus, we prioritized conversations with female lobbyists and maximized the breadth of employment categories in which respondent lobbyists worked. Our respondents span nearly all possible types of employment in the government relations field: a Fortune 50 corporation, boutique contract lobbying shops, large law firms, a small bipartisan firm, trade associations representing industries, and professional associations representing individuals from a variety of professions and industries. Those lobbyists we interviewed also represent a wide range of industries and issues, from traditionally male-dominated fields to those more typically thought of as ‘women's issues,’ and many in between. Respondents varied in years of experience previously working in government and in their current role as lobbyists. Partisan affiliation and age also varied, though respondents did not systematically prompt these identities. Although most respondents previously held positions in government (spanning Congress, the White House, and an executive agency), others came into lobbying directly. All of our interviewees self-identified as women; only two voluntarily identified themselves as persons of color.
Gendered Patterns in Lobbyists’ Work Structure
We first used lobbying disclosure data to investigate how interest organizations employ in-house lobbyists and how multiclient lobbying firms hire contract lobbyists by gender. There are key structural differences in how in-house and contract lobbyists work, especially with respect to how many clients they represent. In-house lobbyists, by definition, represent one client (their employer), whereas contract lobbyists may represent any number and variety of clients. Across the 7,680 unique organizations registered between 2008 and 2015, the mean percentage of female lobbyists was 31.5%. Of those consulting firms or organizations with more than one lobbyist, there were approximately 2.8 men for every one woman (overall mean percentage of women = 35.7%; standard deviation (SD), 28.6; range, 0%–100%).Footnote 5
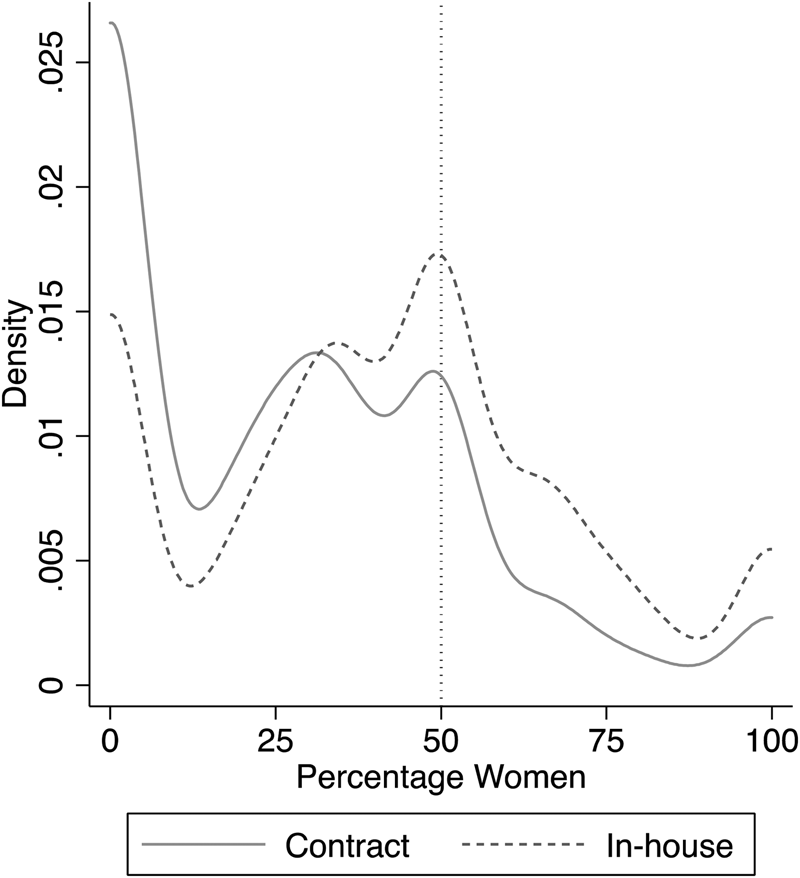
Following LaPira and Thomas (Reference LaPira and Thomas2017), we expected differentiation in lobbyists’ gender according to whether a registrant is a contract lobbying firm or an in-house employer. Figure 1 shows the probability density function of female lobbyists across these two registrant types, for firms or organizations with more than one lobbyist on staff. Although the number of organizations with no female lobbyists on staff is not enormously different between in-house (n = 502) and contract lobbying firms (n = 554), organizations with in-house lobbyists generally have larger percentages of their staff composed of women. Indeed, the number of in-house lobbying organizations with women comprising at least 50% of their lobbying staff (n = 1,166) is far greater than that of lobbying firms (n = 395). These differences are evident in the clear rightward skew of the density distribution of female lobbyists among contract firms.
Percentage of women lobbyists by registrant type, 2008–2015.

The women we spoke with verified these descriptive results and offered some context to help explain the causes and consequences of women's representation in lobbying firms. Several interviewees described the work culture in Washington, especially in lobbying firms, as reflecting traditional gender-role stereotypes. Public lobbying disclosure data alone do not reflect women's experiences, even though they are treated as equals when we count lobbyists in different professional roles. Consider how one contract lobbyist described her perception of the lobbying industry:
You pull up the top 20 lobbying firms in DC. If I'm not mistaken, there are only two—maybe three—that are owned and run by women. [Major lobbying firms are] still very heavily dominated [by men] at the senior level in every firm.
I have heard—and I have seen with my own eyes—female lobbyists of a certain caliber, with multiple degrees, either willingly or unwillingly doing lunch plans for people. You have a client coming in [to Washington] and they want to know where they should go, where they should stay, where they should eat. If it's an e-mail chain, I almost always see the male person say, “Well, I like this place, but this [insert lady's name] might know more.” Then the lady has to answer where the best place to dine might be, where the best place to stay might be. … I know you're talking about females that lobby, but sort of the underbelly of all of that is the administrative world inside of these firms, which is almost exclusively women and almost exclusively people of color.
Assuming that this interviewee's observation is not unique, our measures of women's presence in lobbying firms, already lower than would be expected in the general population, may overstate their perceived political expertise by many of their male counterparts. The difference between women's formal inclusion in lobbying firm disclosures and their perceived role as lobbyists-slash-travel agents highlights this bias. It also reflects the fact that women in professional elite politics may need to work harder to achieve similar outcomes as men (Lazarus and Steigerwalt Reference Lazarus and Steigerwalt2018). Not only do women face barriers to entry in the most lucrative and highly respected positions in the profession, they may also be expected to engage in additional tasks that are customary for firms to offer clients to maintain relationships, especially those associated with the socializing and nurturing roles that women are traditionally expected to play. The quantitative LDA data do not allow us to test this example as a generalizable hypothesis, but they do suggest that interest group scholars ought to explore more deeply what different advocacy activities ostensibly equal female and male lobbyists offer to organized interest clients.
Not all lobbying positions are in multiclient firms, of course. We can intuitively expect the work culture to differ dramatically in an in-house setting from that of an external consulting setting. The average proportion of female lobbyists working for in-house lobbying organizations is 41% (SD, 29), whereas the average at contract lobbying firms is more than 13% lower at 27% (SD, 26). A two-tailed difference of means test shows that these averages are statistically different from one another (p < 0.001). These differences, both in the distribution of the percentage of female lobbyists in Figure 1 and in the overall average percentages of female lobbyists by work structure, indicate clear distinctions between in-house and contract lobbying organizations’ recruitment and retention of female lobbyists.
The discrepancies between women's employment as in-house versus contract lobbyists may be partially due to the different structure of work at contract lobbying firms. Although both are considered lobbying, they offer very different opportunity structures to impact the policy process. A consistent point made during our conversations with female lobbyists is that contract lobbying firms, particularly those that are law firms, are more likely to bill by the hour. Although this may not initially seem to be a major issue, or even one that is gendered, it seems to affect women's desire to work as contract lobbyists at major firms. Many women described how billable hours hindered their ability to have and to spend time with their families and to undertake necessary tasks at home. A government relations professional who moved from a firm to work in-house discussed how her decision to change positions was partially due to the nature of work in contract lobbying:
My main area of comparison is work that I did in private law firms where certainly the expectation was that I would be at the office until at least 7:00, and during kind of busy periods I would be there until 9:30 or 10:00 at night … the work schedule that I'm able to keep at my nonprofit is much more manageable than when I was at a law firm. At that time [working at a private law firm] I also didn't have children, so I was not having to juggle childcare issues or caregiving issues… When I was at a law firm, I was concerned that if I had children the schedule was not going to be tenable.
The decision to leave law or lobbying firms in favor of a different work structure was not uncommon among female lobbyists. For example, when asked about work–life balance in her current career path, one in-house lobbyist at a Fortune 50 corporation put it this way:
I went in-house, and I chose not to go to the big law firms [in Washington, DC]. My husband did as well. I had my kids late at 36 and 39. But we have friends, especially here in DC, who are in the same biz and they're at big law firms. They don't see their kids on the weekends.
I have a friend who says to me, “We try to have family dinner every Sunday.” For the most part, we have dinner [every day]. I leave work because I have flex time… I leave home while everybody's still sleeping, but I'm able to have dinner with them every night or go to their sports every night.
Undoubtedly, these kinds of work–life balance issues are common to most professions. This conversation reveals the implied expectation that contract lobbyists work long hours, which is often dictated by the legislative calendar, electoral cycle, or the demands of clients visiting Washington.
Thus, generalized differences in women's and men's lobbying employment are also related to the political context of professional work in Washington. The fact that these political context differences are not revealed is merely an artifact of the disclosure system, which makes them appear equivalent. The expectation that contract lobbyists more frequently participate in after-hours events, coupled with the traditional perception of women in elite politics, disproportionately impacts women's options to seek employment at “big law” firms, or perhaps even as lobbyists at all. One lobbyist working at a professional association described the tensions created when the need to be in Washington conflicts with female lobbyists’ second shift at home:
When I was in the corporate world, having kids and all that, maternity leave was really kind of new … maybe today corporations have a better structure for work–life balance, and if you're a nursing mother and accommodations for that kind of thing and daycare on site. We [lobbyists] don't have any of that and I don't have flex time. My job is to be in DC and I cannot do my job if I'm not in DC. I have some of my best meetings just because I ran into somebody on the sidewalk. You can't work from home and have a baby attached to you. [Lobbying] does not lend itself to that.
Several unique aspects of the lobbying profession emerge from this woman's narrative. First is the fact that so much of lobbying happens in person and centers on building and maintaining relationships. Often, this means lots of face time between individual lobbyists and the policy makers they are speaking with, the clients they are representing, or other lobbyists with whom they are collaborating on an issue. That working remotely from home or avoiding after-hours social functions is not an option is a strongly enforced informal institution. The pressure to attend evening events is acute for all lobbyists, but it can be particularly difficult for women with families. The lobbyist quoted in the preceding text went further, explaining that childcare, particularly flexible childcare, has been one of her largest expenses because typical daycare hours simply do not fit into a lobbyist's schedule:
I had to have a full-time nanny, and occasionally you do have to work late, so you've got to have really flexible childcare. That is very expensive. Daycare is probably not going to be an option for a lobbyist. They have to have live-in or close to live-in childcare.
These challenges (e.g., working late hours, attending evening dinners and fundraisers, and being available to clients visiting from out of town) disproportionately affect female lobbyists working in contract lobbying firms because their structure of work differs significantly from that of in-house lobbyists.
Systematic Gender Imbalance Across Organizations and Firms
We next use lobbying disclosure data to explore the differences in women's work as in-house versus contract lobbyists by considering the relative balance of women to men within lobbying organizations. Although the percentage of female lobbyists is a meaningful measure, it does not convey information about the size of a given organization's lobbying capacity. Specifically, we used gender balance to assess the absolute difference in men and female lobbyists’ structure of work. In the aggregate, gender balance differences by registrant type are also visible under this measure: the mean gender balance of in-house employers is −0.92, whereas the mean of contract firms is −2.9. We interpreted these values to simply mean that in-house employers, on average, employ about one more male than female lobbyist, and contract firms employ nearly three more men than women.
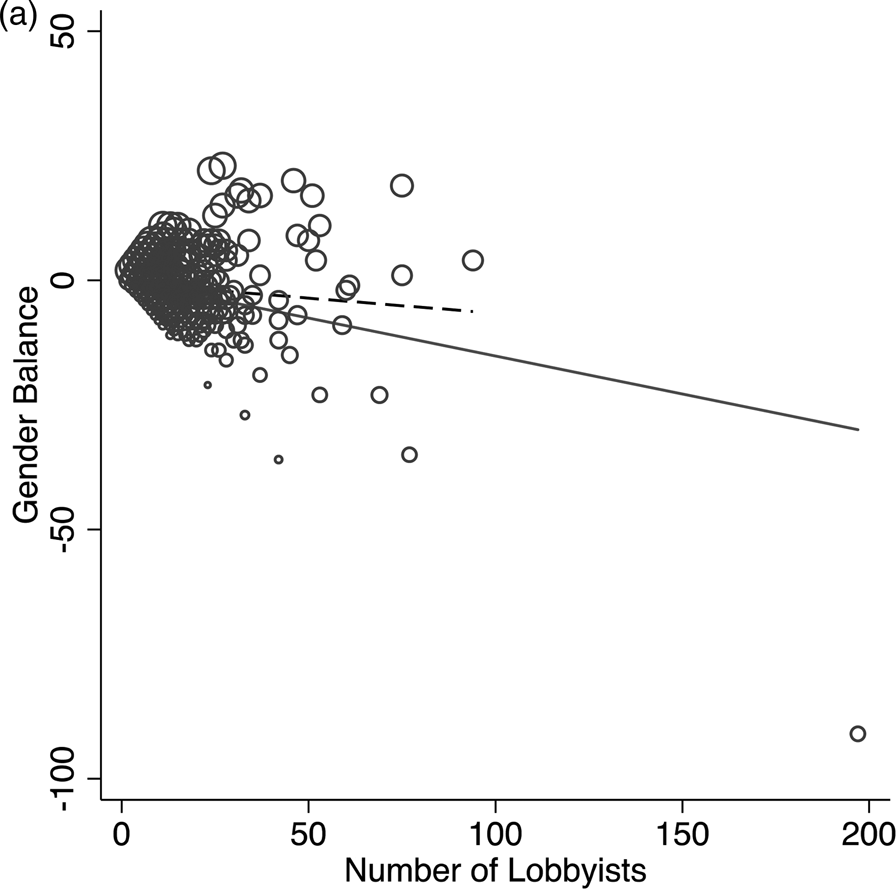
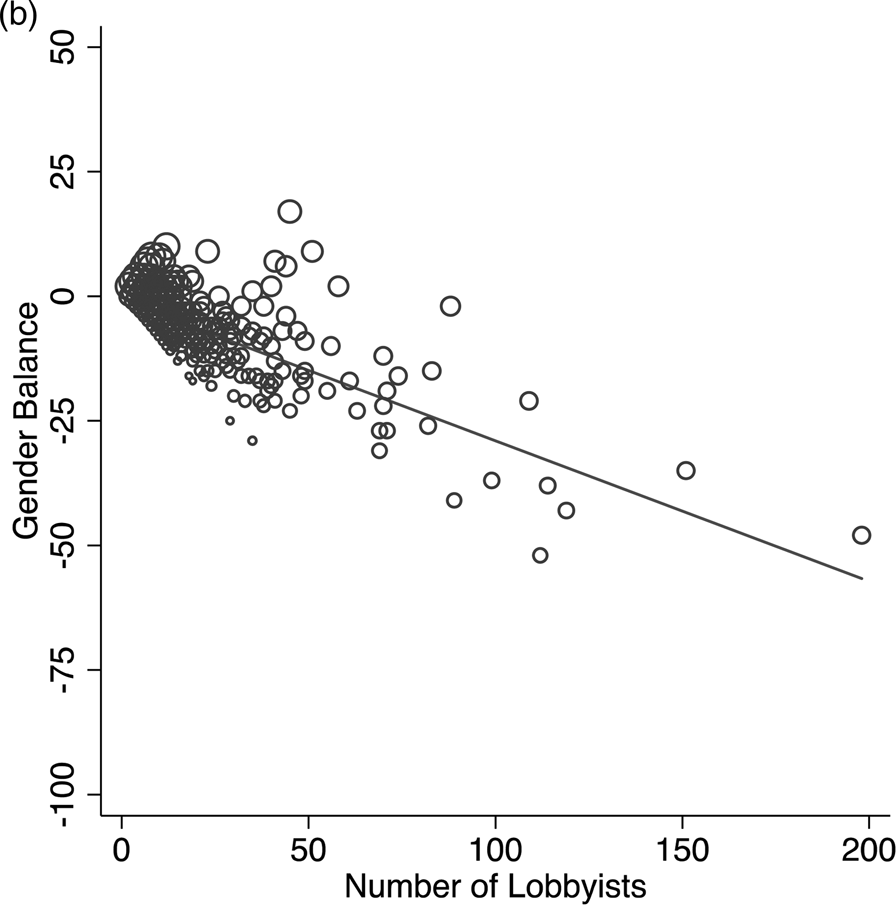
These differences become clear when we plotted gender balance by the number of lobbyists employed by each organization. Figure 2 shows our plots of gender balance (with scatter points weighted by percentage of women) across the number of lobbyists employed by both organizations with in-house lobbyists (Fig. 2A) and contract lobbying firms (Fig. 2B). We observed greater gender imbalances within larger organizations in both cases, but more extreme imbalances occurred among contract lobbying firms. The US Chamber of Commerce has an exceptionally large gender imbalance, employing 91 more men than women within their uncharacteristically large cadre of nearly 200 lobbyists.Footnote 6 After excluding this outlier observation for in-house lobbying organizations, the slope of the dashed, fitted line is nearly flat (β = −0.06; SE, 0.010). Almost all in-house lobbying organizations have fewer than 50 lobbyists on staff; an average gender balance at or close to zero indicates relatively equal numbers of men and women on staff. Contract lobbying firms, on the other hand, have a wider size range with more organizations employing 50 or more lobbyists. In addition, the gender imbalance among large contract lobbying firms is approximately 4.5 times greater (β = −0.28; SE, 0.007). The lobbying firms’ steep, negative slope confirms a strong bias toward the hiring of men in large contract lobbying firms. Moreover, the standard errors suggest that contract lobbying firms are also more consistently biased toward men than are organizations with in-house lobbyists.
In-house lobbyist gender balance.

Contract lobbyist gender balance

The larger the lobbying firm's roster of lobbyists, the larger the gender imbalance. Additionally, there are important substantive differences between in-house and contract firm lobbyists that may contribute to these observed gender imbalances. In-house lobbyists are employed by a specific organization; thus, they may wear several hats in that position. Not every organization has the funding or staff capacity to employ a full-time lobbyist, yet an organization may need to have their interests represented in government. As such, a “public affairs” staffer may split her time between lobbying, public relations, and other needs of the organization. This may be particularly true for organizations with fewer resources (e.g., citizen organizations vs. corporations) in which women comprise a larger proportion of the staff (Nownes and Freeman Reference Nownes and Freeman1998).
In contrast, contract lobbyists may be either topical generalists who focus exclusively on the political process or issue specialists who, along with teams of other issue specialists, collectively offer “all of the above” coverage of the client's policy agenda (LaPira and Thomas Reference LaPira and Thomas2017). As political connections and previous time serving in official government positions can be critical components to contract lobbying, women's underrepresentation in elected office and in senior government appointments places women at a structural disadvantage in this field. Furthermore, contract lobbyists frequently use informal social and political networks that extend beyond balkanized policy domains to aid in their lobbying. If women are excluded from elite social networks in politics and other high-powered fields (e.g., business, finance), they likely face additional barriers in the world of contract lobbying (Lucas and Hyde Reference Lucas and Hyde2012).
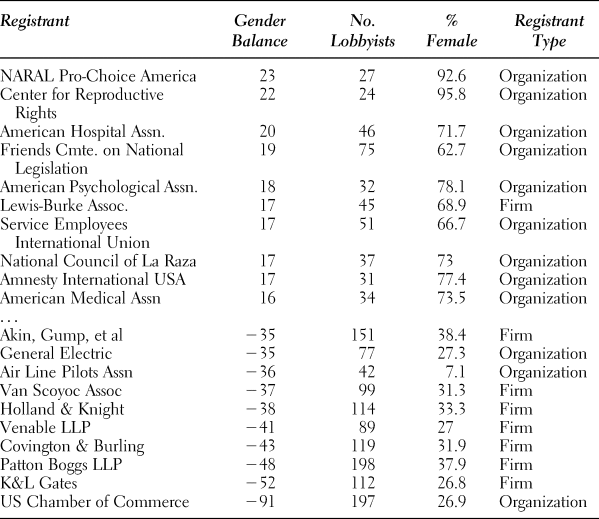
Examination of gender representation across organizations and industries provides a clearer picture of the linkage between gender and representation in lobbying. Table 1 contains information about organizations with the 10 highest and 10 lowest levels of women's representation as an illustration of gender balance disparities. The bottom half of Table 1 shows that 7 of the 10 organizations with the largest negative gender balances (favoring men) are contract lobbying firms; the top half of Table 1 shows that only one in 10 organizations with the largest positive gender balances (in favor of women) is a contract lobbying firm.Footnote 7
Highest and lowest gender balance by organization, 2008–2015
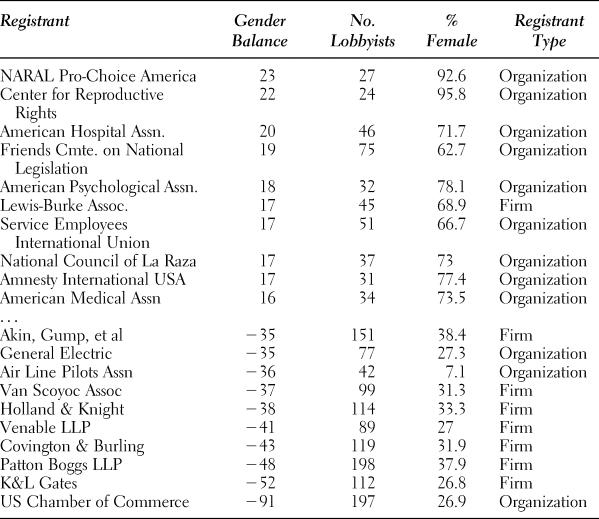
Table 1 also shows that negative gender balances are far greater than positive gender balances. Among the top 10 organizations with negative gender balances, the smallest balance is −35 for both Akin Gump and General Electric, indicating that they each employ 35 more men than women as lobbyists. This is equivalent to the largest positive gender balance in favor of women at + 23 for NARAL Pro-Choice America, which employs 23 more women than men. Among the top 10 organizations in both cases, the average gender balance in favor of men is around −45.6, whereas the average gender balance in favor of women is less than half that at approximately + 18.6. Even when female lobbyists outnumber their male counterparts, men are not as dramatically outnumbered as are women.
A woman working at a large lobbying firm commented on the potential for women to comprise a larger share of the lobbying workforce as the “old boys” network changes in Washington:
I think we're starting to see a paradigm shift there. Some of them [old boys’ network] are close to retiring. Some of the corporate cultures have changed. Particularly with Hillary Clinton running for President, the dynamic has shifted in that women are getting to a place where they're able to be viewed as equal partners. I guess men are recognizing the value that they bring to the table from a conversation standpoint. Their thinking and their thought process for how they assess situations, how they address channels and ultimately how they win for their clients or themselves.
This viewpoint suggests that the lobbying profession will change along with the changing of the guard. If true, it foreshadows an intergenerational, cohort replacement effect in coming years and decades. As the “old boys” of Washington retire and the culture of politics and lobbying changes, there may be more room and appreciation for female lobbyists.
Instead of waiting for long-term cultural changes, some women with whom we spoke chose another strategy: opening their own firms. Our conversations with female lobbyists revealed several cases of women-dominated boutique lobbying firms or lobbying groups where most people in leadership positions within the firm were women. For example, a woman lobbyist who owns her own lobbying group was very explicit with respect to how gender-based inequities motivated her to move from her former position and to start her own firm:
They [owners of previous lobbying firm] came to me and said, “You know, the firm didn't do well this year, and you're going to have a really small bonus. Here's your very small bonus.” I knew what the other junior partner in the firm made, I knew that he got the nice office, and I knew that I brought in about eight times as much money as he did. I decided that wasn't going to be okay. So, I let them know that. That I'm ready for the next challenge in my career; I'd like to start my own firm.
Another lobbyist who works in a woman-owned lobbying firm placed the onus on female lobbyists to take advantage of opportunities to advance within the profession and to take risks if they are not satisfied with their current positions:
I think it's a male-dominated world in regard to ownership of firms. Obviously, there's a lot of heads of offices that are male, but I think that's our problem as women. Are you going after those jobs? Are you starting your own firms? You can't blame the men. Maybe you never thought you could start your own firm.
Despite women's overall underrepresentation in large, contract lobbying firms, these narratives shed some light on the fact that women-run lobbying shops do exist in Washington and highlight the possibilities for female lobbyists moving forward. They may even suggest opportunities for investment in woman-owned lobbying firms in coming years.
A Lobbying Disclosure Breakdown: Sexual Harassment in Lobbyists’ “Workplace”
The lobbying disclosure data offered little insight into women's professional experiences, which led us to uncover an important finding about the lobbying profession from our original interviews. At a minimum, the lack of women in the top tiers of the lobbying profession that we revealed from disclosure reports perpetuates the perception of elite politics as inhospitable to women. At its worst, the lack of female leadership in the lobbying profession may perpetuate the risk of sexual harassment in the unusual overlapping public–private political “workplace.” Women see sexual harassment as more prevalent in male-dominated industries (Catalyst 2018; Pew Research Center 2018), and recent stories in the New York Times, The Hill, and Roll Call detail the harassment female lobbyists face from male colleagues, bosses, and public officials and the lack of resources they have for addressing it.Footnote 8 We were surprised to find that our interviews with female lobbyists supported these accounts, even as our conversations pre-dated the widespread attention to issues of sexual harassment and assault brought about by the #MeToo movement. Furthermore, we did not ask explicit questions about sexual harassment because it was not a central focus of our study and because questions about sensitive or triggering experiences often require more context and privacy than our interviews allowed. Instead, female lobbyists’ accounts of sexual harassment emerged organically from discussions of gender relations in lobbying.
Women's experiences with sexual harassment often stem from the uniquely informal structure of lobbying work. Oversight of harassment is made more difficult given that lobbyists’ “workplace” can span legislators’ offices, evening events where alcohol consumption is the norm, and client “fly-ins” that include overnight stays in hotels. Added to this difficulty is lobbyists’ need to build and maintain relationships, which creates power imbalances between lobbyists and the government actors they work to know. In several of our interviews, female lobbyists mentioned inappropriate behavior from male bosses or government officials and the need to maintain access despite harassment. For example, a young lobbyist with a small, issue-specific lobbying firm discussed her experiences with congressional staffers making contact outside of work:
A small handful [of congressional staffers] would text me inappropriate things. It puts you in a very difficult situation, especially if it's an office that you really need. Fortunately… I've never experienced that with a staffer that was really important to us. But … you can't really say anything because the Hill staff are a club. If you're reporting anything to anyone, that kind of gets around… It's already hard enough to get meetings in certain offices because of time constraints.
This quote demonstrates the clear power imbalances between female lobbyists and the male staffers and politicians on which their jobs depend. This respondent is conflicted regarding sexual harassment by Hill staffers because discussing it could “get around” and affect her ability to gain and maintain access to offices that are important to her work. Although this lobbyist was “fortunate” in that the harassment she faced was not from a crucial office, she felt pressured to keep quiet for fear of retribution from other staffers and legislators.
In another interview, a lobbyist recounted an experience where the senior male partner at a major lobbying firm hosted a meeting for an important client in their Washington office. She described how the partner went around the room introducing the firm's male lobbyists and their expertise. The senior partner then introduced her by remarking that she was there to “make them look good,” ignoring her years of experience in and out of government, advanced degrees, and expertise relevant to the client's policy needs. The respondent implied that this comment was clearly an unwelcome remark about her appearance and that she was uncomfortable speaking out. Furthermore, making such a public claim against a nationally recognized formerly elected official may have ostracized her from partisan politics, which are central to her career. The lobbyist also acknowledged how intersections of age and gender shape her self-presentation and lobbying activities while having little to no effect on the actions of male lobbyists:
If you're a young female in this field, you also have to work that much harder to present yourself as professional. You're getting ahead and being successful based on your brain and not on your body, and who you're seen with and who you're talking with. A man can do the same thing, and no one says anything.
The respondent's unfortunate experience reveals uniquely gendered boundaries female lobbyists must navigate when doing their jobs versus the relative freedom enjoyed by male lobbyists. These issues are far from a “new” problem among lobbyists, as recounted by the owner of another small lobbying firm:
Well, I was—I don't want to say necessarily assaulted, but pretty close to it—by a member of Congress, as a lobbyist… It must have been 1990. I don't have a recent experience; I'm a 51-year-old woman, no one wants to sexually assault me … what I experienced happened more frequently earlier on.
Although this excerpt implies that sexual harassment may have been more common, or at least more overt, in prior years, she emphasized that it undoubtedly occurs today: “I do believe it [sexual harassment] still happens—particularly to younger women.” This observation further illustrates how lobbyists’ experiences with sexual harassment may change over time and that as women become more senior within the field, sexual harassment may become less frequent or less overt. Taken together, these accounts of sexual harassment show how the intersection of gender and age, combined with a lack of female mentors and coworkers, could make early-career female lobbyists particularly vulnerable to sexual harassment. Although our data do not allow us to speak to the frequency of these experiences, the male-dominated and social nature of lobbying likely creates an environment in which gendered power imbalances and the potential for nonconsensual sexual advances are very real.
Implications of a Gendered Lobbying Profession
Three implications stemmed from the results of our quantitative analysis and the deeper narratives about lobbying as a form of political participation from our interviews. The relative dearth of women in the highest paying and most prestigious positions in and out of government carries negative implications for junior women's mentoring and advancement within the lobbying profession. Studies have shown that within-gender mentoring relationships are important to women and can be particularly beneficial in male-dominated fields (Blake-Beard et al. Reference Blake-Beard, Bayne, Crosby and Muller2011; Lockwood Reference Lockwood2006). Furthermore, women who occupy senior leadership positions within organizations serve as accessible role models and can positively affect the leadership aspirations of other women (Hoyt and Simon Reference Hoyt and Simon2011). Women in professional leadership roles also reduce stereotype threat, a “… psychological process where group members experience anxiety in response to stereotypes about a group-based deficiency” (Holman and Schneider Reference Holman and Schneider2018, 268; Steele and Aronson Reference Steele and Aronson1995, 401). Stereotype threats, which disproportionately affect women and other marginalized groups, can lower leadership aspirations and lead to long-term disengagement from fields and possible careers (Davies, Spencer, and Steele Reference Davies, Spencer and Steele2005; Nguyen and Ryan Reference Nguyen and Ryan2008). Women's underrepresentation in the lobbying industry could thus create a feedback cycle in which women dismiss government relations as a possible career and a lack of female role models who could counteract this process persists. Such a reinforcing process would continue to erode women's opportunities to participate in elite politics other than running for office (Lawless and Fox 2005).
The gender disparities we observe in Washington, DC, lobbying profession could also explain documented gendered pay gaps in the industry. A 2016 industry study by Bloomberg Government and Women in Government Relations (WGR) found pervasive pay gaps between male and female lobbyists in Washington, DC. The largest gender pay gap was in lower to middle tiers of seniority in corporate groups and lobbying firms where women earned 68 cents for every dollar earned by men in similar positions. Female lobbyists for corporations and lobbying firms are aware of these differences, with only 26% of them believing that their employer pays men and women equally for the same job. Meanwhile, 73% of male lobbyists at corporations and lobbying firms felt that pay was equal across genders. Gender pay gaps were smallest for lobbyists working in nonprofit organizations, with women making between 88 and 89 cents for every dollar made by male lobbyists, and senior female lobbyists espousing high levels of confidence regarding equal pay. Our findings regarding women's underrepresentation in corporations and lobbying firms, the most lucrative sectors of the lobbying industry, shed additional light on the gendered pay gaps revealed by the WGR study.
Second, our findings of sexual harassment and women's underrepresentation in the lobbying industry also imply that organized interests represented by women may not be equally represented in the policy process. The personal barriers that women face as lobbyists may create political barriers to representation if women face a tradeoff between personal humiliation and professional stigmatization on one hand and altering their advocacy strategies on the other. If women feel compelled to modify their lobbying strategy for reasons other than their clients’ policy objectives, they may unwittingly limit their own influence and success on behalf of their clients. For example, a woman lobbyist might avoid late one-on-one meetings or drinks with male government officials in an effort to present herself as professional, thus limiting the conditions and scope of her influence. Tradeoffs between maintaining access and professionalism are unlikely to affect male lobbyists’ work in the same way, potentially contributing to the gendered differences we have observed in the lobbying industry.
Finally, the government relations industry is governed exclusively by lobbying disclosure laws, which are intended to offer the public transparency into which private interests influence the public policy process. Lobbying relies on maintaining relationships with clients and with those in positions of political authority. Although some of these activities (e.g., contacting public officials) are covered by disclosure requirements, there is no oversight of ongoing relationships. Female lobbyists’ direct accounts of sexual harassment demonstrate how lobbying disclosure laws fail to address sexual discrimination and harassment in the government relations workplace. It is conceivable that sexual harassment may be addressed through legal means or by cutting off relationships with members and staff in Congress, with clients, or with powerful, well connected employers. But doing so may have long-term de facto political consequences that are central to lobbyists’ career maintenance and advancement.
Following career-ending revelations of inappropriate sexual behavior among several politicians, lawmakers adopted new rules in the waning days of the 115th Congress, making members personally liable for settlements with current and former staffers.Footnote 9 These new protections for congressional staffers are intended to bring Congress up to date on basic sexual harassment workplace protections. Members of Congress may no longer hide from scrutiny or use official resources to protect their reelection goals by keeping victims quiet. Lobbyists still have no such protection, whether they experience harassment from supervisors in their own firm, from clients, or from the lawmakers and staff they are expected to interact with professionally.
DISCUSSION
Overall, our findings regarding gendered patterns of work and interest representation within lobbying are consistent with previous work in the subfields of gender and politics and organized interests but offer new empirical nuance and depth. Much like other professions, men are overrepresented in financially lucrative contract lobbying firms, whereas women are more likely to work in the less prestigious and less lucrative positions of in-house lobbyists for a single organization. Although women may work alongside men in the lobbying profession, their work is not necessarily equal in terms of structure and prestige.
We add new insight into the professional and political context of the lobbying work structure that strictly quantitative analyses do not. In many ways, the government relations industry is similar to many other professions in the unequal opportunities for women to participate fully. Like law, medicine, and business, women's opportunity structures to advance their lobbying careers lag behind men's for many familiar reasons: adherence to traditional gender roles, the disproportionate impact of work–life balance for men and women, and the legacy effects of earlier generations of male domination in politics and government relations more broadly.
What distinguishes lobbying from other professions is that it is an explicit form of elite political participation (Burns, Schlozman, and Brady Reference Burns, Schlozman and Verba2001). Our analysis reveals the unique barriers faced by female lobbyists that may not exist in other professions or modes of political engagement. Washington work is informally organized around two separate but related and overlapping spheres: policy and politics. Lobbying work is most closely associated with the policy process: the identification and prioritization of problems, development of solutions, and the building and maintenance of supportive issue advocacy coalitions. Women are more likely today than in previous generations to populate and advance in positions primarily engaged in the policy process, including lobbying and government relations.
On the other hand, political work focusing on campaign consulting, fundraising, and party-building activities, remains predominantly male. Although indirect, this sphere may present a barrier to women's lobbying work because politics necessarily overlaps with policy, especially in today's hypercompetitive and polarized party atmosphere. Our interview evidence suggests that men are much more likely to succeed because their positions afford them more opportunities to be active in both spheres, whereas women may be more likely to be structurally confined to the policy sphere alone. Taken together, the evidence we have presented here suggests that the lobbying profession maintains distinct barriers to women's career advancement and full participation in the polity. Furthermore, our findings raise the possibility of gender inequality in the substance of women's and men's policy advocacy and in their influence behaviors. Female lobbyists may self-select or be confined to disproportionately representing stereotypic “women's issues,” potentially restricting women's elite participation to explicitly gendered policy areas. Thus, the unequal distribution of lobbyists’ work structure may exacerbate women's underrepresentation in the halls of government.
Likewise, the gendered patterns of employment we document here may have implications for how effective lobbyists are on behalf of the interests they represent. Because women legislators secure more funding for their constituencies (Anzia and Berry Reference Anzia and Berry2011) and are more legislatively effective overall when they are in the minority (Volden, Wiseman, and Wittmer Reference Volden, Wiseman and Wittmer2013), it stands to reason that female lobbyists may be more effective advocates on behalf of the interests they represent. Taken further, our results and the extant literature raise questions about direct lobbying contacts between male and female lobbyists and male and female policy makers, as well as consequences they may have for influencing policy priorities and outcomes. Future work may build on our results by linking gender and lobbying disclosure data, which unfortunately offer no real information on policy outcomes per se, with some measure of policy outcomes on an issue by issue basis (Baumgartner et al. Reference Baumgartner, Berry, Hojnacki, Kimball and Leech2009).
Ultimately, significant political moments like the first major party nomination of a female presidential candidate, the salience of sexual harassment and assault issues following from Justice Kavanaugh's nomination proceedings in 2018, the record number of women candidates for Congress in 2018, and the #MeToo movement more generally, may open new opportunities to pressure major organized interests to address the profession's gender inequalities and recruit more inclusive and descriptively representative lobbying rosters. Barring these changes, the heavenly chorus of Washington lobbying will continue to sing with an upper-class accent and distinctly male tone.
SUPPLEMENTARY MATERIAL
To view supplementary material for this article, please visit https://doi.org/10.1017/S1743923X19000229.