Introduction
Precision agriculture is implemented using available information about crops in order to make an efficient and rationale use of water and nutrients. It implies the determination of the fertilizer, the timing and the doses are properly distributed in the plot. This information must be coherent to speed up the tools and machinery used in field for the application of the fertilizers. The content of Nitrogen in the Canopy (N, grams of N/grams of biomass) is an important diagnostic indicator and its estimation is a key parameter in precision agriculture (Justes et al., 1994). So, the Nitrogen Nutrition Index is defined as the ratio between the actual nitrogen content (N) and the canopy optimum N content N up-c , NNI=N/N up-c . Deviations of NNI values from the value around 1 would indicate no proper N management (Lemayre, Reference Lemaire, Plénet and Grindlay1997).
Remote sensing techniques can provide the N content in the crop by different approaches, but the simplest and most operational way is using different combinations of spectral reflectance bands known as vegetation indices (Clevers et al., Reference Clevers and Gitelson2013; Gitelson, et al., Reference Gitelson, Vina, Ciganda, Rundquist and Arkebauer2005; He et al., Reference He, Song, Feng, Guo, Zhang, Wang, Wang and Guo2016). The red edge spectral band (700±40 nm) is a transition region with a rapid change in leaf reflectance caused by the strong pigments absorption in the red, and leaf scattering in the NIR spectrum. The behaviour of the reflectance in this region of the spectrum has been proved sensitive to crop canopy chlorophyll and consequently to N status (Hatfield et al., Reference Hatfield, Gitelson, Schepers and Walthall2008). Due to this crop spectral behaviour of the red, red-edge and near infra-red region, different sensors have been designed to acquire reflectance at different spatial, spectral and temporal resolutions in order to estimate the Chlorophyll and N content in crops. These sensors cover a range from field observations at high spectral resolution with handheld radiometers, to recently launched multispectral medium resolution Sentinel-2, passing through very high resolution proximal remote sensing cameras (Parrot Sequia®) and satellites (Rapideye® and Worldview-2®). The most used models to map crop N content from these sensors are the red edge-based indices that are based on reflectance band combinations. There are many of these indices published in the bibliography as they tackle different objectives and overcome different problems, such as saturation with high crop density, colour and brightness variations in soil background, linear behaviour with N content, or angular view and illumination variation. Based on high impact publications, according to their suitability for the pilot areas and crops in the field campaigns, the red edge indices that provide better results in determining the N in crops has been selected for this work. Added to this selection, we focus on their performance and adaptation to sensor characteristics.
According to this strategy, when applied to remote sensing data, the users will have access to N diagnosis maps that can be comparable from different sensors and coherent to speed up the tools and machinery for precision agriculture.
Most of the indices based on red radiation lose their sensitivity under high aboveground biomass conditions. The commonly used normalized difference vegetation index (NDVI) becomes saturated at moderate to high canopy coverage conditions. It has been proved that for wheat NDVI losses its sensitivity when aboveground biomass of winter wheat is higher than 3.7 t·ha−1 (Li et al., 2010). In the case of corn the red-based vegetation indices lost their sensitivity at the V10-VT growth stages under moderate to high aboveground biomass and high N rate conditions (Shaver et al., Reference Shaver, Khosla and Westfall2010).
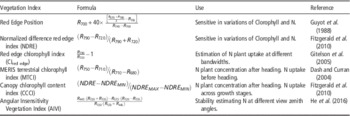
Thus, previous experiments showed that the named normalized difference red edge index (NDRE) (Fitzgerald et al., 2006) that is defined in the form of the NDVI but with the red band replaced by an red edge band, was a reliable indicator of chlorophyll or N status. The red edge chlorophyll index (Cl RE ), was designed to predict chlorophyll content of maize and soybean, and also with sensitivity to N content (Li et al., Reference Li, Miao, Feng, Yuan, Yue, Gao, Liu, Liu, Ustin and Chen2014). The canopy chlorophyll content index (CCCI) is based on the theory of two-dimensional planar domain and it uses the red edge band, which has been proposed as a superior method to estimate N-related indicators for cotton, wheat and broccoli (Fitzgerald, 2010). It has been applied to corn showing promising results for estimating summer maize plant N concentration and uptake at the V6 and V7 and V10-V12 stages (Li et al., Reference Li, Miao, Feng, Yuan, Yue, Gao, Liu, Liu, Ustin and Chen2014). Another important factor for the N determination in crops by remote sensing techniques are the angular variation on the illumination and observation. This effect is due to the vertical gradient in leaf N distribution in a plant canopy, with the lower shaded leaves generally having lower N content than the upper illuminated leaves, leading to variation in canopy structure, which has a significant impact on directional performance of Vegetation Indices. Thus, in order to improve the predictive accuracy of N content and the angular stability, He et al. (Reference He, Song, Feng, Guo, Zhang, Wang, Wang and Guo2016) have recently defined the Angular Insensitivity Vegetation Index (AIVI). This index shows high correlations (R2 over 0.9) with N content in wheat, for a range of high spectral resolution reflectance measurements zenith angles (±40°) referred to the nadir. As can be seen, those indices have been defined to be sensitive to the cover amount and N content but normalizing other effects such as soil brightness and colour variation, avoiding saturation effects or improving angular stability. All of these indices are defined in Table 1.
Definitions of the Red-Edge vegetation indices applied. The table includes some indications about their use.

The objective of this work is to study the empirical relationships between the red-edge based vegetation indices to supply the models for monitoring crop N status and their accuracy applied to commercial plots.
Materials and Methods
Site description
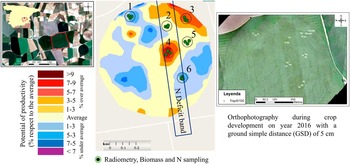
The work has been carried out on a commercial irrigated plot of bread wheat (coordinates 39.25° N, 1.99° W) during 2016 with an extent of 41 ha. The crop has been monitored along all the growing cycle, from January to July. It is located in the South-East of Spain in the province of Albacete (Figure 1). The climate is Mediterranean with an annual precipitation of 353 mm and an average temperature of 14.3°C over the last 30 years. Precipitation occurs during autumn and spring. The wheat varity is Califa and the water is applied by a central pivot system. The management of the plot is done by direct seeding and the soil has not been plowed during the last 10 years. The mean soil depth in the area is about 50 cm.
Commercial plot used for trials location in the South-East of Spain (left). The figure in the center shows the sampling points and the potential of productivity map calculated from cumulated transpiration from remote sensing during the last years. This variability was taken into account for the sampling location and N variable rate supply. An orthophotography of the plot is shown on the right, where can be identified the N deficit band.

The irrigation period was from February to June with a frequency of five days. Each irrigation is about 10 mm with a total of 453 mm during the growing cycle. The fertilization practice comprises of 6 applications of NPK. There were 2 applications after sowing. The third nutrient application was solid urea during the three leaf stage. And the last three applications were done using the irrigation system (ferti-irrigation) distributed between earing and flowering in order to increase the protein content. The nitrogen doses in the last application were applied in a band of 100 m width (Figure 1).
Sampling method
The points for the biomass and radiometry sampling have been selected in order to study three areas with lower fertilization supply (148 kg/ha) and the other three sampling points in the area with traditional farmer nitrogen supply (192 kg/ha). Prior to that, the spatial variability in the production of the plot during the last years has been studied in order to set an experiment which covers the different ranges of yield (Figure 1).
The six points were composed of three repetitions, in each repetition six reflectance spectra were acquired. Thus, the representative spectral reflectance for each point is the average of eighteen measurements. The spectral measurement were done prior to the biomass sampling using the optical fiber (23° Instantaneous Field of View), and observing the cover at nadir with a constant height of 1.7 m. The instrument used for the reflectance measurements were an ASD® FieldSpec 3 Hi-Res (ref. number 16206). Each sub-sample consisted on harvesting the whole aerial biomass within two crop lines along 1.5 m (covering a sampling area of 0.54 m2). All samples were dried during 48 h at 60°C to determine the dry biomass and they were analyzed in the laboratory to obtain the total nitrogen.
Results
Biomass and N content
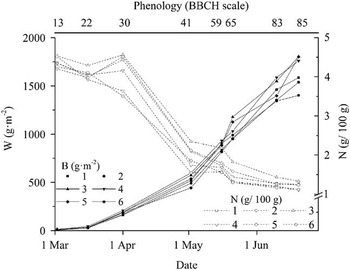
The biomass shows the increasing tendency along the growing cycle reaching to a value of 17 t·ha−1 in points 3, 4, and 5 (Figure 2). In all the cases this variable describes a sigmoidal shape with an important variability between the different sampling points, and thus the potential productivity areas. The differences between them at the end of the cycle ranges from 13 to 17 t·ha−1. The minimum is reached in point 2 due to the deficit in the N supply during flowering (BBCH 59-65) in a medium-low potential area. N content ranges from 4.5 g per 100 g of biomass at the beginning to 1 g/100 g at the end. Point 2 shows the lowest concentration along the cycle, indicating the poorest potential productivity within the low band N supply. The maximum variability in the N content was found during the maximum slope of biomass accumulation.
Time evolution of the points in the plot showing the biomass (W) (filled points) and the N (g/100 g). The Phenology in the BBCH scale is shown in the top horizontal axis.

Indices
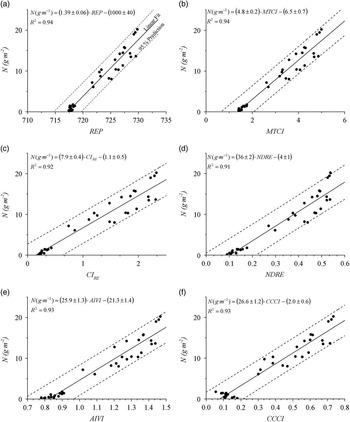
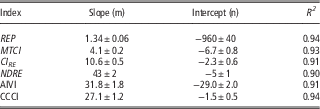
The selected indices show a linear tendency in all cases with respect to the total N content (g·m−2) considering the period from emergence to flowering (from BBCH 0 to 65). This criteria is coherent with the range of application of the curve for the determination of N c and N up-c .The REP and the MTCI show the highest R 2 with a value of 0.94 and an error in the slope of 4% (Figure 3). In all cases there is a good agreement with low scattering in the initial values, when the accuracy of the remote sensing data is the lowest. Those indices are sensitive to an increase in N uptake from BBCH 22. Those correlations became worse when passing from the narrow band of the radiometer with less than 2 nm bandwidth to 20 nm that is the case of Sentinel-2 (Table 2). In this case the unique index that improves the correlation is the CCCI with a R 2 =0.94. This seems to be more stable than the others with increasing the band width.
Linear fit of the selected indices versus N content (g·m−2). It is shown at the 95% confidence prediction level.

Linear fit of the red-edge indices applied to the spectral reflectance measurements to broad bands of Sentinel-2.

Conclusions
The selected red-edge vegetation indices can be implemented to feed the models for monitoring the crop N status. The direct way is to provide the N content, which can be seen in this experiment and can be estimated in an operational way. All the studied indices can be applied to remote sensing data (satellite and aerial platforms) in order to provide large scale maps of N content. The empirical method shown in this paper should be validated along time and space, introducing experiments in other areas and checking the stability of these relationships along time in the plots studied.
Acknowledgements
This research was developed in the framework of the project FATIMA (FArming Tools for external nutrient Inputs and water MAnagement), funded by the European Union’s Horizon 2020 research and innovation program (Grant Agreement N° 633945). Part of the research was supported by the project HERMANA (HERramienta para el Manejo de fertilización Nitrogenada y Agua sostenible) funded by the Spanish Ministry of Economy and Competitiveness (AGL2015-68700-R).
Special thanks to the great job done in the field and laboratory by Maria Calera, Nuria Jimenez, Jaime Campoy, Carmen Plaza, Elena Pareja, Francisco Miguel Jara, Pablo Avilés, Iñaki Narro, Belén Quirós and Hermógenes Alcaraz. Thanks also to Agustín González, the owner of the commercial plot used for trials, for his patience with the fieldwork.