Implications
This experiment determines the pasture management of a commercial pasture-based automatic milking system (AMS) with consistently high robot utilisation (RU) throughout 24 h. This information is an indicator of the segregated nature of milking times between cows in a pasture-based automatic milking herd. Using this knowledge, feeding management could be tailored to meet individual cow requirements, based on their entry time to the pasture allocation, providing potential to increase milk yield (MY). Farmers with pasture-based AMS can consider the pasture management principles identified within this paper and apply this knowledge to their own enterprises.
Introduction
The first AMS installed in Australia occurred in 2001 (Greenall et al., Reference Greenall, Warren, Warren, Meijering, Hogeveen and de Koning2004) and adoption has since expanded to 42 farms in 2017 and is present in all the major dairy regions of Australia, with the majority of Australian AMS farms using grazed pasture as the primary feed source. To maximise RU, AMS require a consistent flow of cows presenting to the milking robot, with cows trafficking freely between the pasture allocation and dairy, under the guidance of selection gates. However, a reduction in the number of milking events often occurs between 2400 and 0600 h in pasture-based AMS (John et al., Reference John, Clark, Freeman, Kerrisk, Garcia and Halachmi2016). This reduction in milking RU is attributed to cows following diurnal grazing patterns, with the decline in RU more pronounced in pasture-based AMS due to minimal grazing occurring at night, compared to indoor AMS where feeding is more evenly distributed throughout 24 hours (John et al., Reference John, Clark, Freeman, Kerrisk, Garcia and Halachmi2016).
Feed is the main incentive to encourage cows to move around the farm, allowing milk harvesting in the process (Prescott et al., Reference Prescott, Mottram and Webster1998). Thus, optimising pasture management is critical to the operation of pasture-based AMS. A system of ‘three-way grazing’ (3WG) is commonly used, whereby three pasture allocations are offered within a 24-h period, to encourage cows to voluntarily traffic (Greenall et al., Reference Greenall, Warren, Warren, Meijering, Hogeveen and de Koning2004). The 3WG system has been adopted by the majority of pasture-based AMS farms in Australia, and as Lyons et al. (Reference Lyons, Kerrisk and Garcia2013) demonstrated, the additional voluntary cow trafficking increased milking frequency (MF) (1.8 v. 1.3 milkings per day) and MY (23.2 v. 19.3 kg per day), compared to offering only two pasture allocations in 24 h. The increase in voluntary cow movement using 3WG is attributed to smaller quantities of feed available at each pasture allocation, resulting in pasture being depleted more rapidly and encouraging cows to seek a new food source (Lyons et al., Reference Lyons, Kerrisk and Garcia2013). Despite 3WG being the accepted standard, there has been no research on how to manage and optimise voluntary cow trafficking using 3WG in pasture-based AMS.
There is a paucity of 24 h RU data for both pasture-based and indoor AMS, with research focusing mainly on individual cow MF and MY (Halachmi et al., Reference Halachmi, Ofir and Miron2005; Lyons et al., Reference Lyons, Kerrisk and Garcia2013 and Reference Lyons, Kerrisk and Garcia2014). Although these two metrics are important, optimising RU provides an opportunity to increase total milk harvested per robot by increasing the number of milkings performed in 24 h and the number of cows a robot can support (John et al., Reference John, Freeman, Kerrisk and Clark2015). Ideally, cows would present for milking at a consistent rate throughout 24 h, with minimal time spent in the waiting yard. However, the more synchronised feeding and trafficking behaviour of pasture-based dairy herds, compared to indoor dairy herds, creates an additional challenge (Ketelaar-de Lauwere et al., Reference Ketelaar-de Lauwere, Ipema, van Ouwerkerk, Hendriks, Metz, Noordhuizen and Schouten1999). Studies have also suggested RU is influenced by social rank, with low ranked cows more likely to present for milking between 2400 and 0600 h, when there is less competition to access the robots (Ketelaar-de Lauwere et al., Reference Ketelaar-de Lauwere, Devir and Metz1996; Jago et al., Reference Jago, Jackson and Woolford2003). Almeida et al. (Reference Almeida, Cerqueira, Lopes, Silvestre, Araújo and Silva2013) investigated milking order in an AMS, with the herd divided into three groups, determined by individual MY. In their study, MF was greater for the high MY group, however, all three MY groups followed a similar RU pattern throughout 24 h. Knowing the milking order in AMS allows the tailoring of concentrate feed offered to individual cows, that compensates for any deficiencies in pasture quality they are likely to receive in the pasture allocation, as outlined for conventional milking systems (CMS) by Scott et al. (Reference Scott, Camacho, Golder, Molfino, Kerrisk, Lean, Garcia, Chaves, Hall and Clark2014). Our objective was to determine the RU patterns throughout 24 h for cows with different levels of MF in a commercial pasture-based AMS utilising 3WG and highlight factors that influence the RU observed.
Material and methods
The experiment duration was 56 days from 7 January to 3 March 2013 at Togari (40°58'17''S, 144°54'38''E), Tasmania using 207 cows (Bos taurus) in a single herd. The weather was mostly dry for the duration of the experiment, with 16 days of rain recorded. The light and dark cycle was ~13 h and 11 h with sunrise and sunset occurring at 0600 and 1900h, respectively.
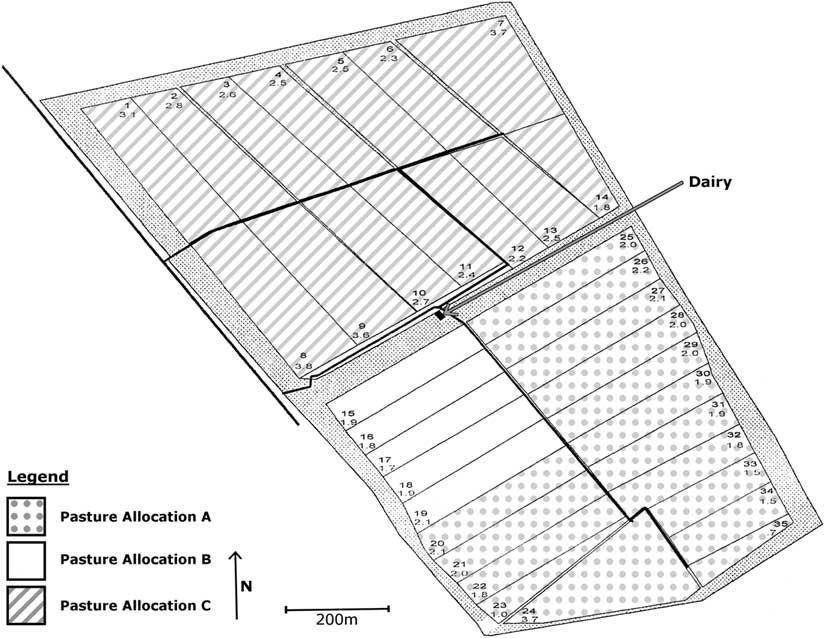
Cows were milked with three Lely Astronaut A3 robots using 3WG on 79 ha of perennial ryegrass/white clover pasture (Figure 1). Grain-based concentrate was offered in the milking robots and pasture silage (dry matter (DM)=39.7%, NDF=58.5%, ADF=31.2%, CP=11.2%, DM digestibility=62.6%, metabolisable energy=8.6 MJ/kg on DM basis) supplemented in the pasture allocations. Only cows that were present for the entire 56 days were included in the data analysis, resulting in 186 cows being analysed. The herd consisted primarily of Friesian – Jersey cross-bred cows.
Layout of the farm studied. A herd of 207 cows (Bos taurus) were milked by three Lely Astronaut A3 robots located at the centralised dairy, milking and surrounded by 79 ha of grazed pasture split into three separate pasture allocations (A, B and C).

Pasture management data
Pasture data were collected every Monday, Wednesday and Friday for all pasture allocations. Pre-grazing (before cows enter the pasture allocation) and post-grazing (after the last cow had exited the pasture allocation) compressed biomass was measured using a Rising Plate Meter (360 mm diameter, 315 g plate weight) fitted with an electronic counter (Farmworks, Palmerston North, New Zealand). Between 80 and 100 individual pasture height readings were taken across multiple transects (zig-zag pattern) in each pasture allocation, avoiding areas of high cow traffic. The pre- and post-grazing compressed pasture heights were converted to pasture biomass using the formula:
 $$biomass\,\left( {kg\,DM\,per\,ha} \right){\equals}height{\rm }\left( {cm} \right){\rm }\,x\,{\rm }240{\plus}500$$
(Earle Reference Earle and McGowan1979).
The area (ha) of each allocation was recorded using a handheld global positioning system and a target post-grazing biomass of 1500 kg DM per ha was used to calculate the pasture allocated per cow in each individual allocation:
 $$\eqalign{Pasture \,\, allocated\,\,\left( {kg\,DM\,per\,cow} \right)\hskip 3pc\cr{\equals}\left[ \matrix{ pre\,{\minus}\,grazing\,\,biomass\,\left( {kg\,DM\,per\,ha} \right){\minus} \cr target\,\,post\, {\rm }grazing\,\,biomass\, \hfill \cr \left( {kg\,\,DM\,\,per\,\,ha} \right) \hfill \cr} \right] \cr \,x\,\,area\,\,\left( {ha} \right)\,{\div}\,herd\,\,size\hskip 3pc$$
The post-grazing biomass was used to determine the average pasture consumed per cow and was calculated:
 $${Pasture\,\,consumed\,\left( {kg\,\,DM\,\,per\,\,cow} \right)$$
 $$\eqalign {&{{\equals}\left[ {pre{\minus}grazing\,\,biomass\,\,\left( {kg\,\,DM\,\,per\,\,ha} \right) {\minus}}\right.} \cr &\quad{\left.post\,\,grazing}\,\,{biomass\,\left( {kg\,\,DM\,\,per\,\,ha} \right)} \right]\,$$
 $$x\,area\,\left( {ha} \right)\,{\div}\,herd\,\,size}$$
The quantity of silage consumed in each allocation was added to the calculated pasture intake to determine the total feed consumed per allocation. To determine the quantity of silage offered, the average mass per bale was multiplied by the number of silage bales fed in each allocation. The average mass per silage bale was determined by weighing the silage bales pre-feeding, to obtain an average wet mass (±SD) per bale of 765±44 kg. The average wet weight was then converted to DM based on the average (±SD) DM percentage of 39.7±8%, calculated from silage samples collected weekly throughout the experiment, resulting in an average mass of 304 kg DM per silage bale.
Milking data
Customised reports were formulated within the Lely milking management system ‘Time for Cows (T4C)’ to collect animal and milking event data. The data collected for each individual animal included: daily MY (l per day), MF (milking events per day), total grain-based concentrate consumed (kg per day), day of lactation (days) and live weight (kg). The cow’s I.D., time, date and MY (l) of each milking event was recorded to determine RU patterns. The ‘proportion of nights milked’ was determined for each cow by counting the number of days with a milking event occurring between 2400 and 0600 h.
Statistical analysis
For analysis, the dairy herd was categorised into three equal sized groups (n=62 per group) according to the cow’s mean daily MF over the duration of the study. The mean MF for each MF group was 2.9 (high), 2.5 (medium) and 2.1 (low). The data were analysed using GenStat 16th Edition, with significant effects stated at P<0.05. Herd RU was analysed for all 186 cows using a generalised linear mixed model to determine the fixed effect of hour (0=2400 to 0100h, 1=0100 to 0200h … 23=2300 to 2400 h) on the number of milking events (1=milking event; 0=no milking event), with cow (1, 2 … 186) and day (1, 2 … 56) included as random factors. Milking frequency group (low, medium and high) was added to the model to determine RU by MF group. The same model was used to determine the number of milking events between 2400 and 0600 h (1=milking event; 0=no milking event) for each MF group. The effect of MF group (low, medium and high) and pasture allocation (A, B, C) was used to determine the proportion of days (n=56) with a milking event occurring ‘early’ (first third of allocation time), ‘mid’ (second third of allocation time) and ‘late’ (last third of allocation time) within each pasture allocation. The early, mid and late period occurred between 0930 to 1210h, 1210 to 1450h and 1450 to 1730 h for pasture allocation A, 1730 to 2030h, 2030 to 2330h and 2330 to 0230 h for pasture allocation B and 0230 to 0450h, 0450 to 0710h and 0710 to 0930 h for pasture allocation C.
The mean predicted MY and concentrate consumption were determined for each MF group (low, medium and high) using restricted maximum likelihood (REML) variance components analysis, with cow (1, 2 … 186) and day (1, 2 … 56) included as random factors. Stage of lactation (SOL) was determined using the same model, with only the SOL of each animal on the 1st day of the experiment included and day excluded from the random effects. The effect of pasture allocation (A,B,C) on feed offered and feed consumed was analysed using REML variance components analysis, including day (1, 2 … 56) as a random effect.
Results
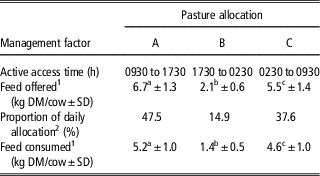
Pasture management consisted of three allocations of pasture, split unevenly throughout the day in terms of both duration and quantity of feed offered (Table 1). The largest quantity of feed (pasture and silage) was offered in pasture allocation A (P<0.001), followed by pasture allocation C and pasture allocation B. The quantity of feed (pasture and silage) consumed varied (P<0.001) between the three allocations following the same trend as feed offered.
Active access time, feed offered, proportion of daily feed allocation and feed consumed for each pasture allocation (A, B and C) under the three-way grazing management

DM=dry matter.
Active access time=Period of the day cows (Bos taurus) are sent to the designated allocation.
a,b,c Values within row with different superscripts differ significantly at P<0.05.
1 Includes pasture and silage.
2 Calculated from feed offered.
3 Refer to Figure 1 for pasture allocations A, B and C.
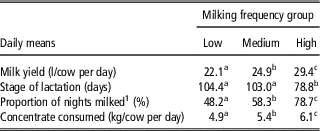
Milk yield and concentrate consumed increased (P<0.001) across the three groups from low to high, as did the proportion of nights with a milking occurring between 2400 and 0600 h (P<0.001) (Table 2). The SOL (P<0.05) was greater for low and medium MF cows compared to high MF cows.
Effect of milking frequency group (high, medium and low) on milk yield, stage of lactation, proportion of nights milked and concentrate consumption of cows (Bos taurus) in a pasture-based automatic milking system

a,b,c Values within row with different superscripts differ significantly at P<0.05.
1 Proportion of days with a milking between 2400 and 0600 h.
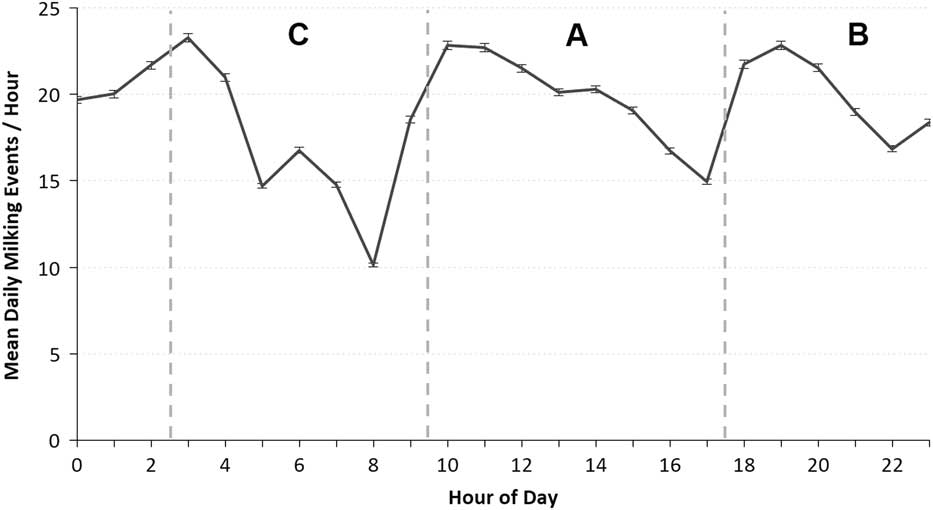
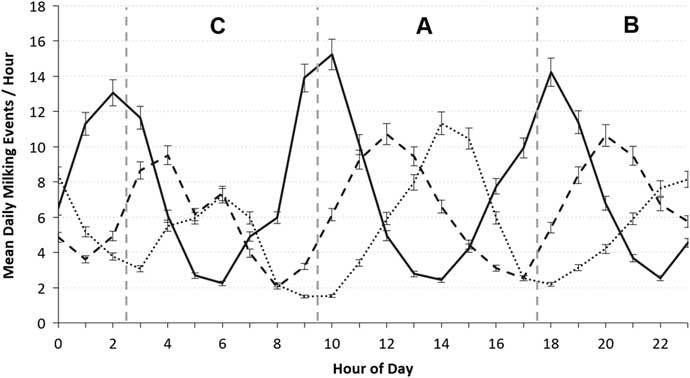
Robot utilisation for the whole herd was relatively uniform throughout 24 h, with larger decreases in RU (P<0.001) at 0500h, 0700 to 0800h and 1700 h (Figure 2). With the herd split into the three MF groups it is possible to observe the peak milking times for each group (Figure 3), with an interaction (P<0.001) occurring between MF group and time. Except for the low MF group at 0600 h, the peak milking time for each pasture allocation was unique for all groups. The RU patterns of all three MF groups followed a series of three peak milking times, separated by ~8 h.
Mean daily milking events per hour for the entire herd (Bos taurus). Error bars represent SE. Refer to Figure 1 for pasture allocations A, B and C.

Mean daily milking events per hour for cows in the (Bos taurus) high ( ), medium (
 ) and low (
 ) milking frequency groups. Dashed vertical lines denote gate change times. Error bars represent SE. Refer to Figure 1 for pasture allocations A, B and C.

For the high MF cows, the early period had the greatest proportion of days with a milking event (P<0.001) for all three pasture allocations. Medium MF cows had the greatest proportion of days with a milking event coinciding with the mid-period of pasture allocation A and B, with a significant (P<0.001) decrease in the proportion of days with a milking event during the mid-period in pasture allocation C. Low MF cows tended to milk in the mid to late period during pasture allocation A and B, with a significant (P<0.001) decrease in the proportion of days with a milking event during the mid and late period in pasture allocation C.
Discussion
Attaining a constant flow of cows through the robots, whilst spending minimal time waiting in the pre-milking yard, is imperative for efficient RU in AMS. With the exception of decreases in RU at 0500h, 0700 to 0800h and 1700 h, a relatively consistent level of RU was achieved throughout 24 h (Figure 2). The drops in RU at 0500 and 1700 h coincided with cleaning of the robot’s milk lines, and at 0700 to 0800 h, when factory tanker collection of milk occurred, in both situations, cows could not access the robots whilst these tasks took place, accounting for the lower number of milking events occurring during these hours. The high level of RU between 2400 and 0600 h are in contrast to RU generally reported for pasture-based AMS in the literature (John et al., Reference John, Clark, Freeman, Kerrisk, Garcia and Halachmi2016) with a low level of RU occurring between 0200 and 0400 h, and anecdotal reports suggesting complete drops in RU during 2400 to 0600 h. We theorise the consistent RU between 2400 and 0600 h was caused by varying the quantity of feed offered in each of the three pasture allocations, with the smaller quantity of feed offered in pasture allocation B likely to account for the increased traffic between 2400 and 0600 h, due to feed being rapidly depleted. This method of ‘variable allocation’ represents an evolution of the 3WG method previously shown in the study by Lyons et al. (Reference Lyons, Kerrisk and Garcia2013). However, without a control group receiving a consistent quantity of feed throughout 24 h, it is not possible to determine if the variable allocation of feed offered throughout 24 h is the main factor influencing RU in this study. Though, this data does highlight an interesting area for future investigation of RU management in pasture-based AMS.
The ability to achieve a consistent RU throughout 24 h does have important implications for farmers. Compared with farms where decreased RU occurs between 2400 and 0600 h, the consistent RU enabled ~25 additional milkings per robot, allowing 69 cows per robot to be supported when milked 2.5 times per day, 35% greater than the average of 51 cows per robot reported by Lyons and Kerrisk (Reference Lyons and Kerrisk2017), who measured the performance of nine pasture-based AMS. Lyons and Kerrisk (Reference Lyons and Kerrisk2017) predict 80 cows per robot could be supported if RU were maximised throughout 24 h, though, we suggest 69 cows per robot, as observed in this study, is a more realistic figure for commercial farms to achieve.
Where grazed pasture has been offered in AMS, cows follow a more synchronised behavioural pattern in terms of eating and resting (Uetake et al., Reference Uetake, Hurnik and Johnson1997), presenting for milking (Winter and Hillerton, Reference Winter and Hillerton1995; Jago et al., Reference Jago, Jackson and Woolford2003) and trafficking to and from the dairy (Ketelaar-de Lauwere et al., Reference Ketelaar-de Lauwere, Ipema, van Ouwerkerk, Hendriks, Metz, Noordhuizen and Schouten1999). This synchronised behaviour typical of AMS offering grazed pasture often results in inconsistent RU throughout 24 h. However, each of the three MF groups in this experiment featured their own distinct RU distributions, leading to, overall, a consistent RU for the whole herd. The use of 3WG on this farm created distinct peak milking times (Figure 3) throughout the day as the cows synchronise their feeding to match the feeding regime used; as demonstrated by Livshin et al. (Reference Livshin, Maltz and Edan1995), where cows adapted to either four times per day or six times per day feeding regimes. The peak milking time for each group occurred at different stages during a pasture allocation (Table 3). The High MF group milked at or around the time of a new pasture allocation becoming available, with the highest proportion of milking events occurring ‘early’ during each pasture allocation, followed by medium and low MF groups with the highest proportion of milkings typically occurring during the ‘mid’ period of each pasture allocation. This is contrary to the study by Almeida et al. (Reference Almeida, Cerqueira, Lopes, Silvestre, Araújo and Silva2013), where cows, grouped by MY, followed the same milking pattern throughout 24 h, with peak milking events occurring at the same time for all three groups. It is clear that the herd in this experiment is no longer synchronised as one unit, with a consistent flow of a small number of cows attending the milking robot throughout 24 h, rather than the whole herd attending the milking robot at the same time. However, it could be said that the herd is still synchronised, but as three sub-herds, based on MF.
Interaction of pasture allocation (A, B and C)Footnote 1 and time within pasture allocation (early, mid and late) on the mean (±SE) percentage of days (n=56) cows (Bos taurus) within each milking frequency group (high, medium and low) had a milking event occur

Early=first third of active access; Mid=middle third of active access; Late=last third of active access.
1 Refer to Figure 1 for pasture allocations A, B and C.
2 Active access to pasture 0930 to 1730 h.
3 Active access to pasture 1730 to 0230 h.
4 Active access to pasture 0230 to 0930 h.
The average SOL was ~25 days less for the high MF group, compared to the medium and low MF groups. Previous studies have shown a reduction in MF and MY as SOL increased, as cows are typically less motivated to traffic around the system later in lactation (Jago et al., Reference Jago, Davis and Woolford2006). However, the SOL cannot explain the difference in MF and RU patterns between the medium and low MF groups. Further work is required to determine the other factors linking groups of cows together in AMS where the presence of sub-herds occurs. Social rank is one possible explanation for cows attending the milking robot at different periods throughout a feed allocation. With the high MF cows gaining access to each pasture allocation first, a natural hierarchy based on social rank could be forming within the herd, with high MF cows exhibiting a higher social ranking than the medium and low MF cows and therefore commanding an early milking spot within a given pasture allocation. Scott et al. (Reference Scott, Camacho, Golder, Molfino, Kerrisk, Lean, Garcia, Chaves, Hall and Clark2014) found cows followed a consistent milking order within a pasture-based CMS. A similar process could be occurring in this experiment, with Livshin et al. (Reference Livshin, Maltz and Edan1995) observing a defined feeding order, within a herd of 50 cows, where attendance to an automatic concentrate feeder was voluntary.
Social rank has been suggested to influence RU patterns of animals in both indoor (Ketelaar-de Lauwere et al., Reference Ketelaar-de Lauwere, Devir and Metz1996) and pasture-based (Jago et al., Reference Jago, Jackson and Woolford2003) AMS. Jago et al. (Reference Jago, Jackson and Woolford2003) found that lower ranking animals milked more frequently between 2400 and 0600 h, likely due to there being less competition to access the milking robots during that period of the night. However, in our experiment the high MF group also had a greater proportion of days with a milking event occurring between 2400 and 0600 h, compared to the medium and low MF groups. Whether the cows in this experiment were motivated by the ability to access high nutritive value feed early in the pasture allocation period, and if this behaviour is driven by social rank or common to other pasture-based AMS farms, requires further study.
In our experiment, MY increased by 7.3 l between the low and high MF groups and could be attributed to several factors. The difference in MY between the groups could partially be associated with the change in MF between the groups, though the proportional increase in MY is greater than suggested for the increase in MF observed between the groups (Stockdale, Reference Stockdale2006). Conversely, the entry time to the pasture allocation could play a role in this observation, similar to results reported by Scott et al. (Reference Scott, Camacho, Golder, Molfino, Kerrisk, Lean, Garcia, Chaves, Hall and Clark2014) in CMS, where the first cow milked accessed the pasture allocation 2h earlier than the last cow to be milked, resulting in the last cow ingesting pasture with 21% less CP and 15% greater ADF content, compared to the first cow to enter the pasture allocation. In our experiment, the high MF group are likely to have accessed the pasture allocation earlier than the medium and low MF groups, and therefore ingested higher quality pasture compared to cows in the medium and low MF groups. If this were the case, offering a grain-based concentrate of greater protein content to the cows accessing poorer quality pasture could potentially benefit MY (Scott et al., Reference Scott, Camacho, Golder, Molfino, Kerrisk, Lean, Garcia, Chaves, Hall and Clark2014). Another option may be to fetch cows more often, in order to increase MF and MY of the low MF cows. This strategy has the most potential if performed at night, where medium and low MF cows milked less frequently, and could be enabled in the future by new technologies such as unmanned ground vehicles or sound based collars that could automate fetching during the late-night period.
Conclusion
Until now, there have been no studies on herd dynamics in pasture-based AMS. This experiment shows the presence of three distinct groups of cows within a herd, based on their MF levels, with each group having distinct peak milking times throughout the day. Furthermore, all three groups milked during the night, with the high MF group milking most often at night of the three groups. Although social ranking was not studied in this experiment, the lack of milking events between 2400 and 0600 h for the low MF group contradicts other published literature and suggests that social rank has less of a role in milking order at night than previously thought. There are also opportunities to exploit milking order in pasture-based AMS to determine the quality of herbage a cow is likely to receive in each pasture allocation, and this could be used to tailor concentrate rations to individual cow requirements, enabling farmers to compensate for the lower quality herbage cows receive later into a pasture allocation. There is also potential to increase the proportion of milking events between 2400 and 0600 h of medium and low MF cows, which would improve the MF and MY of these cows. This will likely require increased fetching of cows during the night. To enable this, automated fetching technologies should be a focus for cows that fall into this category.
Acknowledgements
The authors would like to acknowledge the support of FutureDairy and its investors (DeLaval, The University of Sydney and Dairy Australia), The University of Tasmania and the farm involved.
Declaration of interest
The authors acknowledge that there are no known conflicts of interest in relation to this publication.
Ethics statement
No procedures required ethics approval for this study.
Software and data repository resources
None of the data were deposited in an official repository.