


INTRODUCTION
Given that the re-introduction of smallpox into any modern population could have profound impacts on public health many countries have developed contingency plans for such an event [1, 2]. For several countries this has included vaccine stockpiling, and the vaccination of key workers, particularly in health care and the military [Reference Casey3, Reference Poland, Grabenstein and Neff4]. Following the detection of smallpox in a population, contingency plans include the rapid isolation of clearly symptomatic cases and the tracing, vaccination and observation of the contacts of those cases. Supplementary to these interventions authorities may also decide to pre-emptively vaccinate some larger part of the population. Vaccination strategies for smallpox, however, are not straightforward, since most vaccines stockpiled are based on those developed during the earlier eradication programme and carry relatively high rates of adverse events, including fatality [Reference Kemper, Davis and Freed5, Reference Lane and Goldstein6]. Depending on the vaccine, estimates of vaccine-related fatality vary. For the Lister–Elstree vaccine used in much of Europe, fatality rates have been reported to be ∼3–10 per million primary vaccinees [Reference Conybeare7–Reference Kretzschmar11] (lower in secondary vaccinees) and for the US New York Board of Health vaccine ∼1–2 per million primary vaccinees [Reference Kretzschmar11–Reference Lane13]. Higher vaccine fatality rates than these have been reported from more localized outbreak controls [Reference Kerrod14]. Based on contemporary studies of volunteer vaccinees in the United States [Reference Casey3], others [Reference Riley and Ferguson15] have suggested higher vaccine fatality rates should be applied, although the justification for this would require a high degree of conservatism, since the number of deaths (due to myocardial infarction) observed were no more than might be expected from a matched unvaccinated cohort [Reference Poland, Grabenstein and Neff4, 16].
It is notable, however, in a number of the outbreaks documented from the past that more targeted approaches were occasionally supplemented by wider vaccination [Reference Fenner17, Reference Ström and Zetterberg18]. This was usually targeted to the geographic area around the outbreak, and rarely expanded to include the whole country. We have commented previously on this expanding vaccination effort through reference to outbreak control in Edinburgh in 1902–1903 and Liverpool in 1942 [Reference Kerrod14]. A number of contemporary contingency plans also make reference to the potential for switching from more targeted approaches to wider vaccination [1, 2]. This point is raised elsewhere [Reference Kretzschmar19] with relation to developing criteria for switching between smallpox control options. The possibility of geographically widening vaccination efforts around cases has also been addressed very recently in an individual-based micro-simulation model [Reference Riley and Ferguson15]. The results showed that expanding vaccination efforts to include an area around each case that was of the order of 15 km radius was likely to result in a number of vaccine-related deaths (and other complications) greater than the number of deaths prevented, especially when assuming the higher adverse events rates that have been extrapolated from the recent US study [Reference Casey3].
We, however, posed the question whether a similar strategy targeted to populations living within administrative districts that have cases would provide an advantage over an approach based purely around targeting contacts of cases. Further, we posed the question of what might be meaningful triggers for a change between approaches, to include either district or nationwide mass vaccination. To address these questions we implemented a stochastic metapopulation framework [Reference Keeling, Bjornstad, Grenfell, Hanski and Gaggiotti20] for Great Britain, in order to be able to model such controls. This has been built and parameterized in a way that is analogous with published models, with the spread of infection between districts given by known measures of population movement, which varies with geographic location. We incorporate public health controls in line with published contingency plans [1, 2] such as case reporting, finding and isolation, and contact tracing, vaccination and observation. In addition, the model also has a trigger set so that once the number of cases reaches some threshold level in any district then all of those individuals without contraindications living in that district can be pre-emptively vaccinated. The model has been run for a wide range of scenarios to determine the potential relative benefit of different values of this trigger, with extensive sensitivity analysis to take account of uncertainty regarding potential parameter assignments. For the purposes of this study we compare only deaths due to smallpox and those due to vaccination (it is recognized that this does not account for all adverse events).
METHODS
Model formulation
Here we discuss the stochastic metapopulation model [Reference Keeling, Bjornstad, Grenfell, Hanski and Gaggiotti20] consisting of the 459 districts of Great Britain in 1991 (see Appendix for an explicit mathematical description). The connection between districts is given by that year's census travel to work data (www.statistics.gov.uk). This is the best available dataset to parameterize regular national population movements [Reference Riley and Ferguson15] and was varied in sensitivity analysis. For half a day people are assumed to be in their work district and for half a day they are in their home district. The probability of a case leaving a disease state over a half day time step was treated as a binomial event and disease transmission events as Poisson processes. For transmission within districts, our basis is the compartmental model formulated by Gani & Leach [Reference Gani and Leach21] with supplementary disease phases and extra interventions.
The non-infectious latent period of the disease is 12·0 days [Reference Mack22], then for 2·5 days cases have prodromal symptoms and are mildly infectious [Reference Eichner and Dietz23], while for the final 8·6 days cases are symptomatic and highly infectious [Reference Koplan, Azizullah and Foster24]. Thereafter, cases have a 30% probability of death or they recover and are immune [Reference Fenner17]. For our baseline scenario cases infect, on average, five people [Reference Gani and Leach21], (i.e. R 0=5), 10% of which are infected during the prodromal period [Reference Eichner and Dietz23, Reference Fraser25]. We permit R 0 to be doubled briefly until the authorities are aware of an outbreak, since in the past this doubling has frequently been observed, due largely to hospital-acquired infections [Reference Fenner17, Reference Gani and Leach21, Reference Wehrle26]. We also allow for the fact that overtly symptomatic cases are likely to be incapacitated and unlikely to travel. Thus, we assume the movement rate of symptomatic cases between districts is reduced by 90%. Although recent studies suggest that some protective immunity remains in the population from previous vaccination [Reference Hammarlund27, Reference Nishiura, Schwehm and Eichner28], the current level of immunity to infection is uncertain [Reference Gani and Leach21, Reference Bozzette29] and the net effects of residual immunity are difficult to assess [Reference Kretzschmar19]. Given the length of time since the end of the eradication programme immunity to infection has been assumed conservatively to be zero.
Targeted public health interventions
For the purposes of this analysis an unintentional, or covert terrorist, release of smallpox has been assumed (an overt attack would result in the prompter instigation of interventions and an outbreak that would be likely to be more readily contained). Only when a certain number of cases with the symptoms characteristic of smallpox (assumed to be four) have been reported will an alarm be raised. Once this threshold has been reached in Great Britain as a whole, the model triggers baseline interventions. We define these to be the isolation of identified cases and the tracing, vaccination and observation of their contacts. Waiting for a fixed number of symptomatic cases to appear, rather than a fixed period of time after initial infection, allows for the timing of interventions in the model to scale more reasonably with the initial number of cases, which is important for our sensitivity analysis.
For case isolation, each individual that becomes overtly symptomatic is either discovered or self-reports with some probability (0·9) and is put into an isolated state (for longer than the expected infectious period); otherwise they remain infectious in the community [Reference Gani and Leach21]. The isolation of symptomatic cases does not alter their probability of death (0·3), but does prevent further infections. Contacts are explicitly attributed to each case, with a probability of having been infected (0·1) [Reference Gani and Leach21] and a probability of being traced (0·8 in the baseline scenario). Traced contacts are vaccinated and kept under observation for longer than the sum of the expected latent and prodromal periods. Uninfected traced individuals then move either into the vaccinated group with a probability dependent on vaccine efficacy (0·975) [Reference Mack22] or back to the susceptible population. Infected traced individuals also enter the vaccinated group with a probability dependent on a reduced vaccine efficacy for infected cases (0·3) [Reference Fenner17], otherwise they go on to develop the disease but are under observation. In addition, they are isolated on becoming symptomatic and assumed to cause no further infections. Untraced uninfected contacts remain susceptible and mix freely with the rest of the community; while untraced infected contacts develop the disease in the community causing infections until they are isolated as symptomatic cases.
Mass vaccination
Here we consider the mass vaccination of districts in which there was a prerequisite number of symptomatic cases in isolation, defined as Q delay. This parameter has been systematically varied to determine the value of mass vaccination over baseline interventions by potentially reducing the total number of deaths (note that setting Q delay=0 means that nationwide mass vaccination is implemented).
All traced contacts of cases are vaccinated regardless of contraindication because of the greater potential risk from smallpox than from the vaccine. However, for mass vaccination, only a proportion of the population is offered vaccine since those contraindicated could not justifiably be vaccinated in this context and also a number might refuse. Thus, the susceptible population enters one of two states, those that can be vaccinated (assumed to be 70% [2, Reference Kemper, Davis and Freed5]) and those that cannot. If mass vaccination is implemented, those that can be vaccinated are removed from the susceptible population at a constant rate dependent on the time it would take to vaccinate either the whole country (7 days) or individual districts (3 days). These values are broadly consistent with current objectives in published contingency plans [2]. Changing the length of the time required to complete mass vaccination by a few days has negligible effects on the results as long as the time period remains within the order of the generation timescale of the disease. Despite excluding contraindicated individuals from vaccination, adverse reactions, including deaths, are assumed to occur at some rate. Vaccine-induced fatality has been varied around values supported by historical data during the eradication campaign, from one per million as per the US New York Board of Health vaccine [Reference Kretzschmar11–Reference Lane13] to ten per million (the upper end of values reported from the Lister–Elstree strain [Reference Conybeare7–Reference Kretzschmar11]).
Results
Comparison of a nationwide mass vaccination strategy against baseline interventions
Starting with baseline scenario assumptions with ten initial newly latent individuals (index cases), we simulated 1000 smallpox epidemics starting in the City of London implementing baseline interventions alone. Outbreaks varied considerably in both the distribution of total deaths, D ∞ (median 27, range 3–93), assuming a zero vaccine fatality rate and the distribution of outbreak duration, X ∞ (median 151 days, range 67–305), but were generally quite small (Fig. 1).
Histograms of (a) total deaths assuming a zero vaccine fatality rate and (b) outbreak duration (resulting from baseline interventions for outbreaks starting in the City of London with ten index cases).

We simulated a further 1000 smallpox epidemics with the addition of nationwide mass vaccination (Q delay=0). Still assuming a zero vaccine fatality rate we derived the distribution of total deaths, D 0 and the distribution of outbreak duration, X 0. Comparing the two strategies (Fig. 2) we observe from the 5th and 95th percentiles that implementing a nationwide mass vaccination strategy as an adjunct to baseline interventions is likely to save a further 4–22 lives (median 11, 41% reduction in total deaths) and reduce outbreak duration by between 18 and 36 days (median 27). We assume here that comparing percentiles of the distributions corresponds with comparing analogous epidemics.
Distributions of (a) total deaths assuming a zero vaccine fatality rate and (b) outbreak duration [resulting from baseline interventions (thick black line) and nationwide mass vaccination (thin black line) for outbreaks starting in the City of London with ten index cases]. Dotted line, 5th percentile; dashed line, 95th percentile; dotted/dashed line, median.

However, deaths are likely to occur due to the vaccine and so we investigated non-zero vaccine fatality rates. The relative reduction in total deaths by implementing nationwide mass vaccination over baseline interventions alone is given by:

where δv is the vaccine fatality rate per million and p is the percentile. In practice, we are interested in the average behaviour of the system and so consider the median value of each distribution, Λmedian. We also consider the minimum value within the 5th and 95th percentiles, Λminimum, a standardized measure of the worst case relative reduction in deaths that might be expected from each strategy.
Table 1 shows Λminimum and Λmedian with eight initial infection sites (starting districts) chosen to be representative of Great Britain. Four of the starting districts are well connected via commuter movement (City of London, Manchester, Birmingham and Glasgow) and four are less well connected (Cambridge, Salisbury, Worcester and North Cornwall). If the vaccine fatality rate were zero then the total deaths would be expected to decrease by ∼33–41%. As the assumed vaccine fatality rate is increased Λminimum and Λmedian become negative, showing that the addition of nationwide mass vaccination is likely to increase the total deaths. For example, for a smallpox outbreak beginning in the City of London and assuming, conservatively, δv=1, then Λmedian suggests that twice as many deaths will result from implementing nationwide mass vaccination over baseline interventions alone (and could be much worse still with Λminimum and/or higher vaccine fatality rates).
Relative reduction in total deaths by implementing nationwide mass vaccination over baseline interventions alone, Λminimum and Λmedian, assuming various vaccine fatality rates, δv per million, for outbreaks starting in different districtsFootnote †

† Each value is based on 1000 realizations of the corresponding scenario. Outbreaks initiated with ten index cases. Negative values indicate a relative increase in total deaths.
Comparison of district mass vaccination strategies against baseline interventions
For each value of Q delay (the number of cases in isolation in a district before mass vaccination is implemented in that district) between 1 and 10, we simulated 1000 epidemics starting in the City of London to derive a distribution of epidemics arising from the baseline scenario with ten index cases. Generalizing equation (1):

Λminimum and Λmedian are defined as before. Figure 3 shows the advantages of district mass vaccination over baseline interventions by reducing the total deaths in the vast majority of simulations; however, the outbreak duration is decreased by only about half of that achieved with nationwide mass vaccination.
Distributions of (a) total deaths assuming a vaccine fatality rate of one per million and (b) outbreak duration [resulting from baseline interventions (thick black line), nationwide mass vaccination (thin black line) and district mass vaccination with Q delay=1 (dashed line) for outbreaks starting in the City of London with ten index cases].

Examining the effect of changing Q delay (Table 2), we observe that for Q delay>5 district mass vaccination is not always implemented since baseline interventions alone can control the epidemic before Q delay is reached. This is reflected by the row of zeros with Λminimum with Q delay=10. The other values of zero in Table 2 are a result of the fewer smallpox-related deaths balancing the extra vaccine-related deaths that occur when district mass vaccination is implemented. The vaccine fatality rates considered often allow a range of beneficial Q delay values which forces the question of what Q delay maximizes the reduction in total deaths. Table 2 suggests that for the baseline scenario, taking Q delay=3 (Λminimum) or Q delay=2 (Λmedian) would be most beneficial for δv=1.
Relative reduction in total deaths by implementing district mass vaccination with different Qdelay over baseline interventions alone, Λminimum and Λmedian, assuming various vaccine fatality rates, δv per million, for outbreaks starting in the City of LondonFootnote †
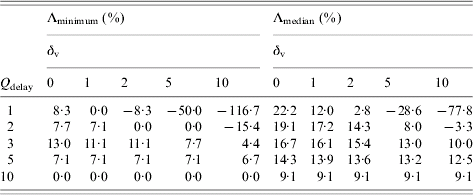
† Each value is based on 1000 realizations of the corresponding scenario. Outbreaks initiated with ten index cases. Negative values indicate a relative increase in total deaths. Q delay is defined as the required number of symptomatic cases in isolation in a district before district mass vaccination is implemented within that district.
We also examined the effect of outbreak origin. Table 3 summarizes the optimal value of Q delay, Q delay*, for each of the starting districts (note that table entries containing more than one value correspond to indistinguishably beneficial strategies). It is important to highlight the blank entries which indicate that for some scenarios mass vaccination with any value of Q delay is not beneficial. This occurs because the increase in vaccine-related deaths outweighs the decrease in smallpox deaths for any strategy that results in mass vaccination. In these cases, which tended to be for the worst case relative reduction in deaths that might be expected (Λminimum) and for outbreaks that started in well-connected districts with the higher assumed vaccine fatality rates, baseline interventions alone are the optimal strategy for controlling an outbreak. It is clear from Table 3 that if the vaccine fatality rate were zero, then nationwide mass vaccination would be the optimal strategy. However, as δv increases and vaccine-related deaths become more significant, there is a trend for Q delay* to increase. Although the impact on smallpox-related deaths is reduced as Q delay increases, on average there will be fewer vaccines administered since fewer districts will reach Q delay. At some point the resulting fall in vaccine-related deaths outweighs the rise in smallpox-related deaths giving the values we see in Table 3. For most low values regarding the vaccine fatality rate (δv=1, 2) in the scenarios considered here, district mass vaccination with Q delay equal to 1, 2 or 3 is usually better than baseline interventions alone.
Optimal value of Qdelay, Q*delay, assuming various vaccine fatality rates, δv per million, for outbreaks starting in different districtsFootnote †
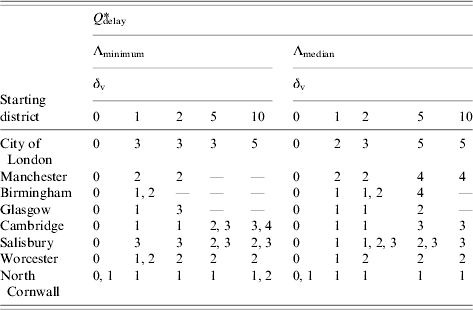
† Outbreaks initiated with ten index cases. Q delay is defined as the required number of symptomatic cases in isolation in a district before district mass vaccination is implemented within that district.
Sensitivity analysis
Extensive sensitivity analysis, focused on identifying the more risk averse strategies, Λminimum (see Appendix), was conducted by varying the number of index cases and key model parameters. Poorer contact tracing efficiencies (0·5), higher values of R 0 (up to 7), and larger numbers of index cases (up to several thousand) all tended to reinforce the benefits of district mass vaccination, with trigger values of Q delay in the range 1–10, the higher values with the higher assumed vaccine fatality rates (Table 4). Conversely, baseline interventions alone were favoured when R 0 was low (R 0=3), particularly for outbreaks starting in well-connected districts. Adjusting the proportion of infections caused during the prodromal period (2·5–20%) had little effect on the results. Neither did doubling the extent of population movement between patches, except for the case of outbreaks starting in the City of London, where baseline interventions alone were optimal.
The model disease parametersFootnote †
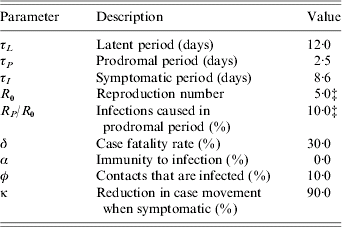
† See text for discussion and references.
‡ Varied in sensitivity analysis.
Optimal value of Qdelay, Q*delay, and the relative reduction in total deaths by implementing district mass vaccination over baseline interventions, Λminimum and Λmedian, assuming various vaccine fatality rates, δv per million, with different numbers of index casesFootnote †

† Note that the blank entry indicates that baseline interventions alone is the optimal strategy. Q delay is defined as the required number of symptomatic cases in isolation in a district before district mass vaccination is implemented within that district.
Discussion
The simulations discussed in this paper indicate that for smallpox outbreaks, already being tackled by the most targeted approaches (finding and isolating symptomatic cases and tracing, vaccinating and observing contacts), fewer total deaths can often be achieved by the addition of district mass vaccination. Previous studies argued that either large-scale mass vaccination would be necessary for adequate control, especially if resources are limited [Reference Bozzette29–Reference Kaplan, Craft and Wein31], or more targeted strategies would be sufficient [Reference Riley and Ferguson15, Reference Bozzette29], especially for outbreaks with few index cases. Some of the reasons for these different conclusions have been discussed in depth elsewhere [Reference Kretzschmar19, Reference Ferguson32, Reference Eichner33]. The question has remained, however, under what, if any, circumstances might targeted approaches be usefully switched to include vaccination of some larger section(s) of the population [1, 2, Reference Kretzschmar19, Reference Bozzette29]. In our simulations we have confirmed that the addition of nationwide mass vaccination would be suboptimal for outbreaks with smaller numbers of index cases [Reference Eichner33]. We have also confirmed that for outbreaks with few index cases targeted approaches employing case isolation and contact tracing could control a smallpox outbreak [Reference Kretzschmar19, Reference Bozzette29, Reference Eichner33]. Most significantly we have demonstrated for the first time by using a demographically realistic metapopulation patch model that for most of the scenarios examined, a superior strategy was to supplement the basic targeted approaches with district mass vaccination waiting until a district has a small number of cases. Across a wide range of scenarios, this trigger only varied between 1 and 10 isolated cases, and was close to 1 for many scenarios. Only in a limited number of scenarios (smaller numbers of index cases, low estimates for R 0 and more optimistic contact tracing efficiencies) was the addition of district mass vaccination suboptimal. Nationwide mass vaccination was optimal only if the outbreak started in the City of London district with of the order of 100 (‘worst case scenario’) or 1000 (baseline scenario) index cases, with conservative assumptions regarding the vaccine fatality rate.
We have considered neither the logistical constraints of delivering control strategies nor their interaction with the disease process. This parsimonious approach was taken to make the model more computationally tractable, allowing extensive sensitivity analysis. The disease dynamics were modelled more ‘phenomenologically’ than by Kretzschmar et al. [Reference Kretzschmar19] and Riley & Ferguson [Reference Riley and Ferguson15], with a fixed rate of case contacts and a time invariant infectiousness and probability of diagnosis. Kretzschmar et al.'s stochastic branching model and Riley & Ferguson's individual-based micro-simulation model both had more realistic parameterization of these aspects, but similarly showed, with assumptions that closely resemble the baseline interventions in our model, that these can be successful in containing a smallpox outbreak. We have also more formally compared model results by re-parameterizing our model to account for differences in assumptions between studies. These simulations gave results similar to those of Kretzschmar et al. and Riley & Ferguson where regionally targeted mass vaccination was not considered, with some variation in our results dependent on whether outbreaks started in well- or less well-connected districts. However, whilst we agree that for less severe scenarios targeted controls are often better, there are a wide range of starting assumptions, such as large numbers of index cases, where the addition of district mass vaccination provides appreciable benefits (5–80% fewer total deaths).
Differences between studies probably arise because of how regional mass vaccination and other interventions have been implemented. Riley & Ferguson assume that no interventions will be implemented until 21 days after the index cases have become infectious. This seems somewhat pessimistic, since all of these cases will have essentially been outside of any form of isolation for most of their symptomatic infectious period, whilst also most probably in a sick and disabled state. Further, this assumption would not have scaled well with numbers of index cases in our sensitivity analysis; it seems unreasonable to assume that 100 or more cases would reach 21 days from the beginning of their infectious period before public health authorities became aware. We assumed that baseline interventions would be implemented once there are four symptomatic cases in the community. This is a more optimistic assumption and results in less transmission before the implementation of interventions. We have, however, examined scenarios broadly similar to those of Riley & Ferguson and still find some benefit of district mass vaccination. Direct comparison shows that by waiting until there were only four symptomatic cases in the community only 2–3 million vaccines were administered in total, whilst waiting for 21 days after the index cases became infectious 8–9 million vaccines in total were used. This is still somewhat lower than the 13 to 14 million doses of vaccine observed by Riley & Ferguson under similar parameter assumptions (policy seven and higher transmission scenario C). This approximately 50% increase in vaccines administered is probably a result of the arguably wider extent of the regionally targeted vaccination policy used by Riley & Ferguson. A major advantage of this study is that we have been able to demonstrate that there are potentially rational triggers for implementing beneficial regional mass vaccination strategies and that this depends to some degree on where the index cases are geographically located. This was possible since our model parameterized the longer range movements of individuals directly on the census movement data that captured the specific peculiarities of regional movement rather than on a generalized movement kernel.
In conclusion, we have demonstrated that targeted controls are probably optimal for a number of smallpox release scenarios, particularly for small numbers of index cases and lower transmission rates with efficient interventions. Even for scenarios with higher R 0 and larger numbers of index cases we have confirmed that these controls are likely to manage outbreaks. However, we have also shown that there are a large number of scenarios where district mass vaccination would probably provide a meaningful benefit in minimizing the total numbers of lives lost. The optimum trigger varies with starting district but is generally small and under none but the most extreme of scenarios was national mass vaccination ever an optimal strategy. It would be interesting to determine the potential benefits of mass vaccination in smaller geographic areas than districts.
Ultimately, it will be critical for real-time data collection and analysis to assess which type of scenario is developing and to adapt ongoing intervention strategies accordingly. Such data would also need to give early enough warning of a ‘failing’ intervention to allow intensification or de-escalation of controls sufficiently rapidly to prevent substantial excess deaths [Reference Ferguson32].
Appendix
Detailed model formulation
Prior to the implementation of public health intervention strategies the total population (N) is divided into six classes; susceptible (S), latent (E U), prodromal (P U), symptomatic (I), recovered (R) and dead (D). When the population in the symptomatic class reaches I trigg baseline interventions are begun. Traced contacts are divided into those that are uninfected (C) and those that are infected (E T). Uninfected traced individuals move into the vaccinated group (V T) or back to the susceptible population (if the vaccine failed). Infected traced individuals leave to enter either the vaccinated group (although with reduced vaccine efficacy) or develop the disease and become prodromal but under observation (P T). Untraced uninfected contacts are ignored while untraced infected contacts (E U) eventually enter the prodromal state (P U) in the community. Each person that becomes symptomatic either enters isolation (Q) or remains in the community. Only a certain proportion of the population can be vaccinated and thus we divide the susceptible population in two; those that can be vaccinated (S V) and those that cannot (S). When the population in the isolation class reaches Q delay a proportion of the population that may be vaccinated, γ, is removed from S and enters S V (i.e. S V=γS with S then containing the remaining susceptible population). Following mass vaccination, those that have been vaccinated enter the vaccinated class (V P) or back to the susceptible population (S) (if the vaccine failed).
We can write down a set of conservative equations describing the dynamics outlined above (with parameter values given in Tables A 1 and A 2):

with the transmission terms T and T V given by

where R P and R I are the average number of secondary cases caused during the prodromal and symptomatic periods respectively. We complete the governing set of equations with the initial conditions, S(0)=(1−α)N−E 0, E U(0)=E 0, R(0)=αN, with all other classes equal to zero at time zero, where E 0 is the number of initial latent individuals (index cases) seeded in the residential population of a district. Note that in the main text [see Results, equations (1) and (2)], D∞, D 0 and  refer to the cumulative number of deaths over the entire course of the epidemic.
Further to the temporal dynamics discussed above, we incorporate spatial dynamics into the model by allowing the transmission equation (A 2) to become a vector of length M,

where we use the subscript notation m to differentiate the events occurring over the M districts.

where C S/I are M×M matrices representing the proportion of susceptible and symptomatic individuals that move from one district to another.
Detailed sensitivity analysis
With R 0 reduced to 3 (other parameters unchanged) epidemics starting in less well-connect districts still benefit from district mass vaccination with Q delay*=1 (assuming δv=1) but epidemics starting in well-connect districts are optimally controlled through baseline interventions alone. Well-connect starting districts tend to have large populations (and are themselves mostly connected to other districts with large populations) which results in a large number of vaccine-related deaths. This shifts the balance in favour of baseline interventions when there are fewer smallpox deaths due to the lower R 0. For higher values of δv there is no additional benefit from district mass vaccination over baseline interventions for any starting district.
The model intervention parametersFootnote †

† See text for discussion and references.
‡ Zero prior to intervention.
§ Varied in sensitivity analysis.
Reducing R 0 to 3 and reducing contact tracing efficiency to 0·5, outbreaks started with ten index cases give results very similar to those in Table 3 when assuming δv=1, but lean in favour of baseline interventions alone for higher vaccine fatality rates.
Returning to baseline assumptions (R 0=5 and contact tracing efficiency=0·8) but reducing the number of index cases to five again gives results very similar to those in Table 3 when assuming δv=1, but which lean in favour of baseline interventions alone with higher vaccine fatality rates. Increasing the number of index cases above ten results in progressively lower values for Q delay* indicating that implementing district mass vaccination earlier is beneficial in controlling outbreaks which have increased initial severity. With the number of index cases equal to 100, the results are similar to those in Table 3; however, the blank table entries which indicated previously that baseline interventions alone were optimal now have optimal values of Q delay between 5 and 10, indicating district mass vaccination with these trigger values would be beneficial. Increasing the number of index cases to 250 and assuming δv=1 results in Q delay*=1, with the other values remaining approximately as for 100 index cases with higher vaccine fatality rates. Increasing the number of index cases further to 1000 results in Q delay*=1 (or slightly above) for all non-zero vaccine fatality rates (δv⩽10) with the exception of the City of London (see below). Q delay=1 is optimal for all outbreaks starting in well-connect districts (except the City of London) up to ∼1000 index cases and for less well-connected districts up to ∼30 000 index cases. However, above these thresholds the difference between Q delay=0 and Q delay=1 becomes marginal and either strategy (nationwide mass vaccination or district mass vaccination) is equally advantageous, with the conservative assumption that δv=1. District mass vaccination with Q delay=1 is still optimal, however, with higher assumed vaccine fatality rates. For any of the higher vaccine fatality rates, it is only when the number of index cases exceeds ∼50 000 (where such district population sizes exist) that nationwide mass vaccination becomes optimal, but even then is only equally optimal to district mass vaccination, and this applies to outbreaks starting in both well- and less well-connected districts.
The City of London is an exception to the above. Nationwide mass vaccination becomes optimal once the number of index cases increases above ∼1000, assuming δv=1. The City of London is exceptionally well connected and therefore epidemics spread out into more districts, more quickly, which means that delaying mass vaccination has a negative impact on control and total deaths. However, with the higher assumed vaccine fatality rates district mass vaccination with Q delay=1 would still be optimal up to ∼1000 index cases in the City London. With ∼2500 index cases nationwide mass vaccination is optimal, but only with a vaccine fatality rate less than or equal to three per million. District mass vaccination with Q delay=1 is optimal with assumed vaccine fatality rates greater than three per million.
The ‘worst case scenario’ that we investigated in the sensitivity analysis here was to increase R 0 to 7 (towards the upper end of the range of values that have been reliably reported [Reference Gani and Leach21]), and reduce the contact tracing efficiency to 0·5 (probably rather pessimistic). A similar pattern of behaviour for Q delay* to that seen with the baseline parameters in Table 3 was again observed but with the shifts to the lower values for Q delay* occurring at lower numbers of index cases. That is, particularly for outbreaks started by relatively small numbers of index cases, district mass vaccination was often the optimal approach. The most notable difference is that nationwide mass vaccination becomes optimal for outbreaks starting in the City of London with ∼100 index cases assuming δv=1 and with ∼2500 index cases with a vaccine fatality rate less than or equal to eight per million; district mass vaccination with Q delay=1 is optimal with higher assumed vaccine fatality rates in both scenarios.
With baseline assumptions (R 0=5 and contact tracing efficiency=0·8) and ten index cases, decreasing or increasing the percentage of infections caused in the prodromal period from 10% to 2·5% or 20% respectively results in similar values to those in Table 3. Doubling the movement between districts has a marginal effect for all starting districts except for the City of London, where baseline interventions alone are the optimal strategy for all non-zero vaccine fatality rates (δv⩽10).
Acknowledgements
We thank Emma Kerrod for helpful discussions throughout the project. The authors also thank the Department of Health for England, the European Union Directorate General for Health and Consumer Protection (DG SANCO), the Engineering and Physical Sciences Research Council and the Health Protection Agency for contributing to the funding of this body of work.
Declaration Of Interest
None.



