1. INTRODUCTION
Microelectromechanical systems (MEMS) is a rapidly expanding field that exploits batch-fabrication technologies of the traditional integrated circuit industry to produce highly miniaturized electromechanical systems. However, MEMS computer-aided design (CAD) tools, especially optimal design synthesis tools, lag far behind integrated circuit CAD tools. Back of the envelope calculations are still the prevailing MEMS design method that the designer utilizes to create a design configuration and to select and adjust geometric parameters, based on the simulation results, to meet the design specifications with little, if any, optimization.
Previous studies on optimization-based MEMS design synthesis can be divided into two categories. The first category is parameterized optimization based on predefined configurations and local optimization of design variables over a fixed topology. For example, Mukherjee and colleagues (Fedder & Mukherjee, Reference Fedder and Mukherjee1996; Mukherjee & Fedder, Reference Mukherjee and Fedder1997; Mukherjee et al., Reference Mukherjee, Iyer and Fedder1998) presented structured design methods for MEMS design synthesis with a focus on optimization of a predefined design configuration to best meet performance requirements, and Deb et al. (Reference Deb, Iyer, Mukherjee and Blanton2001) demonstrated MEMS resonator synthesis for defect reduction based on a method using gradient-based constrained optimization coupled with a gridded multistart algorithm.
The other category of optimization-based MEMS design synthesis involves adapting global stochastic search methods into the design process. Many of these stochastic methods allow for improved emergent structures. For example, Kirkos et al. (Reference Kirkos, Jurgilewicz and Duncan1999) used a genetic algorithm (GA) to generate the optimal design of a tuning fork gyroscope, and Ma and Antonsson (Reference Ma and Antonsson2000a, Reference Ma and Antonsson2000b, Reference Ma and Antonsson2003) developed an automated MEMS synthesis tool based on GAs for producing optimal mask-layouts and associated fabrication process sequences given a desired device shape and several fabrication process choices. Both studies focused on the optimization of a single objective function. Zhou et al. (Reference Zhou, Zhu, Agogino and Pister2001, Reference Zhou, Agogino and Pister2002) were the first to demonstrate MEMS component synthesis using a multiobjective GA (MOGA) on a simple MEMS device, a “meandering resonator” for three objectives. Kamalian et al. (Reference Kamalian, Agogino and Takagi2004) extended Zhou's work to more challenging MEMS synthesis problems, and they explored the role of geometric constraints and human interaction in MEMS resonator synthesis.
Other researchers have developed genetic programming languages to support MEMS design synthesis. For example, Fan et al. (Reference Fan, Seo, Hu, Rosenberg and Goodman2003) used genetic programming and bond graphs for system-level MEMS synthesis. They concentrated on evolving designs that are physically realizable and have the potential to be manufactured. Fan et al. (Reference Fan, Wang, Achiche, Goodman and Rosenberg2008) later added a level of physical layout synthesis for optimizing geometric sizing parameters for cell components of the designs synthesized using a genetic programming and bond graph approach. In the physical layout synthesis level, they formulated the problem as a single-objective problem and used both GAs and deterministic algorithms for parametric optimization. Lohn and colleagues (2007; Hornby et al., Reference Hornby, Kraus and Lohn2008) also demonstrated using a genetic programming language to evolve MEMS resonators. Defining a proper function set is one of the most significant steps in using a genetic programming approach, and previous researchers have defined task-specific functionality. The challenge is to define a robust function set and representation for a general MEMS design tool.
Our long-term research goal is to develop a general automated MEMS synthesis tool that can provide a designer both optimal topologies and design parameters with designer-specified objectives and constraints. MOGAs (Tamaki et al., Reference Tamaki, Kita and Kobayashi1996; Narayanan & Azarm, Reference Narayanan and Azarm1999) require an appropriate genotype representational encoding scheme for MEMS synthesis. This representational scheme must consider design constraints as well as process constraints on the genetic operations. For example, the crossover operation exchanges sets of parameters that may result in invalid designs if process constraints are not considered. Kirkos et al. (Reference Kirkos, Jurgilewicz and Duncan1999) used a one-dimensional string of integers to encode the suspension beam dimensions of a tuning fork gyroscope. Single-point crossover was used in the GA process. Ma and Antonsson (Reference Ma and Antonsson2000a, Reference Ma and Antonsson2000b, Reference Ma and Antonsson2003) encoded a mask polygon into two real strings, with one string containing edge directional angles and the other containing edge lengths. The size of each string was set equal to the number of polygon sides. A crossover scheme called BLX-α (Eshelman & Schaffer, Reference Eshelman and Schaffer1991) was used with extra care to guarantee the offspring represent a simple polygon. For synthesizing more complex MEMS designs, the work of Zhou and Kamalian (Zhou et al., Reference Zhou, Zhu, Agogino and Pister2001, Reference Zhou, Agogino and Pister2002; Kamalian et al., Reference Kamalian, Agogino and Takagi2004) used a fixed data structure of strings and numbers to represent the genotype, and 1-point crossover was used in the GA process. Although their research demonstrated a proof of concept for applying multiple objective GAs in MEMS synthesis, they did not provide the flexibility and efficiency needed for a general automated CAD tool for MEMS.
This paper presents an extensible, hierarchical, component-based genotype representation that is used in the MOGA process for MEMS design synthesis. We have developed an object-oriented component library as a source of practical and efficient genotypes for MEMS design. These components implicitly encapsulate domain-specific engineering experience and thus help focus MOGA into the more promising areas of the solution space. As the literature and our experience in this domain grow, new designs and components will be added to the library, promising even more effective prototyping in the future.
The new genotype representation provides reusability of genes, supports flexible genetic operations, and enables automatic design topology exploration and optimization at the same time. Previous work did not provide an extensible representation that facilitated combining these functions together. For example, the genotype representation in Kirkos et al. (Reference Kirkos, Jurgilewicz and Duncan1999) only allowed parameter optimization for a given design topology. Ma and Antonsson (Reference Ma and Antonsson2000a, Reference Ma and Antonsson2000b, Reference Ma and Antonsson2003) focused on mask layout of a given design and their encoding scheme only applied to mask polygons. Fan et al. (Reference Fan, Seo, Hu, Rosenberg and Goodman2003, Reference Fan, Wang, Achiche, Goodman and Rosenberg2008) used a genetic programming tree as the genotype representation; however, the operators only permitted design topology change, not design optimization. The encoding scheme presented in Lohn, Kraus, and Hornby (Reference Lohn, Kraus and Hornby2007; Hornby et al., Reference Hornby, Kraus and Lohn2008) could only apply to MEMS resonators with a fixed center mass and less than four legs. The authors did not extend it to a general encoding scheme for MEMS synthesis.
To demonstrate the efficiency of the new MOGA process based on the new genotype representation, we apply it to the microresonator design used by Kamalian et al. (Reference Kamalian, Agogino and Takagi2004), as this is the most developed evolutionary MEMS framework available for microresonators. The results show that incorporating engineering domain knowledge, via a component-based genotype representation, can dramatically improve the effectiveness of a MOGA design synthesis process and make it more easily extensible.
The remainder of this paper first presents our MOGA process for MEMS design synthesis based on the hierarchical component-based genotype representation. The microresonator case study is then used to demonstrate the advantages of the new MOGA process. We conclude the paper with a discussion and future research.
2. MOGAs FOR MEMS DESIGN
GAs are probabilistic heuristic search procedures that simulate the process of natural selection (Goldberg, Reference Goldberg1989). They were introduced by John Holland (Reference Holland1975) to explain the adaptive processes of evolving natural systems and for creating new artificial systems in a similar way. Goldberg (Reference Goldberg1989) demonstrated how to use GAs in search, optimization, and machine learning. GAs have the potential to avoid being trapped in local suboptima and can handle optimization problems with continuous, discrete, or combinatorial variables. They are also efficient in handling multiobjective optimization problems.
A GA maintains a population of potential solutions to the targeted problem for each nth generation. Each potential solution is represented by a chromosome and is evaluated to give a measure of “fitness.” A new generation (n + 1) is formed by applying genetic operators (selection, mutation, and crossover) to the nth generation based on fitness rankings. More fit individuals have a higher probability of being selected and passed to the next generation. Some individuals are transformed by means of mutation or crossover to form new individuals. Mutation operations create new individuals by making random changes; crossover operations create new individuals by combining parts from multiple individuals. If allowed to run long enough, these stochastic selective GA operations have the potential to converge to globally optimal solutions in the search space.
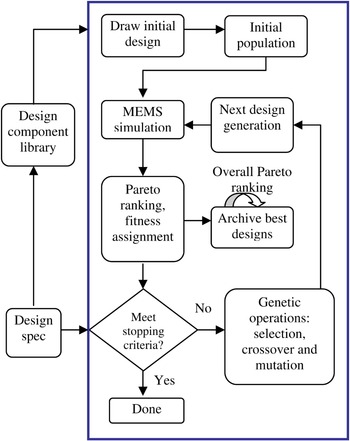
The MOGA process for MEMS design synthesis is shown in Figure 1. The MOGA uses the Pareto-based fitness assignment approach originally proposed by Goldberg (Reference Goldberg1989). Before starting the MOGA process, the designer needs to specify the design objectives, constraints, and stopping criteria by filling in the provided forms. Drawing from the MEMS design component library, an initial valid design or a set of designs is loaded into the MOGA process. The initial design(s) can be provided by the designer (Zhang et al., Reference Zhang, Kamalian, Agogino and Séquin2005) or recommended by a MEMS case-based reasoning tool (Cobb et al., Reference Cobb, Zhang and Agogino2006). MOGA then makes many strongly mutated copies of the initial design(s) to produce the first generation for the GA process. The genetic operations that will be discussed later are applied to the current generation to generate the designs in the next generation. The new generation goes through the same process again until the stopping criteria are met.
The multiobjective genetic algorithm process for microelectromechanical system design synthesis. [A color version of this figure can be viewed online at journals.cambridge.org/aie]

Because GAs are stochastic global search methods, they are quite likely to generate close to optimal solutions at some intermediate point, but later lose them again in the evolutionary process. To avoid this, one solution is to force MOGA to pass all of the best designs to the next generation. However, this might lower the degree of diversity of the GA population, and the diversity ensures that the GA population stays representative of the search space and avoids being trapped in local optima. Therefore, we added an archiving procedure after each generation of the MOGA process. The best designs, based on a Pareto ranking of all designs seen so far, are copied into this archive. The best designs found during the whole evolutionary run can then be presented to the designer at the end of the design synthesis process.
2.1. Genotype representation
To be successful for engineering design problems, GAs require a parametric encoding of the evolving phenotypes that is efficient, yet flexible enough to describe new and creative solutions. The main challenge is to find a way to properly encode the design parameter set so that changes in the associated genotype are operationally meaningful and flexible enough to have a chance of finding good designs.
The genotype representation originally developed in GAs used a fixed length bit string. For complex engineering design problems, however, such as MEMS synthesis, a more sophisticated representation is needed. Peysakhov and Regli (Reference Peysakhov and Regli2003) combined two data structures to represent the genotype of Lego structures for the evolution of assemblies: an array containing all nodes in the structure and the adjacency hash table containing all edges with corresponding string keys. Lee and Saitou (Reference Lee and Saitou2007) used a vector of fixed length to represent the connecting points in a given product geometry for assembly synthesis. Each component in the genotype is a vector of three components specifying the decomposition type of a connection and joint types.
We built on the work of Zhou et al. (Reference Zhou, Agogino and Pister2002), using structured real value strings of variable length to represent the genotype for a MEMS design. In the following we describe a flexible, hierarchical component-based genotype representation that serves the computationally tractable MOGA framework for a general automated CAD tool for MEMS.
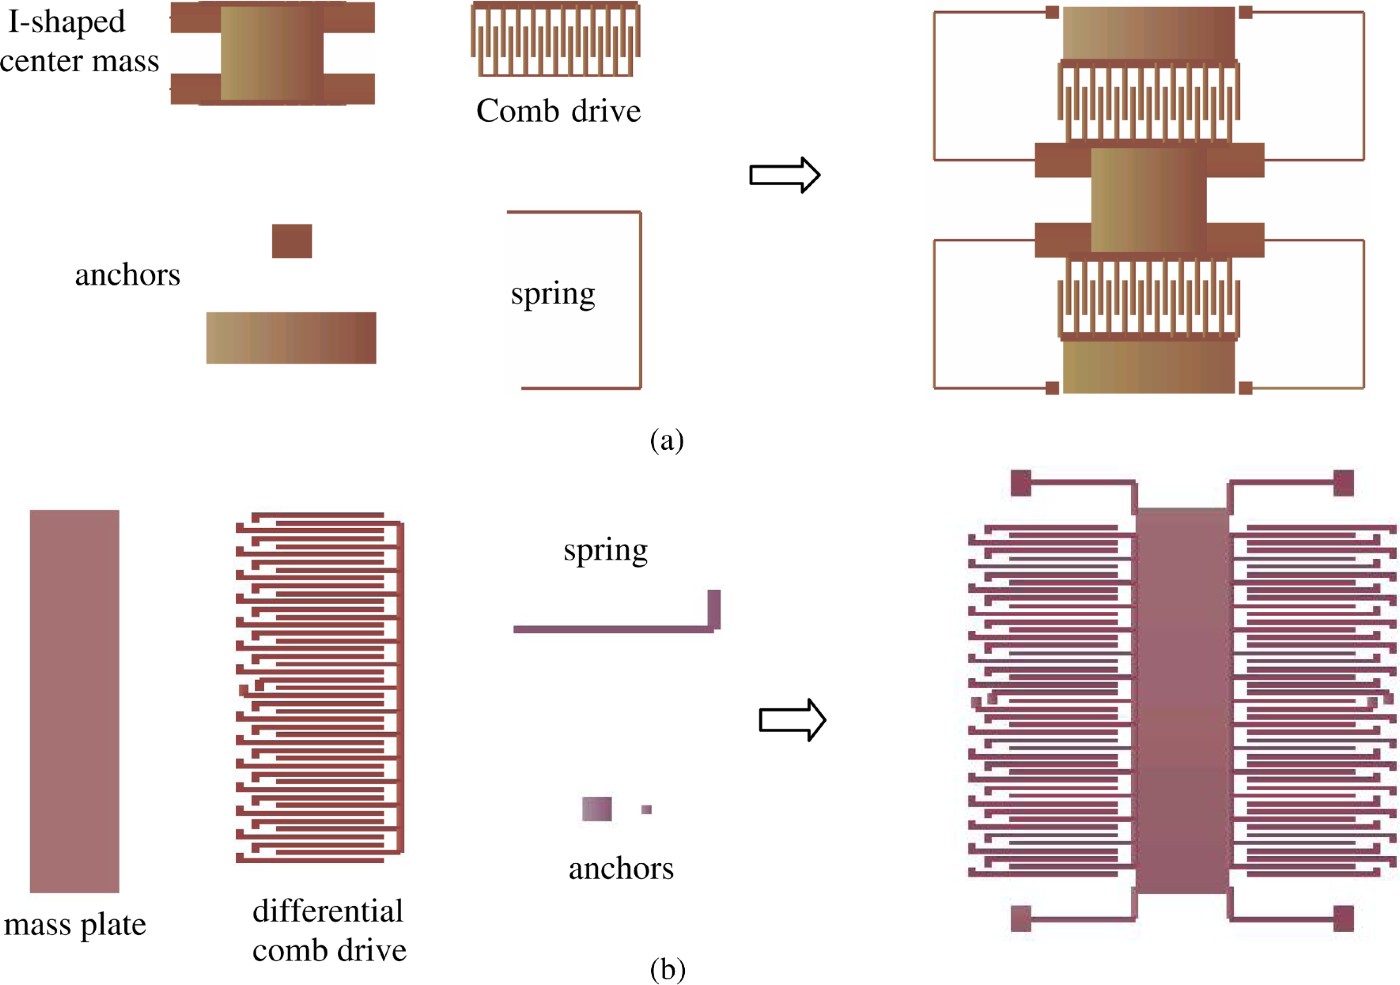
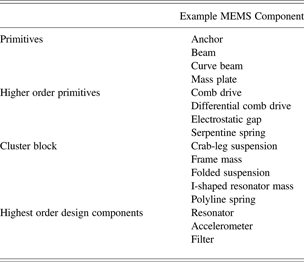
The hierarchical component-based genotype representation presented here is based on an object-oriented MEMS component library, which was implemented with a data structure codeveloped with Graf (Reference Graf2004). This object-oriented data structure enabled us to implement a MEMS component library that was separated from the GA process but served as design component sources for the process. We further added practical design constraints and connectivity-related instructions to the data structure to evolve practical MEMS designs. The component library consists of simple primitives, cluster blocks, and whole operational resonator designs. For surface-micromachined MEMS, typical primitives are anchors, beams, and mass plates. Higher order parameterized primitives include serpentine suspensions, electrostatic gap, comb drives, or differential comb drives. Cluster blocks may combine many primitives into polyline springs, I-shaped resonator masses, or various folded flexure frames. At the highest level in the component library complete resonator examples can be found. Commonly used MEMS components are listed in Table 1. These components are assembled in a global two-dimensional layout coordinate system for fast prototyping of surface-micromachined MEMS designs, demonstrated using a resonator (Fig. 2a) and an accelerometer (Fig. 2b). Each component typically carries an “angle” parameter that specifies its orientation in the layout plane, whereas its translational position is derived from the specified connectivity between components via a coincidence constraint of the connection points involved and the relative distance from the point randomly selected as the origin.
Examples of fast prototyping of microelectromechanical system designs from the component library: (a) a surface-micromachined resonator and (b) a microaccelerometer. [A color version of this figure can be viewed online at journals.cambridge.org/aie]

Example MEMS components in the component library

Note: MEMS, microelectromechanical systems.
The MEMS designer can input the following types of constraints: dimension constraints, mutation and crossover constraints, and symmetry constraints. The design dimension constraints can also be added to impose relevant fabrication design rules into the synthesis process. Mutation constraints determine if a design component is allowed to mutate during the evolutionary process. Crossover constraints limit which components are permitted to be exchanged during the GA process. By default, the components that have similar functionality and connectivity are allowed to be swapped by the crossover operation, but the designer can change the default setting if needed. Symmetry constraints can reduce the design search space, and only symmetric designs are evolved during the MEMS synthesis process (Kamalian et al., Reference Kamalian, Agogino and Takagi2004). Additional constraints will be added into the process with increased domain-specific knowledge and lessons learned from fabrication and testing (Kamalian & Agogino, Reference Kamalian and Agogino2005).
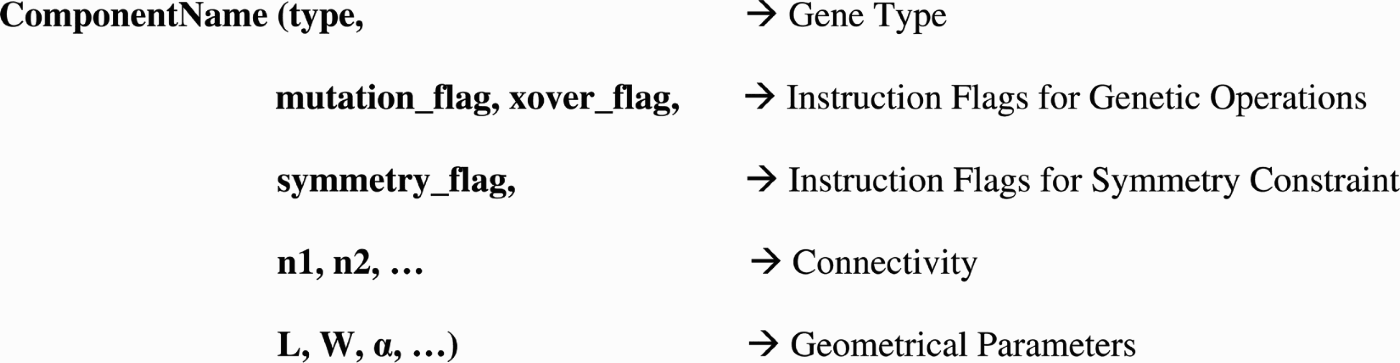
A typical entity interface in the component library is shown in Figure 3. To serve as MEMS component sources for the MOGA synthesis process, each design component is assigned an exclusive type number and is represented by a gene of its own. This gene carries all salient information about this component: its geometric layout parameters, as well as constraints on how it can be modified and what genetic operations can be applied to it. The actual data fields can be real numbers, integers, strings, or binary flags.
The entity interface of building blocks in the microelectromechanical system component library.

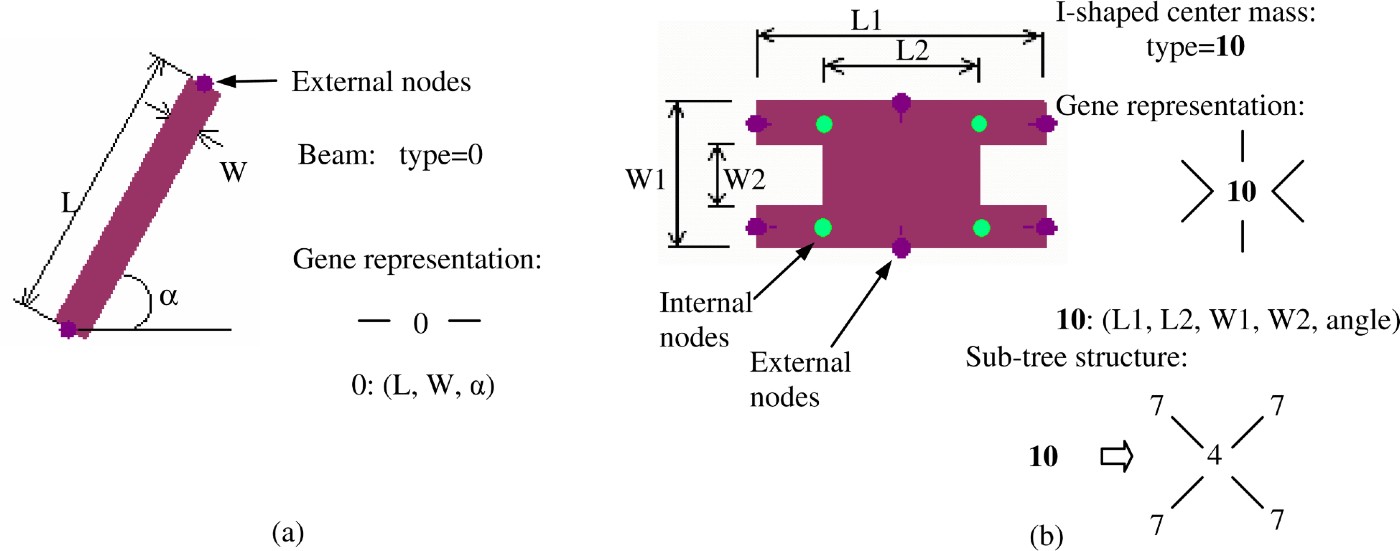
Figure 4 shows examples of primitive and cluster components and their representative genes. Figure 4a is a primitive MEMS design component, a beam. We define this gene to be of type 0, and its geometrical parameters are length, width, and its positional angle in the global coordinate frame. Figure 4b is a cluster building block, an I-shaped center mass. It is assigned gene type 10 (bold numbers are used to represent cluster genes), which includes four “beams” (gene type = 7) and one rectangular mass plate (gene type = 4). The beams used in this cluster have fewer parameters than the beam shown in Figure 4a. They have no individual angle variables, because they are all aligned with one another. The geometrical parameters for this cluster are shown on the figure, except for its overall orientation angle. Internal and external nodes are the points of the components through which the building blocks are connected and registered to one another. They implicitly define the placement in the layout coordinate system. A cluster gene has subtree structures to represent the internal hierarchy. Even though the gene in the subtree have their own geometrical parameters, many of them are coupled to parameters in the parent gene to permit an overall parameterized design description. The node-based hierarchical representation also makes the MEMS design components compatible with our simulation engine SUGAR (Clark et al., Reference Clark, Bindel, Zhou, Nie, Kao, Zhu, Kuo, Pister, Demmel, Govindjee, Bai, Gu and Agogino2002).
Gene type examples for a microelectromechanical system building block: (a) a primitive gene type example and (b) a clustered building block gene type example. Bold numbers are used to represent cluster genes. [A color version of this figure can be viewed online at journals.cambridge.org/aie]

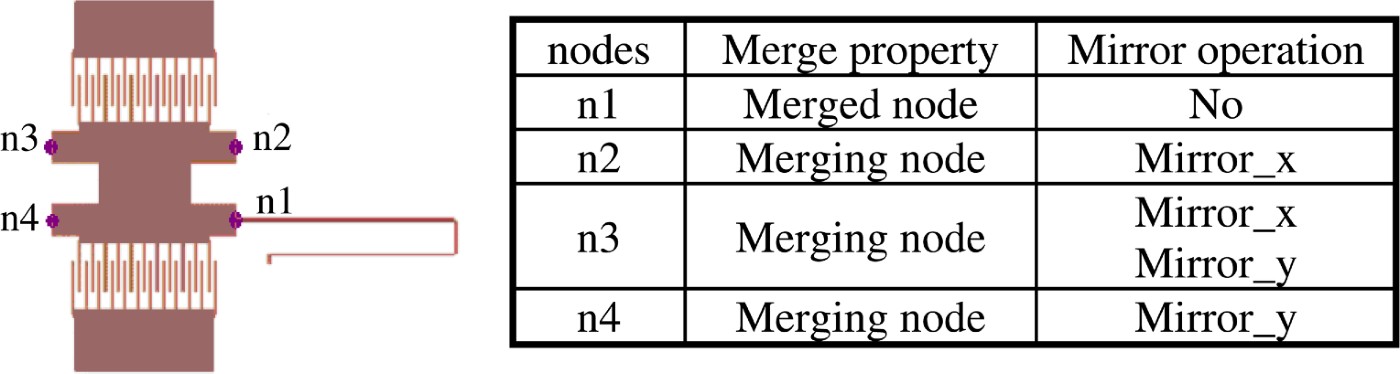
Other than determining location and connectivity of the components in the SUGAR netlist, external nodes provide the opportunities to associate connectivity-related instructions to certain nodes for implementing knowledge-based constraints. Taking the symmetry constraint as an example, only one polyline spring (Fig. 5) needs to be evolved during the design synthesis process to evolve a symmetric resonator design as shown in Figure 6. This spring is copied and moved to the other three locations. To create the symmetric design effectively, special instructions are associated with the four external nodes (Fig. 5) of the I-shaped center mass component, which are connected to the suspended springs. A “merged node” means the corresponding node of the copied version of the polyline spring will be merged into a “merging node.” The Mirror_x (or Mirror_y) operation means the copied spring will be mirrored along the x axis (or along the y axis) before being connected to the corresponding node of the I-shaped center mass. By assigning appropriate merge properties and mirror operations to selected nodes, different symmetry constraints can be applied during the design synthesis process.
Instructions associated with selected nodes for symmetry constraints. [A color version of this figure can be viewed online at journals.cambridge.org/aie]

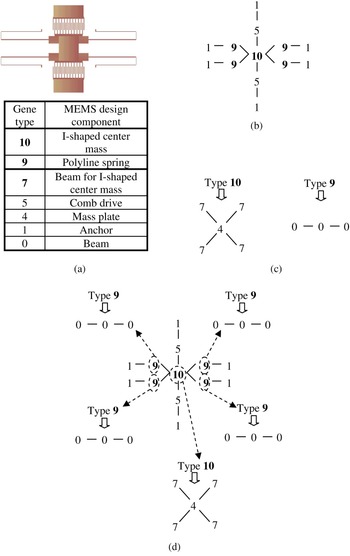
A genotype representation for a resonator example: (a) a resonator design and gene types corresponding to components in the design, (b) a gene connectivity diagram of the first layer, (c) subtree structures of cluster genes, and (d) a hierarchical genotype representation. [A color version of this figure can be viewed online at journals.cambridge.org/aie]

The genotype of a MEMS design is a tree structure with multiple layers where each layer represents a different hierarchy of the design. Figure 6 shows a complete resonator design that was evolved from our application test case described later in this paper. Its genotype is a tree structure with two layers. The circled genes in the first layer are cluster genes with subtree structures pointed by the dashed arrow. Each gene has its own design parameters. As a symmetric design, this structure has 26 different parameters, overall, including the 5 parameters listed in Figure 4 for the I-shaped center mass, 5 parameters for the comb drive (number of fingers, length and width of each finger, overlap of two fingers, and width of the spine), number of beams in each leg (three for this design), 3 parameters of each beam (length, width, and angle), and parameters of two different anchors (length, width, and angle). It is not practical to show all of the design parameters associated with each gene in the genotype representation, so we just show the connectivity diagram and the hierarchical expansion diagrams for the cluster blocks. This genotype display scheme will be used throughout this paper.
When higher level systems are synthesized, such as MEMS bandpass filters composed of multiple resonators, clusters like this resonator will be drawn from the component library. Well-designed and individually optimized components are a way to capture engineering expertise and make it readily available for future designs. Similar concepts have been demonstrated in analog circuit optimization (McConaghy et al., Reference McConaghy, Palmers, Gielen and Steyaert2007). Although they did not present the genotype representation explicitly, their design topology is formed from a hierarchically organized set of building blocks with respective implementation choices. Analog circuits, however, require fewer standard building blocks compared with MEMS designs. In addition, unlike a mechanically coupled MEMS device, a slight change of physical layout may not affect the performance of a circuit.
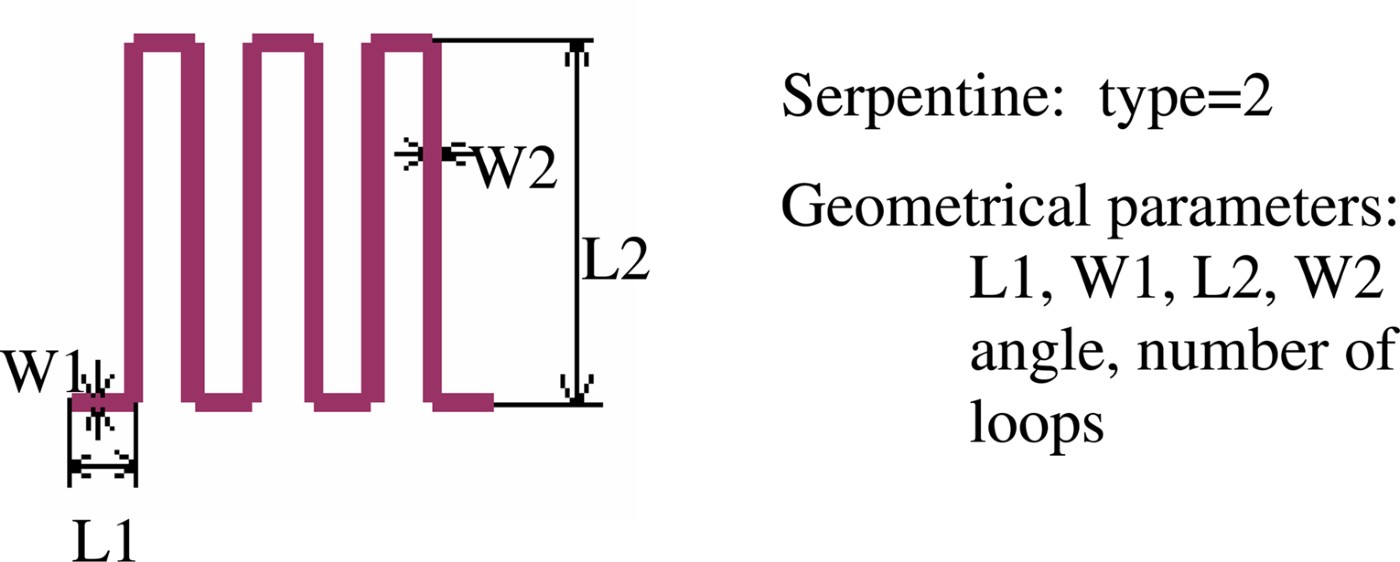
Another way to make MOGA more efficient is by reducing the dimension of the search space through knowledge-based limitations on the available degrees of freedom. We encode higher level cluster blocks with just those parameters that are absolutely vital to maintaining enough design flexibility, and turn the cluster blocks into high-order primitives. An example is the serpentine design shown in Figure 7. Even though it is composed of 13 individual beams, which when specified individually would require a total of 39 parameters, this component uses only 6 parameters in its geometric description. Use of this high-order primitive building block results in a much more compact layout and a much more efficient search process.
A serpentine component for microelectromechanical system design. [A color version of this figure can be viewed online at journals.cambridge.org/aie]

2.2. Evaluation of phenotype
The phenotypes are evaluated using SUGAR (Clark et al., Reference Clark, Bindel, Zhou, Nie, Kao, Zhu, Kuo, Pister, Demmel, Govindjee, Bai, Gu and Agogino2002), an open-source MEMS simulation tool based on modified nodal analysis. Each component in the component library is associated with its net list compatible with SUGAR. A net list file is created based on the genotype and sent to SUGAR to evaluate the design performances. Based on the design performances of all the phenotypes in the same generation, Pareto ranking (Goldberg, Reference Goldberg1989; Srinivas & Deb, Reference Srinivas and Deb1995) is applied to the current generation and a fitness value is assigned to each individual design.
Two types of design validity checks are performed for any newly generated design during the MOGA process: a design disjointedness check and a self-intersection check. A traversal through the layout tree makes sure that all nodes can be reached. For the intersection test, each component is given one or multiple rectangular bounding boxes. The separating axis theorem (Eberly, Reference Eberly2000) is then applied to each pair of bounding boxes. If the new design is disjointed or self-intersected, it is an invalid design and is discarded before being sent to SUGAR, the MEMS simulation engine for performance evaluation. This dramatically reduces the computational power that MOGA might waste exploring irrelevant regions of the search space.
2.3. Genetic operations
With our component-based genotype representation, each component has instructions about the permitted genetic operations during the evolutionary process. Before starting the synthesis process the designer can input engineering domain knowledge by specifying what mutation operations are allowed for a design component and between which components a crossover can be applied. These are the specific operations that our process uses.
2.3.1. Selection
The “Roulette Wheel” selection scheme (Goldberg, Reference Goldberg1989) is used in the MEMS design synthesis process, which follows the principle of fitness-proportionate selection for reproduction. The design with higher fitness value has a higher probability of being selected to be passed to future generations. A small portion of the best designs are passed to the next generation as elitism. Other selected designs are recombined through crossover operation and mutated to generate designs for the next generation.
2.3.2. Crossover
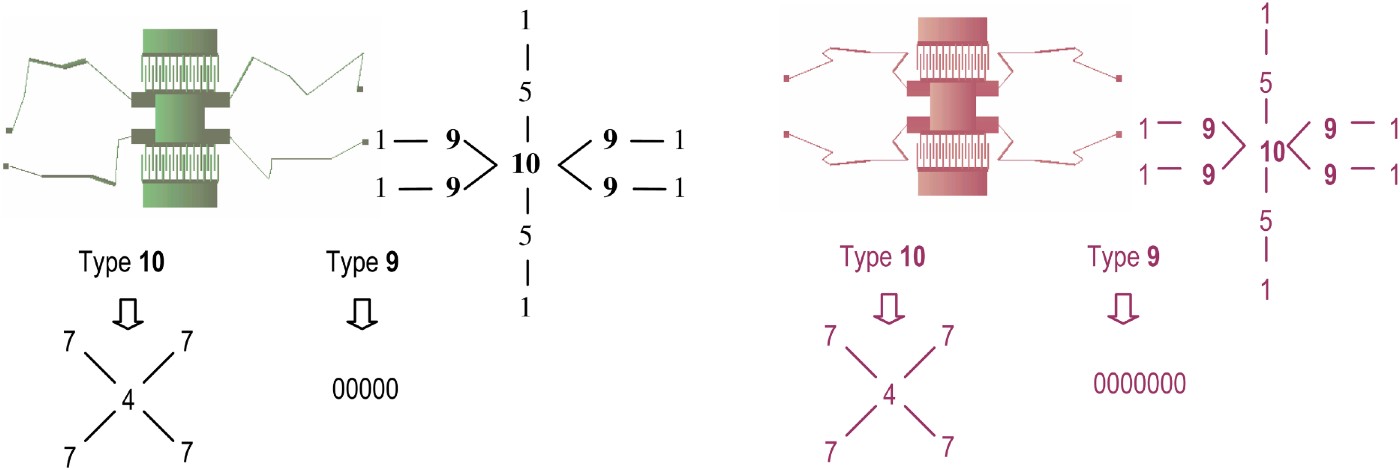
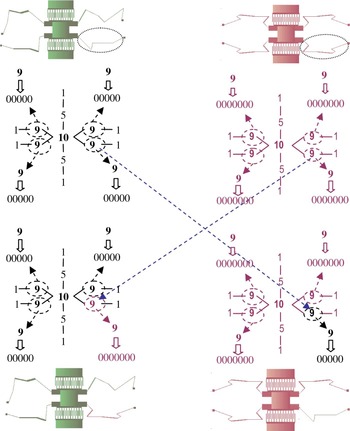
In the crossover operation pieces of genetic information are exchanged between two selected phenotypes. As exchanging arbitrary sets of parameters may not make functional sense, we use multipoint cut and splice crossover instead of 1-point cut and splice crossover. Any design component in a genotype can be swapped with a compatible design component in another genotype. Moreover, we restrict the allowed crossovers even further. The designer determines which genes are compatible genes based on their functionality and connectivity. As an example, if the resonator designs shown in Figure 8 are selected for crossover, the operation should occur between the cluster genes in the first layers of the genotypes as in Figure 9, between the primitive genes in the second layers of the genotypes as in Figure 10, or between the cluster gene in the first layer and the primitive gene in the second layer of the genotypes as in Figure 11, where the number of structure layers of a new generated design increases as the result of the crossover operation. The circled genes in the genotype are cluster genes with subtree structures pointed by the dashed arrows. Each gene has its own parameters. Because it is not practical to show them all in the genotype representation, we just show the connectivity diagram and the hierarchical expansion diagrams for the cluster blocks. The polyline springs have multiple beams connected in series; the connecting lines are not shown. In the corresponding phenotype domain, the circled components in the top two designs are swapped to generated two new designs at the bottom of each figure.
Resonator designs selected for crossover and their genotype representation. (Four polyline springs of each resonator could be different, and only one of them is demonstrated in the genotype representation.) [A color version of this figure can be viewed online at journals.cambridge.org/aie]

The crossover operation between design clusters. [A color version of this figure can be viewed online at journals.cambridge.org/aie]

The crossover operation between primitive genes. [A color version of this figure can be viewed online at journals.cambridge.org/aie]

The crossover operation between a primitive gene and a design cluster. [A color version of this figure can be viewed online at journals.cambridge.org/aie]

It might appear that it is tedious to formulate this kind of tree-structured genotype representation with crossover constraints. However, with the integration of MOGA and the hierarchical design component library, in which each component is treated as a gene and embedded with instructions for the crossover and mutation operations, the genotype is naturally formulated during the evolutionary process. The complicated crossover operations are done automatically, following predefined high-level crossover instructions. The designer only needs to designate the appropriate design components and provide design specifications and constraints in a modular building block fashion.
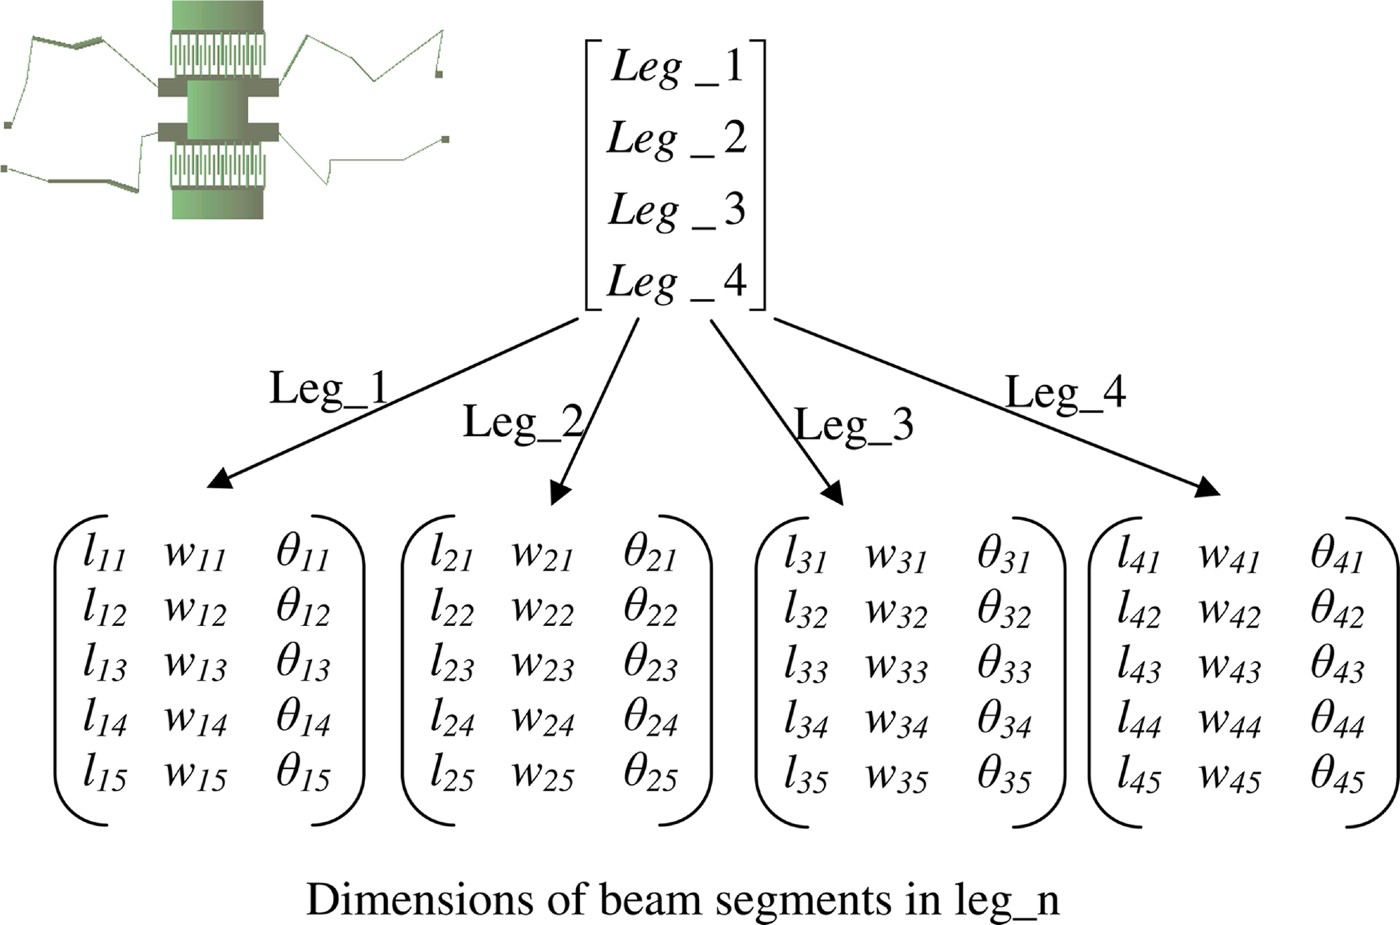
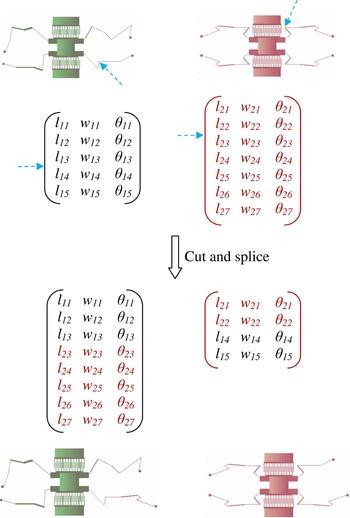
As a comparison, consider the genotype representation of a resonator design using Zhou's original encoding scheme (Zhou et al., Reference Zhou, Agogino and Pister2002) as shown in Figure 12. As the dimensions of center mass, comb drives and anchors are fixed, only four legs are encoded. Each leg is described by an m × 3 matrix, where m is the number of beam segments for that leg. The three columns correspond to the beam segment length, width, and rotation angle. One-point cut and splice crossover was used based on this encoding scheme. If leg_1 of the first parent and leg_2 of the second parent are selected for crossover, the crossover operation is shown in Figure 13. A specific data structure would need to be developed for different type of designs, and the 1-point cut and splice crossover may create invalid designs for complex MEMS devices.
A genotype representation of a resonator design based on Zhou's encoding scheme (Zhou et al., Reference Zhou, Agogino and Pister2002). [A color version of this figure can be viewed online at journals.cambridge.org/aie]

The 1-point cut and splice crossover operation used in Zhou et al. (Reference Zhou, Agogino and Pister2002). [A color version of this figure can be viewed online at journals.cambridge.org/aie]

2.3.3. Mutation
The mutation operation makes a random modification on a selected individual design. The result may be a change in topology of a randomly selected cluster gene or a modification of the geometrical parameters of a primitive gene. Note that the mutation operation is still subject to all of the dimensional and process constraints. Consider the symmetry constraint as an example. When the mutation operation is applied to a design with the full symmetry constraint, such as the design in Figure 6, only the design components in the leg connected to node n1 (Fig. 5) are allowed to be mutated if the center mass is fixed. This mutated leg is copied and pasted to other three locations (connected to nodes n2, n3, and n4) to form a symmetric resonator design.
3. EXPERIMENTS AND RESULTS
Zhou et al. (Reference Zhou, Zhu, Agogino and Pister2001, 2002) were the first to demonstrate MEMS synthesis using MOGA, and Kamalian et al. (Reference Kamalian, Agogino and Takagi2004) extended Zhou's work to more challenging MEMS synthesis problems, so some researchers have benchmarked their research against Zhou and Kamalian's work (e.g., Lohn et al., Reference Lohn, Kraus and Hornby2007). To evaluate the efficiency of the new MOGA process for MEMS design synthesis, we decided to apply it to the microresonator test case described in Kamalian et al. (Reference Kamalian, Agogino and Takagi2004). There were two design objectives: minimize error from the target resonant frequency of 10,000 Hz, and minimize the device area, which is defined as the area of the bounding box of the device without considering the anchor pads. In addition, the resonant motion must occur in the y direction; thus, the design must have higher stiffness in the x direction than the y direction. Four design cases were tested. Case 1 has asymmetric polyline legs with unconstrained beam angles; case 2 enforces a bilateral mirror symmetric layout around the y axis; case 3 employs fourfold symmetry; and case 4 also uses fourfold symmetry, but with suspensions restricted to be rectilinear and axis aligned. The constraints on the parameter values are the same as in the comparison approach (Kamalian et al., Reference Kamalian, Agogino and Takagi2004).
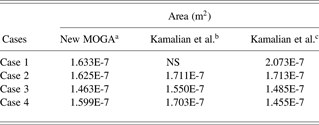
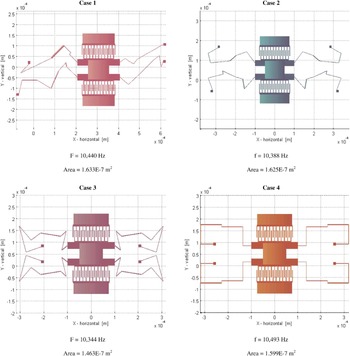
Each MOGA process was run with a population of 400 for 50 generations. The best designs (Fig. 14) found in five MOGA runs for each case were compared with the best results in Kamalian et al. (Reference Kamalian, Agogino and Takagi2004; Table 2). The “best” design was defined as the one with minimum design area, which also satisfied the following design constraints: resonant frequency within 5% of goal frequency (10,000 Hz), and the stiffness ratio requirement (K x/K y ≥ 1).
Comparison of the design area between the best designs synthesized from new and former MOGA processes

Note: MOGA, multiobjective genetic algorithm; NS, no synthesized design satisfied the design frequency target objective.
aNew MOGA process with 50 generations and 5 runs.
bKamalian et al. (2004a) process with 50 generations and 25 runs.
cKamalian et al. (2004a) process with 500 generations and 10 runs.
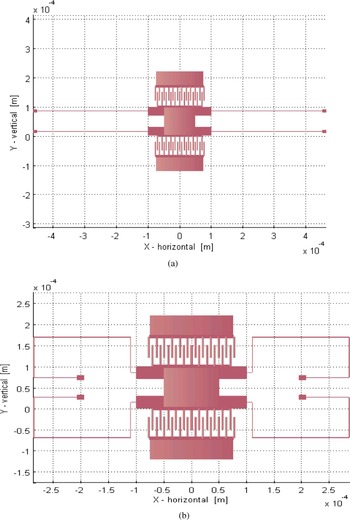
The results in Table 2 show that the new MOGA process for MEMS design synthesis results in better designs for all cases compared to the results of Kamalian et al. (Reference Kamalian, Agogino and Takagi2004) with 50 generations. The improvement of the best design area was statistically significant using the paired Student t test (Moore & McCabe, Reference Moore and McCabe1999; p = 0.005; only cases 2, 3, and 4 were evaluated, because there were no comparison results for case 1), even though each case only ran the MOGA process 5 times, thus using 5 times less computational effort compared to the 25 MOGA runs used in Kamalian et al. (Reference Kamalian, Agogino and Takagi2004). As most of the computational time is spent on the evaluations performed by the simulator, reducing the number of generations has a significant impact on the total computational time. Compared to the best results of Kamalian et al. (Reference Kamalian, Agogino and Takagi2004) with 500 generations and 10 MOGA runs, which means 20 times more computational cost than our test case, our new MOGA process results in better designs in most cases except case 4. However, case 4 after 5 runs with 100 generations yields results that exceed those in Kamalian et al. (Reference Kamalian, Agogino and Takagi2004) with a design area of 1.367E-7 m2. The best phenotype design is shown in Figure 15b.
There are several reasons why our new MOGA process for MEMS design synthesis has better performance than the one used in Kamalian et al. (Reference Kamalian, Agogino and Takagi2004). First, the new MOGA process is integrated with a MEMS design component library and has a component-based genotype representation that enables more efficient GA operations, such as multipoint cut and splice crossover instead of 1-point crossover restricted by the genotype representation of fixed-structured real-value strings used in Kamalian et al. (Reference Kamalian, Agogino and Takagi2004). Second, the designer has some control over the starting point of the MOGA process and can input their engineering knowledge via the starting design components and object-level constraints.
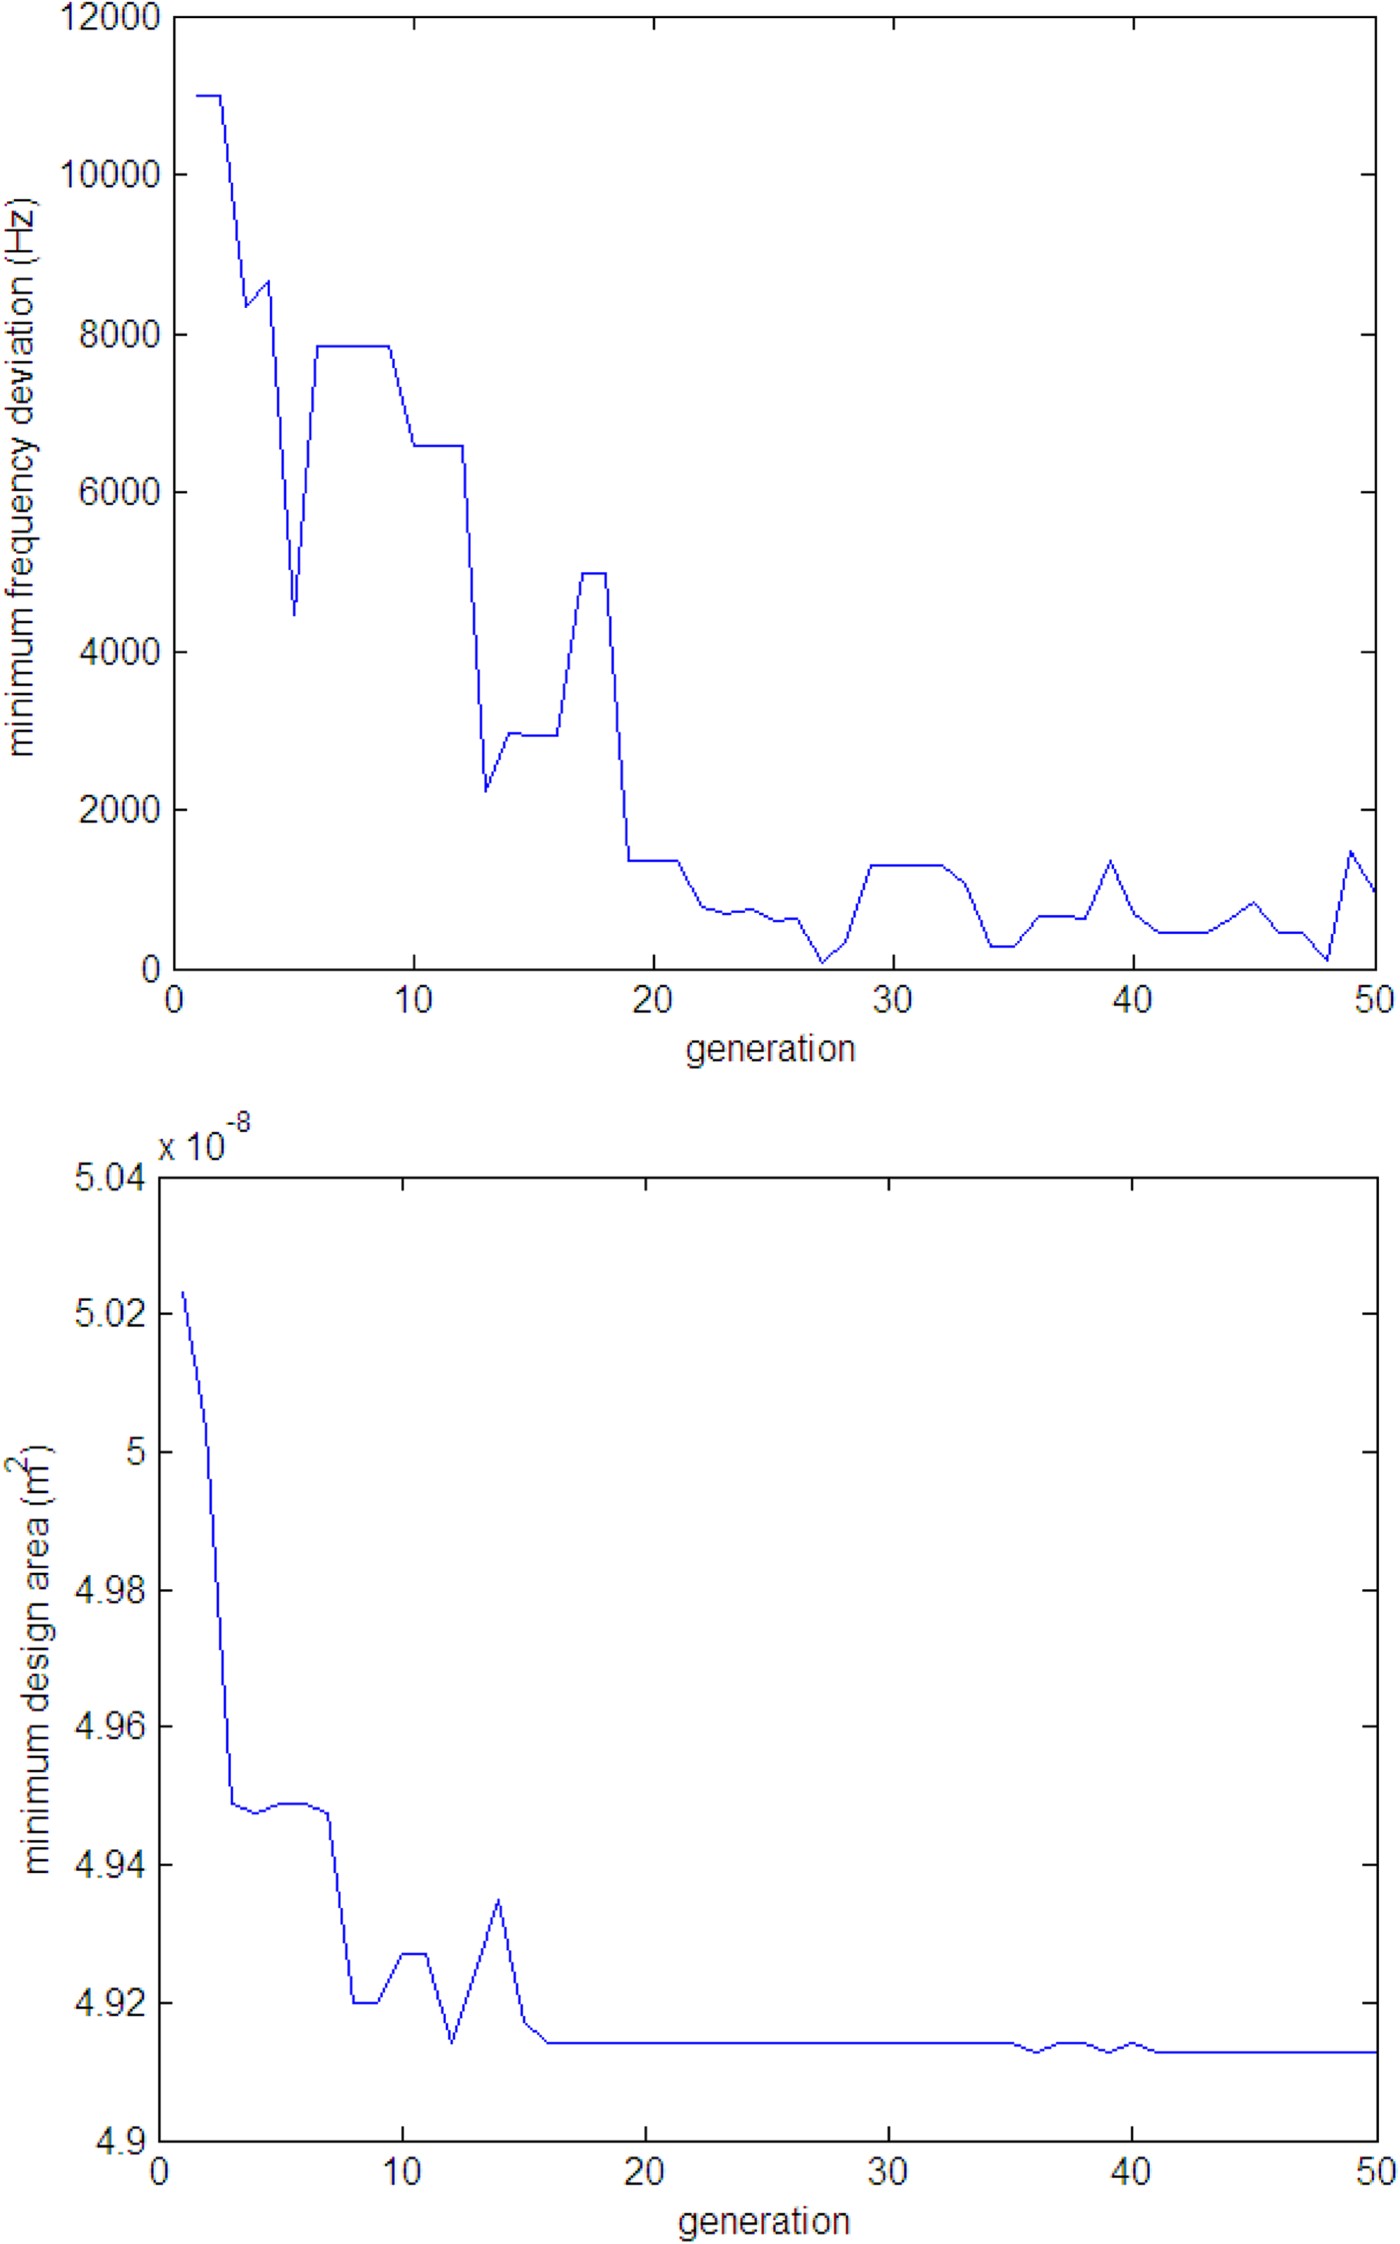
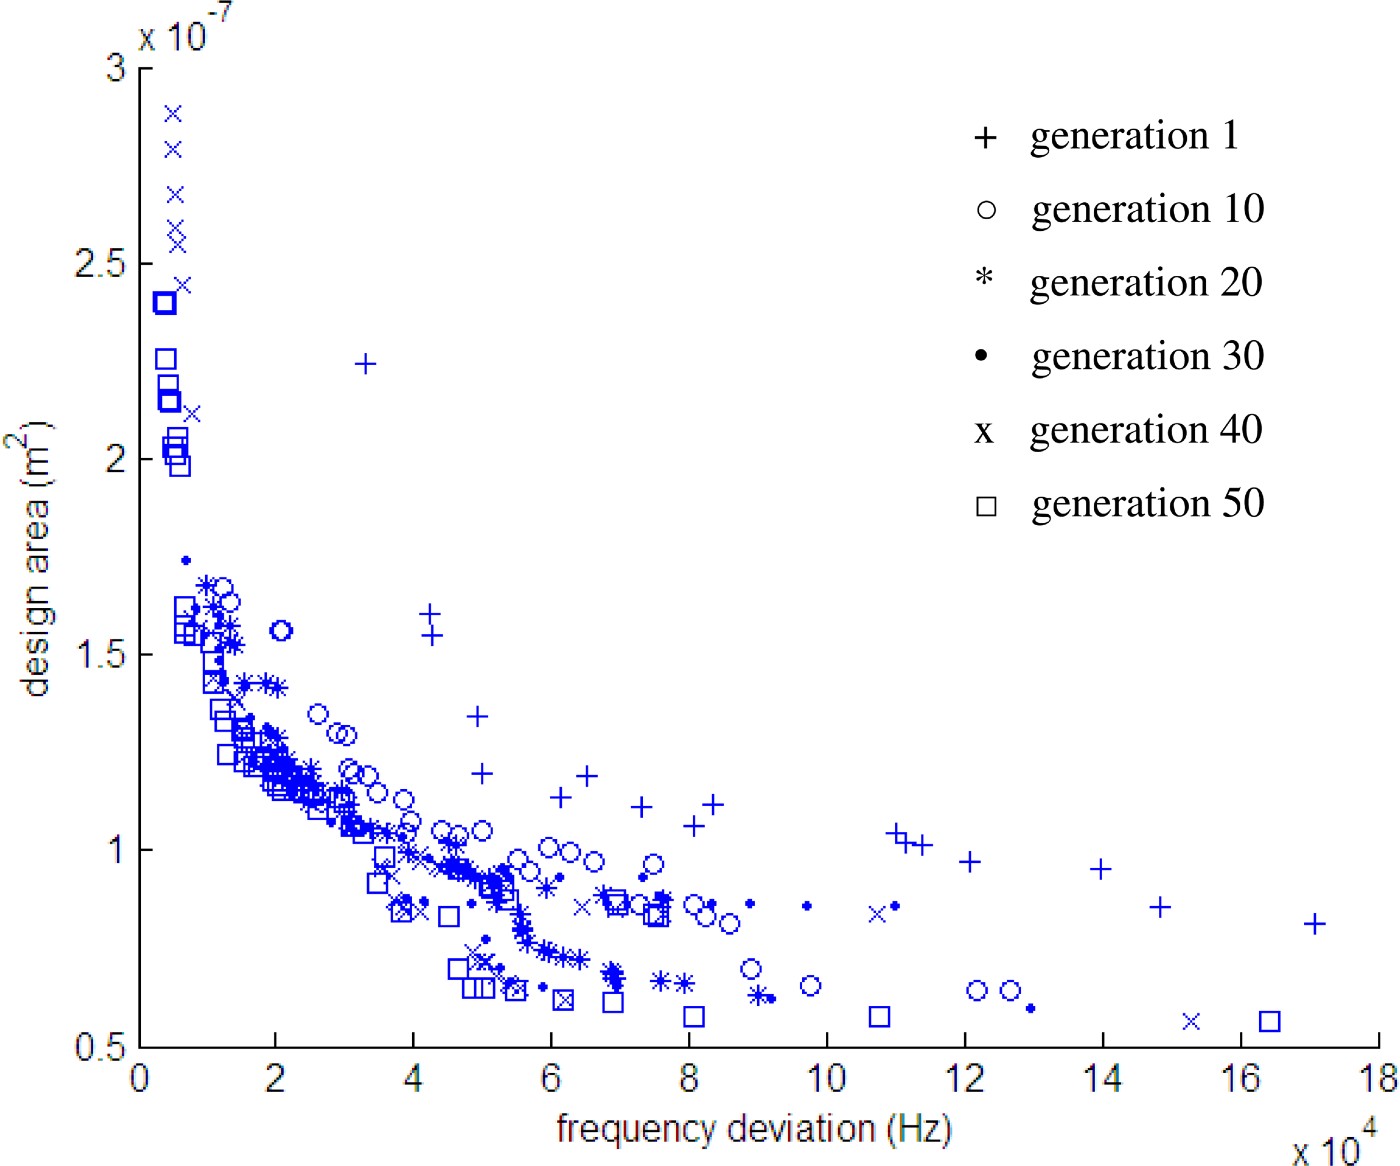
The typical convergence of the evolutionary process (Figs. 16 and 17) for the case study shows that the design synthesis process converges very quickly at the early generations, and slows down at the later generations. It does not show significant improvement after 25 generations. Good starting points could take full advantage of fast convergence at the early generations of the MOGA process. Third, the archiving process in the new MOGA process guarantees that the best design solutions reached in the intermediate generations during the stochastic search process are passed to the evaluation in the last generation. All of the best designs came from this previous generation cache: generations 37, 46, 38, and 23 for cases 1, 2, 3, and 4, respectively. Fourth, the new MOGA process is more computationally efficient. It avoids unnecessary design evaluation by using a more effective method for detecting invalid designs than the one used in Kamalian et al. (Reference Kamalian, Agogino and Takagi2004).
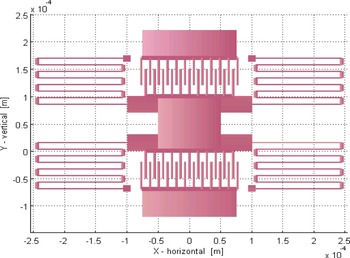
In comparing the structure of the initial design (Fig. 15a) to the best designs of all cases in Figure 14 and Figure 15b, there is a trend for the emergent designs to be characterized by legs that better utilize the layout space by turning inward. We also observed that the maximum beam length of the best design (Fig. 15b) constraint was usually at the upper boundary of 100 µm. As an experiment, case 4 was run with this constraint relaxed, but still within manufacturing requirements, and a design of the structure shown in Figure 6 evolved with f = 10,219 Hz, area = 1.587E-07 m2, stiffness ratio = 21, and maximum beam length = 232.5 µm. This trend suggests that serpentine springs might be a useful object structure to add to the component library. To further explore the advantages of incorporating engineering knowhow and human observations into the component-based genotype representation, we added a new design component: a simplified version of the serpentine spring shown in Figure 7 with the upper limit on the long beam constraint relaxed to 300 µm. It has only two parameters: length L1 and the number of loops. The number of loops can vary from 1 to 5. The length of the short beams (L2) is fixed at 12 µm, which provides enough space for the maximum displacement of the resonator in that direction. The widths of the long and short beams are fixed at 2 and 6 µm, respectively; 2 µm is a reasonable lower limit set by the available fabrication process. This new test case, number 5, evolved into a synthesized design with performance as shown in Figure 18, which is based on just one MOGA run over 50 generations with a population of 400. It has the smallest design area of all the design cases. Further gradient-based optimization of the numerical parameters on this structure did not achieve further improvements on the area objective.
The best resonator designs and their performance evolved from the multiobjective genetic algorithm process. [A color version of this figure can be viewed online at journals.cambridge.org/aie]

The (a) initial design and (b) best synthesized design of case 4 from 5 runs with 100 generations. Layout area = 1.367E-7 m2, resonant frequency = 10,497 Hz, and stiffness ratio (K x/K y) = 2.7. [A color version of this figure can be viewed online at journals.cambridge.org/aie]

The convergence of the evolutionary process. [A color version of this figure can be viewed online at journals.cambridge.org/aie]

The convergence of the Pareto set during the evolutionary process. [A color version of this figure can be viewed online at journals.cambridge.org/aie]

The best synthesized design of case 5. Design Area = 1.171E-7 m2, resonant frequency = 10,498 Hz, stiffness ratio (K x/K y) = 2, and maximum beam length = 138 µm. [A color version of this figure can be viewed online at journals.cambridge.org/aie]

4. CONCLUSIONS
A hierarchical tree-structured component-based genotype has been developed to build an extensible open-source design component library for an automated MEMS design synthesis program using MOGAs. This library includes different levels of design building blocks, ranging from simple geometrical primitives to complete resonator assemblies. Each building block in the component library is characterized by its own gene, and the full genotype has multiple genes connected together based on their functionality. This component library provides a highly effective and valuable gene pool and implicitly encodes much domain-specific engineering knowledge. This helps MOGA to converge to good design solutions much more efficiently.
MOGA can generate multiple design solutions on the Pareto frontier. Comparing the configuration of the best designs, the designer can observe design patterns and find good design constraints favoring a certain application. The accumulated knowledge can be incorporated into the design component library and design constraints for better performance and for future use. This was demonstrated by case 5 of the resonator test case. The simple serpentine spring, which was created based on the engineering observation on the emergent behavior of the resonator synthesis, generated the best designs for resonator design examples. The final solution of design example also existed as structures in the search space of other test cases; but it either did not make the Pareto set because it was not optimal under the original constraints or was not likely to be found in a reasonable amount of time because of the large search space involved.
The MOGA process for the microresonator test case quickly convergences before 25 generations and does not show significant improvement after that. In addition, the synthesis results of the test cases using different design components demonstrate that incorporating engineering knowledge can focus the stochastic global search on promising search regions and find better design solutions within a practical computational time. With more and more design components encapsulated with engineering knowledge feedback into the design component library, Cobb and Agogino (in press) have developed an indexed design case library that provides good initial designs for the MOGA process and suggest reasonable parameter ranges based on the given design specifications. In addition, more fabrication related design constraints and objectives will be incorporated into the design synthesis process to develop a practical MEMS synthesis tool (Kamalian & Agogino, Reference Kamalian and Agogino2005).
ACKNOWLEDGMENTS
The work was carried out in the Berkeley Expert Systems Technology Lab at the University of California, Berkeley (UC Berkeley). This research was partly conducted through NSF Grant CCR-DES/CC-0306557. We acknowledge the contributions of Professor Carlo Séquin, Electrical Engineering and Computer Science Department, UC Berkeley, and visiting student Sebastian Graf in the development of the object-oriented data structure (Zhang et al., Reference Zhang, Kamalian, Agogino and Séquin2005) and doctoral student Corie Cobb in the enhancements of the SUGAR-MOGA system and development of the case-based reasoning system (Cobb et al., Reference Cobb, Zhang and Agogino2006).
Ying Zhang is an Assistant Professor in the School of Electrical and Computer Engineering at Georgia Institute of Technology. She received an MS in materials engineering from the University of Illinois at Chicago (2001), an MS in electrical engineering from the University of Massachusetts Lowell (2002), and a PhD in systems engineering from the University of California, Berkeley (2006). Dr. Zhang's research interests include MEMS, sensors and smart wireless sensing systems, intelligent monitoring and diagnostic systems, and computer-aided optimal design.
Alice M. Agogino is the Roscoe and Elizabeth Hughes Professor of mechanical engineering at the UC Berkeley. She received a BS in mechanical engineering from the University of New Mexico (1975), an MS in mechanical engineering (1978) from the UC Berkeley, and a PhD from the Department of Engineering–Economic Systems at Stanford University (1984). Dr. Agogino has authored more than 200 scholarly publications; has won numerous teaching, best paper, and research awards; and is a member of the National Academy of Engineering. She has supervised 80 master's projects and theses, 32 doctoral dissertations, and numerous undergraduate researchers.