Introduction
Interactions between predators and their prey are fundamental to the understanding of underlying links between climate change and population processes, as well as ecosystem level responses (e.g. Murphy et al. Reference Murphy, Watkins, Trathan, Reid, Meredith, Thorpe, Johnston, Clarke, Tarling, Collins, Forcada, Shreeve, Atkinson, Korb, Whitehouse, Ward, Rodhouse, Enderlein, Hirst, Martin, Hill, Staniland, Pond, Briggs, Cunningham and Fleming2007). Marine top predators’ diets and reproductive performances vary considerably in response to changes in the abundance and distribution of their prey, which can be heavily influenced by changes in the physical environment, such as those currently taking place in some parts of the Southern Ocean related to global warming (i.e. air and water temperature increases, sea ice reductions etc; see Flores et al. Reference Flores, Atkinson, Kawaguchi, Krafft, Milinevsky, Nicol, Reis, Tarling, Verner, Rebolledo, Cirelli, Cuzin-Roudy, Fielding, Groeneveld, Haraldsson, Lombana, Marschoff, Meyer, Pakhomov, Rombolá, Schimdt, Siegel, Teschke, Tonkes, Toullec, Trathan, Tremblay, van De Putte, van Franeker and Werner2012, Trathan et al. Reference Trathan, Ratcliffe and Masden2012). In the Southern Ocean, Antarctic krill Euphausia superba Dana is a dominant component of most food-webs and sustains numerous land-based predator populations. However, Antarctic krill abundance fluctuates interannually (e.g. Fraser & Hofmann Reference Fraser and Hofmann2003) due to numerous factors, including winter sea ice conditions (Murphy et al. Reference Murphy, Watkins, Trathan, Reid, Meredith, Thorpe, Johnston, Clarke, Tarling, Collins, Forcada, Shreeve, Atkinson, Korb, Whitehouse, Ward, Rodhouse, Enderlein, Hirst, Martin, Hill, Staniland, Pond, Briggs, Cunningham and Fleming2007), and changes in the abundance of this single species can drive abundance shifts of krill-dependent predator populations (e.g. Trathan et al. Reference Trathan, Ratcliffe and Masden2012). When krill abundances are low, some predators are able to switch to alternative prey, such as amphipods or mesopelagic fish (e.g. Reid et al. Reference Reid, Davis and Staniland2006). The importance of alternative prey might increase in the coming decades if krill is negatively impacted by global warming, as is expected to be the case (Collins et al. Reference Collins, Xavier, Johnston, North, Enderlein, Tarling, Waluda, Hawker and Cunningham2008, Flores et al. Reference Flores, Atkinson, Kawaguchi, Krafft, Milinevsky, Nicol, Reis, Tarling, Verner, Rebolledo, Cirelli, Cuzin-Roudy, Fielding, Groeneveld, Haraldsson, Lombana, Marschoff, Meyer, Pakhomov, Rombolá, Schimdt, Siegel, Teschke, Tonkes, Toullec, Trathan, Tremblay, van De Putte, van Franeker and Werner2012). Myctophid fish provide one such alternative trophic pathway for some predators (Collins et al. Reference Collins, Xavier, Johnston, North, Enderlein, Tarling, Waluda, Hawker and Cunningham2008). Myctophids are key members of mesopelagic communities in the Southern Ocean, being represented by approximately 35 species in 12 genera (Hulley Reference Hulley1990). They comprise a significant component of many top predators diets, including fur seals and some penguin species (Green et al. Reference Green, Williams and Green1998, Reid et al. Reference Reid, Davis and Staniland2006). However, some predators are prey specialists and for these species it is density of their key dietary species, and not diet composition, that determines their breeding success. How flexible individual species actually are with respect to shifting to new prey when favoured prey species become less abundant is difficult to assess a priori (see Rombolá et al. Reference Rombolá, Marschoff and Coria2010).
Chinstrap Pygoscelis antarctica Forster and macaroni Eudyptes chrysolophus (Brandt) penguins breed synchronously during the summer at Bouvetøya. This sub-Antarctic island in the mid-South Atlantic is the only land mass in a huge sector of the Southern Ocean. Both penguin species, along with the world’s second largest population of Antarctic fur seals Arctocephalus gazella (Peters), have been monitored intermittently over the last two decades as part of the Convention for the Conservation of Antarctic Marine Living Resources’ (CCAMLR) Ecosystem Monitoring Programme (CEMP), at Nyrøysa, a beach site on the west side of Bouvetøya. The diet, foraging behaviour and demography of the fur seals have been reported previously (Hofmeyr et al. Reference Hofmeyr, Krafft, Kirkman, Bester, Lydersen and Kovacs2005, Reference Hofmeyr, Bester, Kirkman, Lydersen and Kovacs2010, Biuw et al. Reference Biuw, Krafft, Hofmeyr, Lydersen and Kovacs2009, Blanchet et al. Reference Blanchet, Biuw, Hofmeyr, De Bruyn, Lydersen and Kovacs2013). Here, we report the diet, breeding performance and population size of macaroni and chinstrap penguins during four summer seasons over a period of two decades at this site.
Materials and methods
This study was conducted at Nyrøysa, a platform of land on the west side of Bouvetøya (54°25'S, 3°20'E), during the 1996/97, 1998/99, 2000/01 and 2007/08 summer seasons. Data on diet (via prey brought back to chicks) and reproductive performance (number of breeding pairs, breeding success) during the chick-rearing period were collected during each season. CEMP Standard Methods (CCAMLR 2007) were followed throughout the study whenever possible; exceptions due to arrival or departure times to or from the island, or small population size issues are noted below.
Diet sampling
CEMP methods require the collection of complete stomach contents (excluding birds with empty stomachs) from five breeding adult penguins, sampled every fifth day by stomach lavage. However, following penguins back to their nest site and catching them there caused stress for the targeted birds and neighbouring nests. So this practice was discontinued from 20 January 2001 for macaroni penguins and the chick confirming procedure was not done at all for chinstrap penguins due to concern about the small total population size of this species at Nyrøysa. The alternative procedure of stomach pumping the bird first, and then following it to the nest site was not attempted either due to the skittish nature of the birds after handling. So diet samples were obtained from adult birds of unknown breeding status for the time periods noted above; all samples were collected between 18h00 and 22h00 local time (GMT+1) from two chinstrap adults and five or six macaroni penguin adults during the chick rearing period (mid-January to February) following Wilson (Reference Wilson1984). All samples were drained of excess fluid and preserved in 96% ethanol, or frozen if significant quantities of fish remains were present. Samples were returned to the laboratory for analysis, where they were thawed, drained and weighed (wet mass). Each sample was first sorted into crustacean, fish and squid components. Fish otoliths were separated from all diet samples and used to identify fish species.
Owing to prey differences between the two penguin species the analytical methodology used for each differed slightly. For the chinstrap penguin samples, all Antarctic krill were counted and for specimens in good condition carapace lengths were measured using Vernier callipers. These measurements were used to derive total length (AT), using the appropriate regression model in Hill (Reference Hulley1990). Each sample was carefully checked for the presence of other crustacean, fish or cephalopod species. Macaroni penguin samples were sorted into crustacean, fish and cephalopod components. Antarctic krill in good condition were measured (carapace length, converted to total length as above), but there were few specimens that were whole, most were too digested. Fish and cephalopods were identified to the lowest possible taxon (usually species) based on their otoliths and lower beaks, respectively.
Diet indices commonly used in feeding studies were calculated including: i) frequency of occurrence ((FO)=FOi (%)=(Si/St) × 100, where Si is the number of samples with prey type i, and St is the total number of samples), ii) the relative frequency (Ni), which is the numeric proportion of each prey type in the diet=Ni (%)=(ni/nt) × 100, where ni is the total number of prey type i, and nt is the total number of prey, and iii) % of total mass (%M) of each sample represented by each prey group.
To determine whether there were seasonal and annual trends in how much food penguin parents brought back to the colony through the breeding season and between years, the mean mass ± standard deviation (SD) of Antarctic krill, and in the case of macaroni penguins also fish and all prey species, were obtained from stomach contents. In 2008, chinstrap diets were not sampled because of the small total number of birds at Nyrøysa, so no dietary data were available for this year for this species. Additionally, the late season diet sample was not collected for macaroni penguins either in 2008, because of an early departure from the island. For analysis of seasonal trends generalized linear models (GLM) were run using the quasipoisson family because the data were over dispersed. Significance was determined using F tests (t-values and associated P values). The GLMs were also used to investigate whether mass of Antarctic krill, fish and all prey species differed interannually for each penguin species by testing the specific prey item stomach contents’ mass between sampling years. To obtain normality of residuals ‘Antarctic krill chinstrap’, ‘all prey chinstrap’, ‘fish macaroni’ and ‘all prey macaroni’ were square-root transformed, while ‘Antarctic krill macaroni’ was log transformed. Tukey HSD post hoc tests were performed to establish whether differences between sampling years for each prey item were significant. All analyses were conducted in the statistical package R 3.1.1 (R Core Team Reference R Core2014).
Breeding population size and success
Population numbers are based on counts of incubating adults and adults occupying nests without eggs; loafers (birds present but not attending a nest) were not included. For the censuses, the breeding colonies of chinstrap and macaroni penguins at Nyrøysa were sectioned into 25 separate plots. Small aluminium plates weighted with stones were used to mark the borders between the plots. Plots were counted and photographed with a 35 mm camera, and a Polaroid camera, to double-check count numbers made in the field. Following CEMP Standard Methods, counts of the total number of adult birds were conducted three times from the periphery of the colony. However, our timing deviated somewhat from CEMP Standard Methods, which dictate that counting be performed one week after peak egg-laying. This was not possible due to the late arrival of the expedition team on the island in 1996/97, 1998/99 and 2000/01, well after peak egg-laying. Although the team arrived earlier in 2007/08, this expedition did the counts at dates matching the censuses of the previous years for the sake of comparability across years at this site. So, all of our population counts of adult birds were done in December. Following the CEMP procedures, birds that appeared to be incubating were not disturbed to verify the nest contents. For breeding success, counts of the total number of chicks at Nyrøysa were made in February. In a similar to fashion the population size estimates, at least three separate counts were made for each plot when counting the chicks.
Results
Diet composition
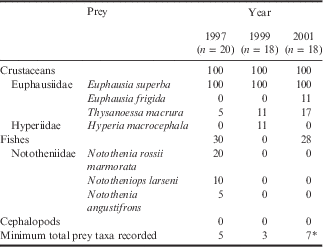
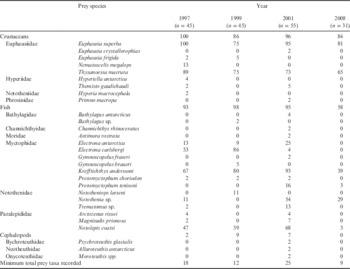
A total of 56 and 176 diet samples were collected from chinstrap penguins and macaroni penguins, respectively, during the study period. A minimum of seven prey species were identified in chinstrap penguin diet samples, while at least 29 species were identified in macaroni penguin diet samples across all sampling years (excluding unidentified species; see Tables I & II).
Frequency of occurrence (%) of prey species in chinstrap penguin diet samples, from Bouvetøya during the chick-rearing period, in 1997 (5 January–19 February), 1999 and 2001 (10 January–19 February). Sample sizes are given in parentheses.
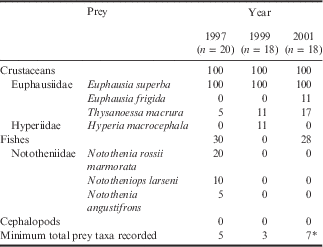
*This includes 2 unidentified fish species and 2 unidentified crustacean species.
Frequency of occurrence (%) of prey species in macaroni penguin diet samples, from Bouvetøya during the chick-rearing period, 1997, 1999, 2001 (all 10 January–19 February) and 2008 (10 January–4 February). Sample sizes are given in parentheses.

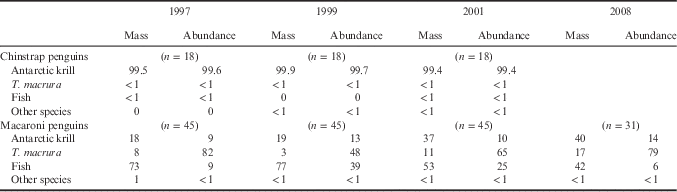
The diet of chinstrap penguins was almost exclusively Antarctic krill with a FO of 100% for this prey species (Table I), which represented 99.6% of the diet by mass, while fish (<1%) and other euphausiids (<1%) were found in only trace amounts (Table III). Thysanoessa macrura Sars were present in every sampling year and FO increased from 5% to 17% over the study period (Table I). However, this species contributed <1% of the diet by numerical abundance and also by mass in each year of the study (Table III). Fishes, consisting mostly of the family Notothenidae (cod ice-fish), had a FO of 30% in 1997 and 28% in 2001 (Table I). However, this prey group also contributed <1% by numerical abundance and by mass in all three sampling years (Table III). Other prey types occurred in very small numbers and amounts (Tables I & III).
Total mass (%) and numerical abundances (%) for Antarctic krill, Thysanoessa macrura, fish and other species including crustacean and cephalopod prey species found in the diets of chinstrap and macaroni penguins at Bouvetøya sampled in 1997, 1999, 2001 and 2008. Sample sizes are indicated in parentheses.
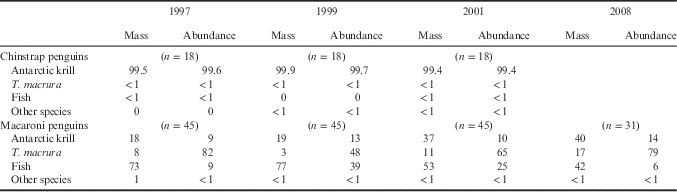
For macaroni penguins, diet composition was much more varied than for the chinstraps. Euphausiids, mostly E. superba and T. macrura, were the most frequently consumed prey (FO) in three of the four sampling years, with 1999 being the exception, when the FO of fish was highest (Table II). Numerically, T. macrura was the most frequently consumed prey species in the macaroni penguin diet in every sampling year (on average 69%), followed by a variety of fish species (17%) and Antarctic krill (12%; Table III). However, fish comprised the largest component of the diet by mass in all four sampling years (1997: 73%, 1999: 77%, 2001: 53%; 2008: 42%; Table III). Amphipods and cephalopods occurred in small numbers and amounts in most years (Table II & III).
Fish remains occurred in 86% of the macaroni penguin samples. Krefftichthys anderssoni (Lönnberg) had the highest FO (mean of 70% for all years, Table II) and was the most numerous fish prey type (mean of 81% for all years). Electrona carlsbergi Taning, Notolepis coatsi Dollo and Notothenia sp. were also present in the diet in some years (see Table II). Electrona carlsbergi was the most frequently found prey in the diet samples in 1999, but was absent in 2008. Gymnoscopelus braueri (Lönnberg), Nototheniops larseni (Lönnberg), and Bathylagus sp. were only recorded in 1999. For 11 out of the 17 fish categories, FOs were highest in 2001, with four of these species (Antimora rostrate (Günther), Bathylagus antarcticus (Günther), Channichthys rhinoceratus Richardson, and Gymnoscopelus fraseri (Fraser-Brunner)) only being found in the diet samples from that year (Table II).
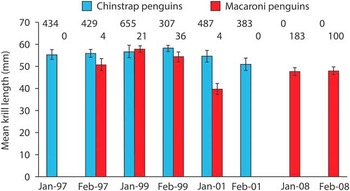
Antarctic krill consumed by chinstrap penguins were mainly large specimens in all sampling years (>50 mm, Fig. 1). Antarctic krill consumed by macaroni penguins were more variable in size between years, though it must be noted that sample sizes for krill length from macaroni penguin samples are small and also variable from year to year. For 1997 and 1999 the mean Antarctic krill size for macaroni penguins was similar to that consumed by the chinstrap penguins (>50 mm), while for 2001 the Antarctic krill eaten by macaroni penguins were smaller, averaging only 39 mm (Fig. 1). In 2008, the average size of Antarctic krill in macaroni penguin samples was 48 mm (no chinstrap samples are available for comparison in this final year of the study period) (Fig. 1).
Mean length (mm) ± SD of krill consumed by chinstrap and macaroni penguins in January and February for all four sampling years (1997, 1999, 2001 and 2008). Numbers at the top represent sample sizes (top row for chinstrap penguins, bottom row for macaroni penguins).

For chinstrap penguins, only the 1999 season (t=1.89, P<0.1) showed significant differences across the season for prey brought back to the colony (only “all prey” were examined because of the extreme dominance of Antarctic krill). This was in contrast to the situation for macaroni penguins, where the amount of Antarctic krill brought back to the colony by parent birds did vary seasonally during three of the four years of the study (1997: t=3.49, P<0.01; 1999: t=2.17, P<0.05; 2001: t=3.57; P<0.001). In these three seasons the birds brought back more krill to their chicks as the season progressed. Fish showed no seasonal trends (P>0.1) in any of the sampling years, while only the 2001 season showed significant differences for all prey species combined (t=1.77, P<0.1).
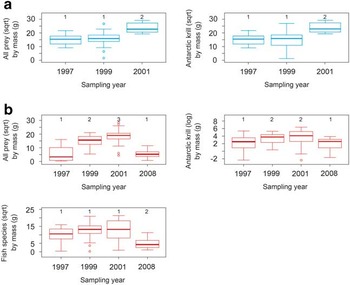
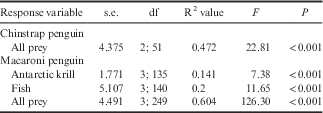
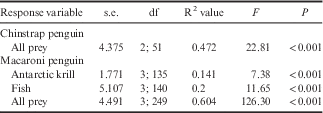
Interannual differences were significant for all prey groupings tested for both penguin species for all sampling periods (Tables IV & V). For chinstrap penguins, the Tukey test showed that mass of all prey species and that of Antarctic krill were similar between 1997 and 1999, but both of these years differed from 2001 (P<0.001) (Fig. 2a). Results of the Tukey test for macaroni penguins showed more variation in prey mass between years. Mass of all prey groups were significantly different between 1997–99, 1997–2001, 1999–2008, 2001–08 (P<0.001) and 1999–2001 (P<0.01; Fig. 2b). For Antarctic krill mass, the sampling years 1997–99, 1999–2008 (P<0.05), 1997–2008 (P<0.001) and 2001–08 (P<0.01) showed significant differences (Fig. 2b). Fish mass differed between 1997–2008 (P<0.01), 1999–2008 and 2001–08 (P<0.001; Fig. 2b). The 2001 season stood out as a food rich year, showing the highest values for masses of krill and fish consumed by the penguins (see Table IV and Fig. 2).
Box plots comparing interannual patterns of prey consumption (median showing min. and max. range) for a. chinstrap penguin stomach contents, showing all prey species and Antarctic krill (main prey item) between three sampling years (1997, 1999 and 2001), and b. macaroni penguin stomach contents showing all prey species, Antarctic krill and fish species between four sampling years (1997, 1999, 2001 and 2008). Tukey HSD test results indicated as numbers above columns. Means not sharing the same number are significantly different.

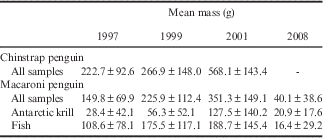
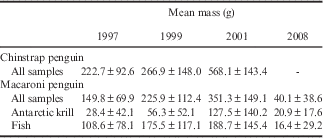
Mean sample mass (g), mean mass of Antarctic krill (g) and mean mass of fish (g) ± SD for all diet samples of chinstrap and macaroni penguins at Nyrøysa, Bouvetøya, for 1997, 1999, 2001 and 2008. For chinstrap penguins, only total diet is shown because Antarctic krill dominate the diet.
Interannual comparisons, using generalized linear models, of the mass of Antarctic krill, fish and all prey species in the stomach contents of chinstrap (1997, 1999 and 2001) and macaroni penguins (1997, 1999, 2001 and 2008). For chinstrap penguin, only all prey values are shown because Antarctic krill heavily dominate the diet.
Breeding population size and breeding success
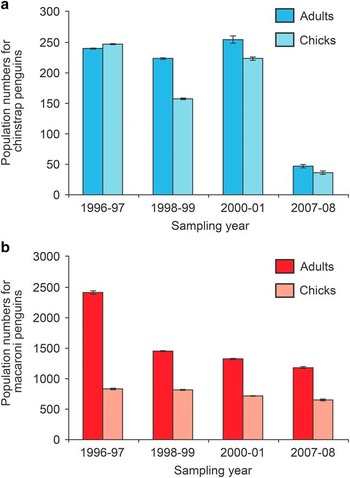
Counts of chinstrap penguins incubating or occupying nests remained fairly constant from 1996 to 2000 but dropped abruptly between 2000 and 2007 (by 81%; Fig. 3a). Chick counts varied between 247 and 157 in the first three seasons and subsequently declined markedly, by 84%, from 2001 to 2008 (Fig. 3a).
Counts of adult penguins incubating or occupying nest sites, and chicks at Nyrøysa, Bouvetøya, during the summers of 1996–97, 1998–99, 2000–01 and 2007–08 (mean ± SD) for a. chinstrap penguins, and b. macaroni penguins.

The number of macaroni penguins incubating or occupying nests dropped precipitously between 1997 and 1999 (40%), and has continued a steady decline at a slower rate, from 1999 to 2008 (11%). Macaroni chick numbers dropped from 824 to 656 over the study period, an overall reduction of 21% (Fig. 3b).
Discussion
Antarctic krill dominated the diet of chinstrap penguins in all four sampling years at Nyrøysa. This situation is similar to other localities in the Southern Ocean, including the South Orkney Islands and the South Shetland Islands (see Ratcliffe & Trathan Reference Ratcliffe and Trathan2012). However, fish is sometimes also recorded in the diet of this species, and in some years in some places fish can be important prey (see Jansen et al. Reference Jansen, Boveng and Bengtson1998, Rombolá et al. Reference Rombolá, Marschoff and Coria2010). Cephalopods, if found, usually make up a small proportion of chinstrap penguins’ diet, but they were completely absent from the diet of chinstrap penguins at Bouvetøya, similar to the situation noted for the South Orkney Islands and for Seal Island (Ratcliffe & Trathan Reference Ratcliffe and Trathan2012).
Macaroni penguins are known to feed on a wide range of crustaceans, fish and cephalopods, though in some parts of their range crustacean prey dominate the diet, comprising in some cases more than 90% of the mass of food consumed (Ratcliffe & Trathan Reference Ratcliffe and Trathan2012). Fish constituted more than 50% of the diet by mass in three of the four years of this study, similar to some years at Marion Island to the east of Bouvetøya (see Ratcliffe & Trathan Reference Ratcliffe and Trathan2012). However, in one of the four years of this study two species of krill made up more than 60% of the diet by mass, similar to findings from South Georgia, Heard Island and, in some years, also Marion Island (Ratcliffe & Trathan Reference Ratcliffe and Trathan2012).
Thysanoessa macrura is often abundant in the diet of macaroni penguins, although this krill species seems to show marked interannual differences as a dietary component in penguins, shifting between being the dominant crustacean consumed to not being recorded at all in other sampling years (Ratcliffe & Trathan Reference Ratcliffe and Trathan2012). At Heard Island, euphausiids made up the largest component of stomach contents of macaroni penguins by mass (69%) with T. macrura being one of the two dominant krill species (Deagle et al. Reference Deagle, Gales, Evans, Jarman, Robinson, Trebilco and Hindell2007). Thus, in the absence of, or during shortages of E. superba, T. macrura could play a vital part in the diet of macaroni penguins at Bouvetøya. This seems to be an unlikely option for chinstrap penguins, which seem to be Antarctic krill specialists at this site, although the presence of T. macrura did increase over the three years of diet sampling in this study from 5% to 17% in terms of FO for chinstrap penguins.
Two new records of euphausiid species in the waters near Bouvetøya were registered via the diet samples from macaroni penguins in this study, namely Nematoscelis megalops Sars and Euphausia crystallorophias Holt & Tattersall. The high prevalence of the fish K. anderssoni in the diet of macaroni penguins at Bouvetøya in all four years of this study suggests that dense schools of this species must occur frequently relatively close to the island during summer (also see Duhamel et al. Reference Duhamel, Koubbi and Ravier2000). This fish species is also a common prey type for macaroni penguins at Heard Island and Marion Island (Ratcliffe & Trathan Reference Ratcliffe and Trathan2012). All fish species identified in the diet of macaroni penguins at Bouvetøya belong to six families, including at least 17 species. Electrona carlsbergi, Notolepis coatsi, and Notothenia sp. were the most abundant. Electrona carlsbergi was considered to be the most common myctophid south of the Antarctic Polar Front before the start of the new millennium (Hulley Reference Hulley1990), but it has perhaps declined recently; it used to be common in Japanese trawl by-catch samples from the area north and north-west of South Georgia, but has not been found in these samples since 2005 (Iwami et al. Reference Iwami, Naganobu, Taki and Kiyota2011). Similarly, it has declined markedly in the diet samples from macaroni penguins at Bouvetøya, disappearing completely in the 2008 season. Notothenids were the only fishes found in the diet of both penguin species in this study; they were the only fish recorded in the chinstrap penguin diet.
The mean mass of stomach contents of chinstrap penguins at Bouvetøya (1999: 267±148, 2001: 568±143) was more variable compared to the same sampling years at Laurie Island, South Orkney Islands (1999: 320±110, 2001: 340±200; Rombolá et al. Reference Rombolá, Marschoff and Coria2010). The mean mass of diet samples collected from macaroni penguins from 1996–2001 (241.8±86.8 g) in the current study is, however, somewhat lower than that reported for this species from South Georgia (346±214 g; Waluda et al. Reference Waluda, Hill, Peat and Trathan2012). Sample sizes might play a role in these differences, as our study is somewhat limited in this regard compared to sites that operate large monitoring programmes on an annual basis.
Chinstrap parents appeared to find sufficient Antarctic krill throughout the breeding season, with no apparent seasonal trends in the amount of krill brought back to the colony; the large proportion of two-chick clutches among those birds that bred also suggests that they are not experiencing shortages in food (see Blanchet et al. Reference Blanchet, Biuw, Hofmeyr, De Bruyn, Lydersen and Kovacs2013). The birds ate predominantly large specimens of krill. But, our small sample sizes for collections from this penguin species limit our ability to generalize about interannual and seasonal patterns. Antarctic krill in the macaroni penguin diet did show intra-annual, seasonal variation, with small amounts of Antarctic krill in the diet early in the breeding period that increased progressively through the season in all years of sampling. All prey items by mass and fish mass, in the diet of macaroni penguins was somewhat more variable from period to period within years though in most cases the largest amounts of prey were registered late in the breeding season. Size of Antarctic krill eaten by macaroni penguins might be somewhat more variable than for the chinstrap penguins, with some smaller specimens consumed. But, here again, sample sizes for Antarctic krill measurements were very limited in some sampling years because the krill were too digested to measure size in the macaroni penguin samples.
Both penguin species have declined in abundance at Nyrøysa over the period of this study. The number of nest-attending macaroni penguins declined steeply between the 1996/97 and 1998/99 seasons, when numbers dropped from c. 2400 to just 1500 in this two year period. In this same period and until 2001, chinstrap penguin numbers remained fairly constant (~240 adult birds at incubated and occupied nests). However, chinstrap penguin numbers declined markedly sometime between 2000/01 and 2007/08 to less than 50 attended nests. Reports of the numbers of penguins breeding at Nyrøysa from the 1970s and 1980s, prior to its designation as a CEMP site, support the general pattern observed during the study period, with dramatic declines of chinstrap penguins and a more moderate decline of macaroni penguins (Haftorn et al. Reference Haftorn, Somme and Gray1981, Bakken Reference Bakken1991) although different census methods prohibit direct comparisons with these earlier counts.
Decreases in some populations of both of these penguin species have taken place across their ranges recently. A general decline in the population of chinstrap penguins has been observed at the South Shetland Islands (Sander et al. Reference Sander, Balbao, Polito, Costa and Carneiro2007, Barbosa et al. Reference Barbosa, Benzal, De Leon and Moreno2012) and South Orkney Islands (Forcada et al. Reference Forcada, Trathan, Reid, Murphy and Croxall2006). At Marion Island the numbers of macaroni penguins decreased by about 30% between 1994–95 and 2008–09 (Crawford et al. Reference Crawford, Whittington, Upfold, Ryan, Petersen, Dyer and Cooper2009). But, the most extreme declines of a macaroni penguin population have occurred at South Georgia; in the 1970s, macaroni penguins numbered c. 5.4 million pairs at South Georgia (Croxall & Prince Reference Croxall and Prince1979) while recent data suggest that only about 1 million breeding pairs remain (Trathan et al. Reference Trathan, Ratcliffe and Masden2012).
The declines observed in the penguin colonies at Nyrøysa could theoretically be due to food limitations via competition with other krill predators or a general lack of prey availability induced through physical alterations of the environment. But, we have no direct assessments of prey population sizes in the ocean areas around Bouvetøya that cover the study period. The waters surrounding Bouvetøya are known to be productive, at least in the few years for which there are data, and the region currently experiences little anthropogenic disturbance (e.g. Krafft et al. Reference Krafft, Melle, Knutsen, Bagøien, Broms, Ellerertsen and Siegel2010). Indirect evidence, via penguin diets, particularly the macaroni penguins’ diet, over the years of this study suggests that shifting oceanographic conditions have induced some variation in fish and krill abundance or at least have affected the foraging behaviour of these birds in the vicinity of the island. Some fish in the diet of chinstrap penguins in some seasons may indicate krill scarcity, but the fact that two-chick broods have been the norm at Bouvetøya for this penguin species suggests that breeding birds are finding enough food (Blanchet et al. Reference Blanchet, Biuw, Hofmeyr, De Bruyn, Lydersen and Kovacs2013).
Chinstrap penguins are likely to be more sensitive to changes in krill availability compared to macaroni penguins because their foraging range is quite limited (Blanchet et al. Reference Blanchet, Biuw, Hofmeyr, De Bruyn, Lydersen and Kovacs2013) and they target krill preferentially (this study). But, this species is quite mobile (Biuw et al. Reference Biuw, Lydersen, De Bruyn, Arriola, Hofmeyr, Kritzinger and Kovacs2010) and shows little population differentiation (Korczak-Abshire et al. Reference Korczak-Abshire, Chwedorzewska, Wasowicz and Bednarek2012), suggesting that regular exchange between colonies probably occurs. Macaroni penguins seem to prey switch more readily (Krafft et al. Reference Krafft, Hofmeyr, Keith, Harck and Kovacs2002, Waluda et al. Reference Waluda, Collins, Black, Staniland and Trathan2010, Ratcliffe & Trathan Reference Ratcliffe and Trathan2012) than chinstraps, and their ability to travel further and dive deeper increases their potential foraging area (Blanchet et al. Reference Blanchet, Biuw, Hofmeyr, De Bruyn, Lydersen and Kovacs2013) and enables them to exploit a larger portion of the water column (Deagle et al. Reference Deagle, Gales and Hindell2008, Blanchet et al. Reference Blanchet, Biuw, Hofmeyr, De Bruyn, Lydersen and Kovacs2013) compared to chinstrap penguins. The 1997/98 El Niño-Southern Oscillation (ENSO) event in the Scotia Sea in western Antarctica directly affected both macaroni and southern rockhopper penguins Eudyptes chrysocome (Forster) breeding as far east as Marion Island in the Indian Ocean (Crawford et al. Reference Crawford, Whittington, Upfold, Ryan, Petersen, Dyer and Cooper2009). This event might have also affected both penguin species at Nyrøysa; it was the year that had the smallest stomach content masses. But, it is likely that the cause of the declines in both penguin populations at Nyrøysa is the lack of breeding space caused by landslides and onshore interspecific competition for breeding space with the large Antarctic fur seal colony at this location which expanded rapidly up until around 2000 (Hofmeyr et al. Reference Hofmeyr, Bester, Kirkman, Lydersen and Kovacs2010) and now covers almost all of the available beach, pushing the penguins into small, steeply sloping or rough areas. There have been a number of observations of breeding penguins being displaced or attacked by Antarctic fur seals at Bouvetøya, and a number of dead and wounded penguins with seal bites have been found, but observer effort is too low to provide clarity as to importance of this source of mortality (e.g. Krafft et al. Reference Krafft, Hofmeyr, Keith, Harck and Kovacs2002). Increased levels of predation by seals on penguins and other seabirds have been documented at several sites in the Southern Ocean recently. For example, at Marion Island the frequency of attacks by seals is increasing; in 2008/09 39% of these attacks proved to be fatal (Makhado et al. 2009). This trend is concomitant with a rapid increase in the fur seal population at Marion Island (Hofmeyr et al. Reference Hofmeyr, Bester, Makhado and Pistorius2006). The recovery of Antarctic fur seals and krill-eating whale populations are thought to be the major cause of penguin declines at South Georgia (Trathan et al. Reference Trathan, Ratcliffe and Masden2012). But at Nyrøysa spatial displacement is probably the major issue. Bouvetøya has the second largest Antarctic fur seal population in the world with an estimated 66 000 individuals on the beach at Nyrøsa alone (Hofmeyr et al. Reference Hofmeyr, Krafft, Kirkman, Bester, Lydersen and Kovacs2005). This colony has increased exponentially since 1979, creating intense inter-specific competition for space on land for the penguins.
Landslides have also directly affected colony numbers for both penguin species to some extent, physically displacing individuals and in some instances killing birds. Chinstrap penguins breed particularly close to the cliff edges at Nyrøysa, which has probably resulted in more severe nesting habitat losses.
In summary, this study presents the first interannual diet composition comparisons for the two resident penguin species at Nyrøysa, Bouvetøya. Although there was considerable variation in the food brought back to the colony by macaroni penguins from year to year, chinstrap penguins depended very heavily on Antarctic krill during all years of the study. It is not known whether the declining population trends for the penguins at Nyrøysa are representative of other sites at Bouvetøya. But the declining trends are consistent with patterns exhibited by these two species at several other islands, including breeding colonies in the Scotia Sea and are probably representative of large-scale ocean changes. Currently, food appears to be readily available to both penguin species in most years, but if climate warming over the coming decades does cause declines in Antarctic krill abundance or major shifts in krill distribution, the situation for the penguins on Bouvetøya might be further complicated by increased competitive stress on the remaining food resources that are available within travelling distance of the land-based colony sites.
Acknowledgements
This study was funded by the Norwegian Polar Institute, the Norwegian Antarctic Research Expeditions (NARE), and The Norwegian Agency for Development Cooperation (NORAD). Logistic support was provided by the South African National Antarctic Program (SANAP). This project involved scientific co-operation between the Norwegian Polar Institute, the FitzPatrick Institute of African Ornithology (University of Cape Town) and the Mammal Research Institute of the University of Pretoria. We thank A. Arriola, V. Bakken, M.N. Bester, M. Biuw, J. Cooper, I. Gjertz, B.I.B. Harck, D. Keith, B. Krafft, P. Kritzinger, and P. Ryan for their support in planning or conducting the fieldwork. We also thank the captain/s and crew of the SA Agulhas (and the South African Department of Environmental Affairs, DEA), and RV Polar Queen for logistical support and transport to and from the island. We also thank Drs Norman Ratcliffe and Emilce Rombolá who provided comments that helped us improve the manuscript.
Author contribution
Mr Niemandt led the statistical analyses and drafting of the manuscript with all authors contributing to formulation of the study and the writing and revision work on the manuscript. Drs Hofmeyr and deBruyn and Mr Isaksen and Mr Dyer participated in field work. Mr Dyer led the dietary analyses in the laboratory. Drs Kovacs, Lydersen and Mehlum held the NARE grants that financed the work at Bouvetøya.