I. INTRODUCTION
Overdevelopment and increasingly extreme climate conditions have wrought havoc on many nations across the world in the past year. Nowadays, public concern about the environment, climate change, and limited fossil fuel resources have given rise to the urgent need of fostering development in the area of renewable energies, which are inexhaustible and nonpolluting.Reference Ohi1–Reference Kitano, Matsuoka, Ueshima and Anpo4 The production of hydrogen gas is one of the most promising prospects for efficient renewable resources.Reference Takahashi, Uno, Okui and Yamanaka5–Reference Mor, Carvalho, Varghese, Pishko and Grimes7 To bring hydrogen to the point of commercial readiness and viability in terms of performance and cost, substantial research on the development of n-type semiconductor for water splitting process using solar energy is necessary.Reference Zhang, Hossain and Takahashi8, Reference Fernandez-Garcia, Martinez-Arias, Fuerte and Conesa9
For the past two decades, various wide band gap oxide semiconductors (TiO2, WO3, ZnO, SrTiO3, etc.) and nonoxide semiconductors (Si, InP, CdTe, GaAs, etc.) have been identified as attractive materials for stable and highly efficient renewable energy devices.Reference Mor, Carvalho, Varghese, Pishko and Grimes7, Reference Marsen, Miller, Paluselli and Rocheleau10–Reference Sajjad, Shamaila, Tian, Chen and Zhang12 Among these materials, TiO2 offers great promise for photoelectrochemical (PEC) applicationReference Cong, Zhang, Chen and Anpo13–Reference Parayil, Lee and Yoon16 because of its low cost, nontoxicity, high stability against photocorrosion, and ability to absorb light. It is perfectly suitable as a photoanode in PEC cell. However, TiO2 is still far from becoming a potential semiconductor for PEC cell. Despite its cost, making high efficient PEC cell using TiO2 as photoanode is challenging unless two important issues are addressed.Reference Fujishima, Zhang and Tryk18–Reference Ni, Leung, Leung and Sumathy21 The first issue involves the achievement of high photoconversion efficiency, which requires a suitable architecture that minimizes the recombination of the photogenerated electron–hole pairs by separating them quickly. This separation must take place before the electrons and holes lose their energy through recombination. Such architecture ought to have high surface area in contact with the electrolyte species. The second issue involves the larger band gap of TiO2 (3.0–3.2 eV). The lack of absorption in the visible spectrum (λ > 380 nm) and the low efficiency of water splitting are distinct hindrances for the widespread use of TiO2 as a photoanode.
Therefore, TiO2 can be further improved by engineering the dimension and morphology of TiO2 crystals through synthesizing process.Reference Yu and Chen3, Reference Cai, Paulose, Varghese and Grimes22, Reference Gong, Grimes and Varghese23 Nanoscale one-dimensional (1D) nanotubular TiO2 is currently attracting considerable interest because of its large surface area and high photon absorption. To resolve the above listed problems and make solar photocatalytic hydrogen production more feasible, continuous efforts have been conducted by doping with different types of transition metal cations, surface modification with noble metals, and doping with nonmetal anions.Reference Fujishima, Zhang and Tryk18, Reference Ni, Leung, Leung and Sumathy21, Reference Liu, Jaramillo, Kolmakov, Baeck, Moskovits, Stucky and McFarland24 To date, the microstructure modification of crystalline TiO2 nanotube by coupling the tungsten trioxide (WO3) has become important in improving PEC performance. WO3 has a suitable band gap energy of 2.8 eV and can absorb the light in the visible range.Reference Mor, Carvalho, Varghese, Pishko and Grimes7, Reference Higashimoto, Ushiroda and Azuma25 Under the band gap excitation of WO3 and TiO2, photoinduced electrons transfer to the conduction band of WO3, whereas holes transfer to the valence band of TiO2. Therefore, they play a significant role in maximizing the photocurrent generation efficiency to promote charge separation by the accumulation of electrons and holes in the mixed oxides system with suppression of charge recombination.Reference Higashimoto, Ushiroda and Azuma25–Reference Sajjad, Shamaiila, Tian, Chen and Zhang28
The present study fabricated W–TiO2 nanotubes through the radio frequency (RF) sputtering technique by controlling the sputtering power that shows enhanced PEC properties. To the best of our knowledge, reports on the effect of RF sputtering power on 1D nanotube arrays and its PEC water splitting performance are lacking. The present study aims to determine the optimum RF sputtering power to obtain the desired W–TiO2 nanotubes for the best PEC application.
II. EXPERIMENTAL PROCEDURE
Titanium (Ti) foils (99.6% purity) with thickness of 0.127 mm (STREM Chemicals, Newburyport, MA) were used in this study. Ti foils were cut into desired dimension (50 × 10 mm). Prior to anodization, the Ti foils were degreased by sonication in ethanol for 30 min. The foils were then rinsed in deionized water and dried with nitrogen stream. After drying, the Ti foil was placed in ethylene glycol with 5 wt% ammonium fluoride (NH4F) and 5 wt% hydrogen peroxide (H2O2). This composition was selected based on the preliminary studies that revealed it favored the formation of well-aligned TiO2 nanotube arrays.Reference Sreekantan, Lai and Lockman34 The electrolyte was used without any purification and the pH was kept constant at ∼7. Anodization was performed in a two-electrode bath with Ti foil as the anode and a platinum rod as the cathode. During the anodization, air bubble was blown in the electrolyte to maintain a uniform current near the Ti electrode. Anodization was done at a constant potential of 60 V with current density of 10 mA/cm2 by a Keithley dc power supply for 1 h. The anodized Ti foils were cleaned using distilled water and dried in a nitrogen stream.
For the preparation of hybrid W–TiO2 nanotubes, sputtering process was carried out by using RF sputtering machine Penta Vacuum. The target is W with dimension of 15.24 cm diameter and 6 mm thick. The target–substrate distance was fixed at 10 cm. Prior to sputtering, the vacuum chamber was evacuated to be lower than 1 × 10⁻⁵ Torr. The sputtering pressure was kept at 10−3 Torr. The flow rate of Argon was kept constant at 50 sccm. A high frequency generator was used generating electromagnetic power in the MHz region (13.56 MHz). The discharges were varied from 50, 100, 180, 200, and 250 W. Since W has a high melting point (3695 K), in order to facilitate efficient ejection of the sputtered W ions from the target, the minimum of RF sputtering power was fixed at 50 W in this experiment. The time of sputtering was 30 s. The time of 30 s was fixed based to our previous study, which showed higher PEC performance. The substrate was the anodized Ti. After the sputtering process, the foil was thermal annealed at 400 °C in argon atmosphere for 4 h.
The morphology of the anodized Ti foils was viewed by field emission scanning electron microscopy (FESEM), using a Zeiss SUPRA 35VP (Oberkochen, Germany) at a working distance of around 1 mm. To obtain the thickness of the anodic oxide formed, cross-sectional measurements were carried out on mechanically bent samples, where a partial liftoff of the anodic layer occurred. On top of that, the elemental analysis that is atomic percentage of the W incorporate into the TiO2 can be determined with energy dispersion x-ray (EDX), which is equipped in the FESEM. In order to confirm the presence of W throughout the length of nanotubes, cross-sectional EDX analysis was conducted. The cross-sectional EDX analysis was conducted by taking the average atomic percent (at%) of the W element from eight different spots along the mechanically bent nanotubes. Transmission electron microscopy (TEM) micrographs were obtained using a FEI CM 12 transmission microscope (Hillsboro, OR). Phase determination of the anodic layer was determined by x-ray diffraction (XRD) using a Philips PW 1729 (Amsterdam, Netherlands) operated at 45 kV and 40 mV in the 2 theta range of 20–90°. The surface morphology and the surface roughness were examined by automatic force microscopy (AFM; Agilent 5500, Santa Clara, CA).
The PEC properties of the samples were characterized using a three-electrode PEC cell with W–TiO2 nanotube arrays as the working photoelectrode, a platinum rod as a counter electrode, and a saturated calomel electrode as the reference electrode. A 1 M KOH solution with 1 wt% of ethyelene glycol was used as the electrolyte. All the three electrodes were connected to the potentiostat (Metrohm μAutolab III, Utrecht, Netherlands); the current and voltage were measured. A 150 W xenon lamp (Zolix LSP-X150, Beijing, China) with intensity of 800 W/m2 was used to produce a largely continuous and uniform spectrum; 100% of the light was transmitted by the quartz glass as the xenon lamp shone on the W–TiO2 nanotube arrays (photoanode). The xenon lamp was switched on after the three electrodes were connected to the potentiostat. A linear sweep potential was swept from −1.0 to 1.0 V at a scan rate of 5 mV/s. During the voltage sweeping, the corresponding photocurrent was measured. The photocurrent applied was plotted versus the potential. As for the dark condition, the xenon lamp was switched off.
III. RESULTS AND DISCUSSION
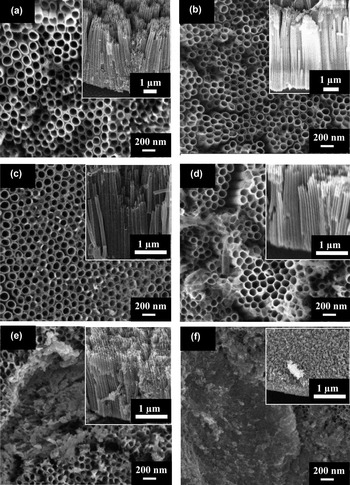
FESEM micrographs representing the pure TiO2 nanotubes and the effect of different RF sputtering powers on the W–TiO2 nanotube arrays are shown in Fig. 1. The FESEM image (top view) of the Ti anodized at 60 V in ethylene glycol containing 5 wt% of NH4F and 5 wt% of H2O2 for 1 h is shown in Fig. 1(a). The inset is the cross-section morphology of the nanotube arrays. Pore sizes with an average diameter of ≈90 nm, a length of ≈7 μm, and a wall thickness of ≈13 nm were achieved in this condition. This sample was duplicated, and the following experiment was conducted by varying the sputtering power from 50 to 250 W. Figures 1(b) and 1(c) clearly show that the morphologies of the W sputtered at 50 and 100 W are similar. That is, a clear opening without any aggregation of WO3 was found on the surface of the TiO2 nanotubes. At low RF power, the incident kinetic energy of W sputtered onto the TiO2 nanotubes was sufficient to incorporate W on TiO2 without any damage to the nanotube structure. However, as power increased to 180 W, the wall thickness of the TiO2 nanotube became larger [Fig. 1(d)]. The wall thickness of the nanotubes increased from ≈13 to 20 nm. This result is associated with the high number density of W loaded on the TiO2 nanotubes due to the higher transfer rate at 180 W. As a result, the number of nucleation site for WO3 formation increased, which led to the formation of thick nanotube walls. At 200 and 250 W of power, the nanotubes no longer supported themselves. This high RF sputtering power released a high kinetic energy of the W atoms, which collided intensively with the TiO2 nanotubes. Therefore, the nanotube arrays started to breakdown and formed shorter nanotube arrays at 200 W [Fig. 1(e)]. When power was further increased to 250 W, the length of nanotube arrays were shorter to approximately 500 nm and started to form a precipitate layer with a thick W layer which covering the short nanotube arrays [Fig. 1(f)].
FESEM top view image of different W sputtering powers for (a) pure TiO2 nanotubes, (b) 50 W, (c) 100 W, (d) 180 W, (e) 200 W, and (f) 250 W on the TiO2 nanotubes, inset image with cross sectional view.

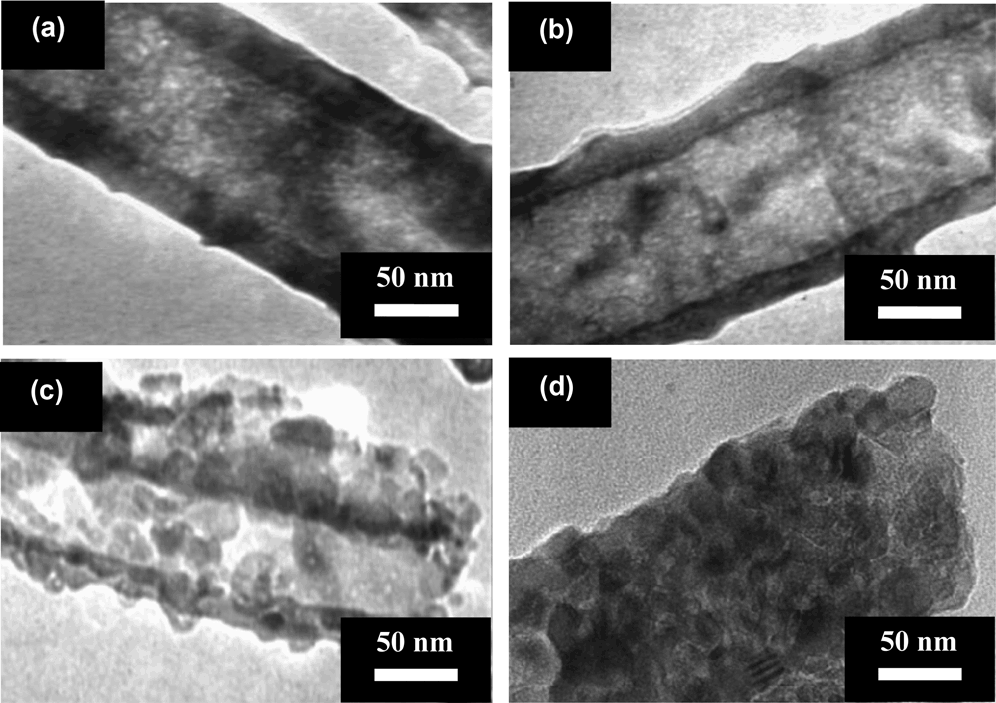
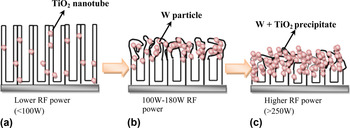
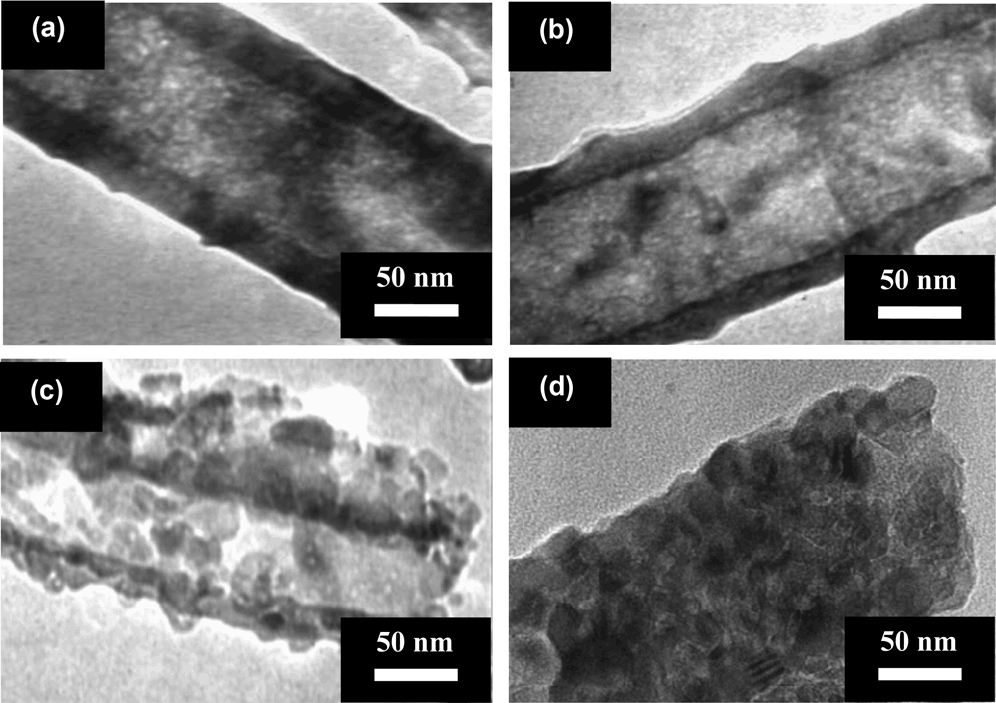
Subsequently, TEM images further confirmed the existence of the W atoms in TiO2 nanotubes and it was strongly dependent on the sputtering power [Figs. 2(a)–2(d)]. The TEM image shows that the pure TiO2 nanotube exhibited a hollow nature of tube opening [Fig. 2(a)]. Figure 2(b) shows the morphology of the W-sputtered TiO2 nanotube at 50 W is similar as the pure TiO2 nanotube. There was no obvious aggregation of W atoms was found on the surface of the TiO2 nanotube. The reason may be attributed to the W atoms are loaded into the bulk TiO2 lattice or located at the interstitial sites. When further increase of the sputtering power to 180 W, the high number density of W atoms loaded on the inner and outer surface of TiO2 nanotube as exhibited in Fig. 2(c). This will cause the number of nucleation site for WO3 formation increased, which led to the formation of rough, irregular, and corrugated nanotube surface. For the high sputtering power of 250 W, the pore entrance of the nanotubes is completely blocked by the W atoms as shown in Fig. 2(d). The W nuclei grow in size until they intergrow with each other to fill the nanotube completely and then form a continuous film covering the short nanotube arrays. These TEM results further confirmed the proposed mechanism regarding the effect of different RF sputtering powers on the TiO2 nanotubes as presented in Fig. 3.
TEM images of different W sputtering powers for (a) pure TiO2 nanotubes, (b) 50 W, (c) 180 W, and (d) 250 W on the TiO2 nanotubes.
Schematic illustration explaining the effect of different RF sputtering powers on the TiO2 nanotubes: (a) low RF power (< 100 W), (b) RF power between 100 and 180 W, and (c) high RF power (> 250 W).

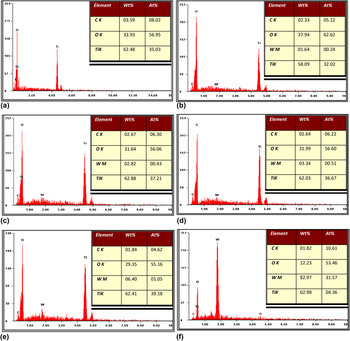
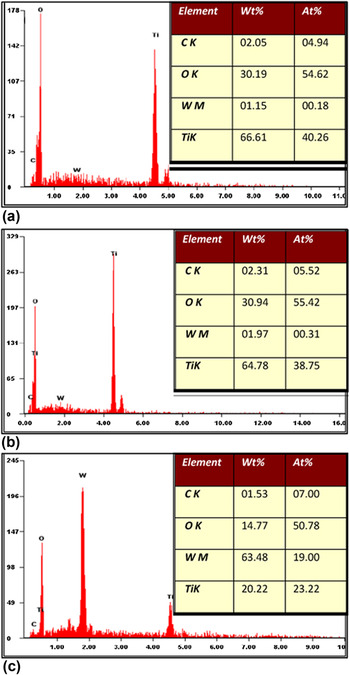
EDX analysis was conducted to determine the average atomic percent (at%) of the elements present in the W–TiO2 nanotubes with different RF sputtering powers. The results from EDX spectra are shown in Fig. 4. For the pure TiO2 nanotubes, the peaks of Ti, O, and C are clearly shown in Fig. 4(a), which indicate the existence of Ti, O, and C elements in the TiO2 nanotubes. For the W-sputtered TiO2 nanotubes with different sputtering powers, an additional spectrum of W was observed at 1.77 keV [Figs. 4(b)–4(f)]. The intensity of the W peak increased upon RF sputtering power corresponding to higher W content on the TiO2 nanotubes, as manifested by the increase in the at% of W. The at% of W were dramatically increased to 31.57 at 250 W, respectively. This result is in agreement with the FESEM, where the nanotube arrays were breakdown, and a thick layer of W was formed on the short nanotube arrays. Therefore, a high intensity of the W peak appeared in the EDX spectrum.
EDX spectrum of different W sputtering powers for (a) pure TiO2 nanotubes, (b) 50 W, (c) 100 W, (d) 180 W, (e) 200 W, and (f) 250 W on the TiO2 nanotubes.

In order to further verify the existence of the W throughout the nanotube arrays, selected samples have been carried out the cross-sectional EDX analysis. This analysis was conducted on mechanically bent samples, where the cross-sectional area of nanotube arrays was taken for elemental composition analysis. The results from EDX spectra are exhibited in Fig. 5. From the results obtained, it shows that the presence of W in the range of 0.18, 0.31, and 19.00 at% in the sample deposited W with sputtering power of 50, 180, and 250 W, respectively. It can be affirmed that the existence of the W dopants at the bottom and the wall of the nanotube arrays.
The EDX analysis of different W sputtering powers for (a) 50 W, (b) 180 W, and (c) 250 W on the cross sectional TiO2 nanotube arrays.

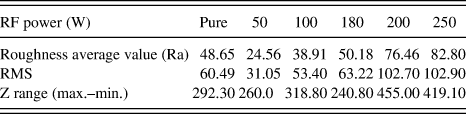
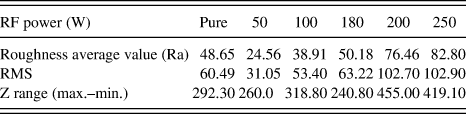
Representative AFM topographic maps show the morphologies of the pure TiO2 and W–TiO2 nanotubes under different deposition rates. Both FESEM and AFM results are in good agreement. This result is in line with the results shown in Table I. The average grain size increased with increasing deposition rate. Furthermore, the root mean square (RMS) roughness increased with increasing RF sputtering power and W particle dispersion.Reference Batista, Ribeiro, Carneiro and Teixeira35 By contrast, the W–TiO2 arrays with 50 and 100 W had lower roughness and grain size than the pure TiO2 nanotube arrays.
The role of posttreatment at 400 °C in argon atmosphere is to transform of the amorphous structure of TiO2 nanotube arrays into the crystalline anatase phase.Reference Lai and Sreekantan36–Reference Mor, Varghese, Paulose, Shankar and Grimes38 The amorphous TiO2 nanotube arrays have low degree of anatase crytallinity, which increases the number of recombination center for photogenerated charge carriers.Reference Mor, Varghese, Paulose, Shankar and Grimes38, Reference Mahajan, Misra, Raja and Mohapatra39 The reason attributed to the amorphous structure of TiO2 nanotube arrays comprises of various defects such as impurities, dangling bonds, and microvoids.Reference Mahajan, Misra, Raja and Mohapatra39–Reference Sun, Zhang, Sun and He41 The crystalline TiO2 structures offer unique advantages over amorphous structure by providing a direct and rapid transportation pathway for charge carriers by decreasing charge carriers path length and minimizing recombination losses.Reference Mor, Varghese, Paulose, Shankar and Grimes38, Reference Mahajan, Misra, Raja and Mohapatra39 In additions, many scientists have been reported that activity of anatase phase in photocatalytic reactions is found to be much higher due to its larger specific area and easy hydroxylation.Reference Sreekantan, Hazan and Lockman37–Reference Jaturong, Sarapong, Yoshikazu and Susumu43 Therefore, the crystalline anatase TiO2 phase was obtained by annealing the as-anodized sample at 400 °C in argon atmosphere.
Roughness parameters obtained via AFM for the pure TiO2 and W–TiO2 nanotubes using different RF sputtering powers.
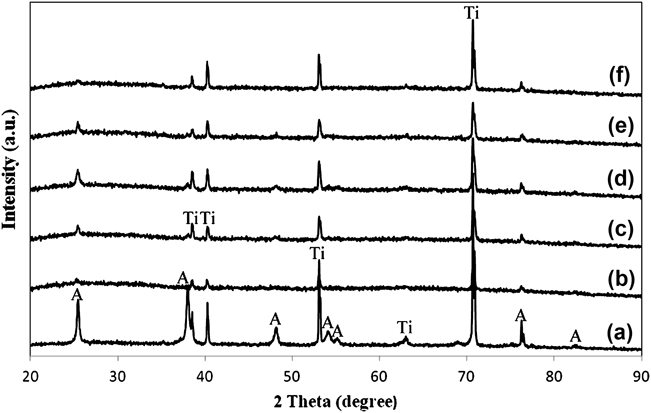
The XRD patterns of the pure TiO2 and W–TiO2 nanotubes as a function of deposition rate are shown in Fig. 6. All the samples showed the presence of anatase phase and Ti. Ti originated from the substrate. The obvious peaks were found at 25.37°, 38.67°, 48.21°, 54.10°, 55.26°, 70.46°, and 76.24°, corresponding to (101), (112), (200), (105), (211), (204), and (301) crystal planes for the anatase TiO2 nanotubes [Joint Committee on Powder Diffraction Standards (JCPDS) No. 21-1272]. The incorporation of W into the lattice of TiO2 clearly hindered the crystallization of TiO2, which decreased the peak intensity of the (101) peak at 25.3° for all the loaded TiO2.Reference Yang, Dai, Guo, Chen, Cao, Li, He and Fan44 The decrease in anatase phase might be due to the interruption of amorphous W atoms that diffused into the TiO2 lattice and inhibited the formation of anatase. The ionic radius of W6+ (0.074 nm) is nearly similar to Ti4+ (0.0745 nm) and thus, W atoms can easily diffuse into the TiO2 lattice at low W content.Reference Komornicki, Radecka and Sobas45, Reference Leghari, Sajjad, Chen and Zhang46
X-ray diffraction pattern of the TiO2 nanotubes sputtered with W at different sputtering powers: (a) Pure TiO2, (b) 50 W, (c) 100 W, (d) 180 W, (e) 200 W, and (f) 250 W [A= Anatase, Ti= Titanium].
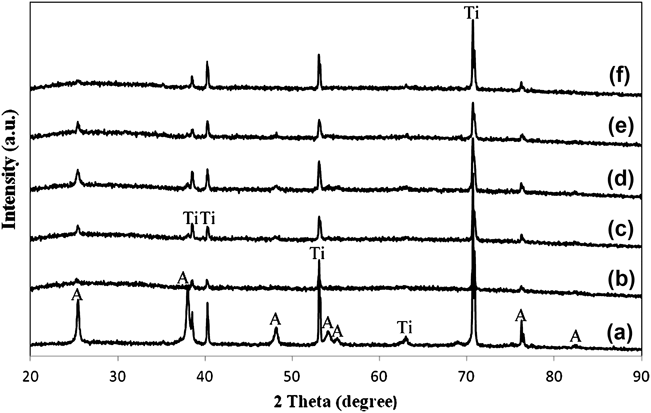
Interestingly, WO3 phases are not detected by XRD, even after sputtering at 250 W. This observation suggested that WO3 species are precipitated at the TiO2 grain boundaries still in an amorphous phase after posttreatment at 400 °C in argon atmosphere.Reference Gong, Yang, Pu and Zhang47, Reference Couselo, Einschlag, Candal and Jobbagy48 In fact, it was reported that only after 1000 °C can be segregation of crystalline WO3 could be observed from the XRD pattern.Reference Couselo, Einschlag, Candal and Jobbagy48 In addition, it is noteworthy to mention that Higashimoto et al. proposed that WO3/TiO2 photocatalyst having an amorphous-like WO3 phase leads to an effective charge separation in maximizing the photogenerated electrons generation.Reference Higashimoto, Ushiroda and Azuma25 Based on the results obtained, the charge neutrality in mixed W–Ti oxide nanostructures is mostly achieved by W occupying substitutional positions in the anatase structure in the presence of cation vacancies with simultaneous formation of a wolframyl (W=O) entity. This statement is in agreement with the works of Fernandez-Garcia et al.,Reference Fernandez-Garcia, Martinez-Arias, Fuerte and Conesa9 Kim et al.,Reference Kim, Yang, Balaji, Cho, Kim, Kang, Djaoued and Kwon49 and Marquez et al.,Reference Marquez, Plata, Ortega and Sanz50 which proposed detailed studies on the structural and electronic properties of mixed Ti–W oxides nanostructures.
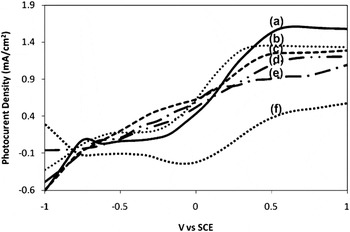
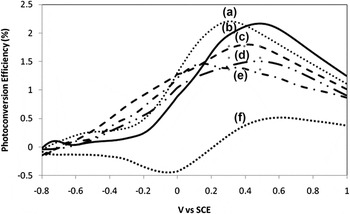
A scanning potentiostat was used to measure photocurrent under an applied potential. A photocurrent-potential plot for the different RF sputtering powers of the W–TiO2 nanotubes under illumination of 800 W/m2 is shown in Fig. 7. In dark condition, all the samples showed insignificant current (≈0 mA), whereas anodic photocurrents were observed under illumination on all the sample electrodes. As shown in Fig. 7, photocurrent density obviously decreased with increasing RF sputtering power. The RF sputtering power of 50 W showed the highest photocurrent density throughout the potential window. This result suggests that efficient charge separation took place. In addition, photocurrent reached a high value of 1.55 mA/cm2 compared with the pure TiO2 (1.05 mA/cm2). On the other hand, photocurrent density decreased to 1.35, 1.30, 1.20, and 0.55 mA/cm2 under the W sputtering powers of 100, 180, 200, and 250 W, respectively.
Photocurrent density vs. potential applied of the different RF sputtering powers of the W-TiO2 nanotubes in light condition, (a) 50 W, (b) 100 W, (c) 180 W, (d) 200 W, (e) Pure TiO2 nanotubes, and (f) 250 W.

The observed changes in the surface structure and morphology of the W–TiO2 nanotubes led to essential variations in the electrochemically active surface area. The incorporation of W at 50–100 W of sputtering powers on the TiO2 nanotubes induced a large surface area, where the photoinduced charge transfer by excitation separated electrons and holes effectively under light illumination. However, at 180 W of sputtering power, the electrochemically active surface area decreased owing to the accumulation of W on the TiO2 nanotubes and the enlargement of W crystallites. This condition resulted in a thicker wall thickness of nanotube arrays associated with the higher transfer rate of W on the TiO2 nanotubes. Therefore, the PEC response was reduced. At high RF sputtering power (200 and 250 W), the TiO2 nanotubes collapsed and eventually formed a precipitate-like layer [Figs. 1(e)–1(f)]. Consequently, the oxygen evolution at the TiO2–electrolyte interface was lowered, and the transfer of photogenerated electron–hole pairs on top of the precipitate layer was inhibited. This phenomenon further resulted in the lower ability for water splitting process. Based on these results, 50 W of RF sputtering power is the optimum power for the successful incorporation of W into the TiO2 lattice.
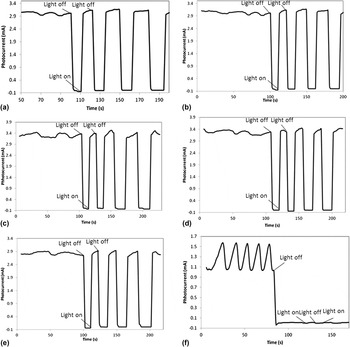
The responsiveness of the pure TiO2 and W–TiO2 nanotubes toward the interruption of light was studied at a fixed bias voltage. The photocurrent of the samples was also measured. The potentiostatic plots of the photocurrent are exhibited in Figs. 8(a)−8(f). Good photoresponses were recorded for the pure TiO2 and different W-loaded RF powers on the TiO2 nanotubes from 50 to 200 W under on–off light conditions. As shown in Figs. 8(a)–8(f), this photocurrent pattern was highly reproducible for numerous on–off cycles. However, the effect of 250 W of W-loaded RF sputtering power on TiO2 was not as predicted as for the pure TiO2 [Fig. 8(a)]. Upon illumination after the interruption (light off), the photocurrents of the W-loaded TiO2 were not reverted to their original position in the photocurrent [Fig. 8(f)]. These experimental results are in accordance to the decrease in photocurrent density after illumination (Fig. 7). The nonsensitive response in interruption upon illumination may be attributed to the defects in the WO3–TiO2 interface, which may be caused by the lattice mismatch between the TiO2 and W interface. Hence, these defects acting as recombination sites for the photogenerated electrons and holes reduce the sensitivity to light.
Potentiostatic plot of photocurrent for (a) Pure TiO2 nanotube and W-TiO2 nanotubes, (b) 50 W, (c) 100 W, (d) 180 W, (e) 200 W, and (f) 250 W at 0.5 V under interrupted light illumination.

In order to estimate the quantitative correlation of light absorption on W-loaded TiO2 nanotubes, the photoconversion efficiency (η) of light to hydrogen energy measurements were performed to study the photoresponse wave length region W-loaded TiO2 nanotubes as shown in Fig. 9. The photoconversion efficiency η was calculated based on the following equationReference Grimes51, Reference Lai and Sreekantan52:

Photoconversion efficiency vs. potential applied of W sputtered on the amorphous structure of the TiO2 nanotubes of different RF sputtering powers: (a) 100 W, (b) 50 W, (c) 180 W, (d) 200 W, (e) pure TiO2 nanotubes, and (f) 250 W.

where j p is the photocurrent density (mA/cm2); j p is the total power output; j p
 is the electrical power input; Io is the power density of the incident light (mW/cm2);
 is the standard reversible potential [1.23 V/Standard hydrogen electrode (SHE)]; E app = E mean − E aoc; E mean is the electrode potential [versus Saturated calomel electrode (SCE)] of the working electrode where the photocurrent was measured under illumination; and E aoc is the potential (versus SCE) of the working electrode at open-circuit condition.
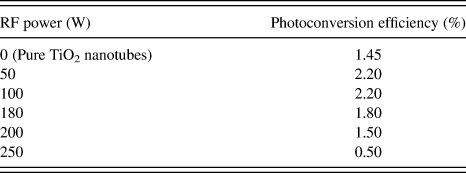
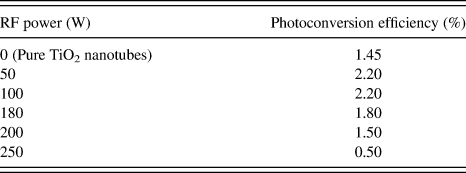
The photoconversion efficiency for the pure TiO2 and W–TiO2 nanotubes using different RF sputtering powers has been summarized in Table II. A maximum conversion efficiency of 2.20% was obtained from the samples subjected to W deposition at 50 and 100 W for 30 s. Subsequently, the photoconversion efficiencies of 1.80%, 1.50%, and 0.5% were obtained at 180, 200, and 250 W deposition rates, respectively. In conclusion, the incorporation of W in the W/TiO2 photoelectrode at a deposition rate of 50 W power for 30 s exhibited the highest photocurrent density of 1.55 mA/cm2, with a maximum photoconversion efficiency of 2.2%.
The photoconversion efficiency for the pure TiO2 and W–TiO2 nanotubes using different RF sputtering powers.
IV. CONCLUSION
In the present study, W–TiO2 nanotubes were conducted using RF sputtering to develop TiO2 photoanode in an effective PEC system to generate hydrogen gas. A RF sputtering power of 50 W was found to be the optimum power for the successful incorporation of W into the TiO2 lattice. This sample showed the highest photocurrent density of 1.55 mA/cm2, with a photoconversion efficiency of 2.2% in the PEC performance due to faster transportation of photogenerated electrons and reduced recombination center in the resultant W–TiO2 nanotubes. However, as the sputtering power increased, the nanotube arrays collapsed and eventually formed a WO3-mixed TiO2 layer. This condition resulted in a high recombination center and decreased the PEC performance because of the restrains in the transportation of photogenerated electron/hole pairs.
ACKNOWLEDGMENTS
The author would like to thank Universiti Sains Malaysia for sponsoring this work under RU Grant 814075, PRGS Grant 8044058, Fellowship USM and Research University Postgraduate Research Grant Scheme, 80430146.