Introduction
Two-dimensional (2D) transition dichalcogenide (TMDC) materials have recently emerged as a topical area of physical science and engineering (see the Introductory article in this issue of MRS Bulletin). While interest was initially inspired by the discovery of graphene, a monolayer of carbon atoms, 2D TMDC materials bear two significant differences from graphene. First, compared with the relatively simple composition and structure of graphene, 2D TMDC materials feature rich compositional and structural variations.Reference Wilson and Yoffe1 They have a general chemical formula of MX2 where M can be a transition-metal element such as Ta, Nb, Mo, and W, and X can be S, Se, or Te. Two-dimensional TMDC materials also have multiple polymorphs in crystalline structures, including 1H or 1T for monolayers and 1T, 2H, and 3R for a few layers. This variation in composition and structure may enable broad tunability in functionalities that cannot be obtained with graphene. Second, unlike graphene, which is semi-metallic without a bandgap by nature or with a trivial bandgap (<0.25 eV) through engineering,Reference Han, Ozyilmaz, Zhang and Kim2 2D TMDC materials such as MoS2, WS2, MoSe2, and WSe2 have bandgaps with amplitudes comparable to those of conventional Group IV, II–VI, and III–V semiconductors.Reference Mak, Lee, Hone, Shan and Heinz3 As the surface of TMDC materials is naturally passivated with no dangling bonds, even monolayer TMDCs may show excellent electronic and optical properties. This is distinct from conventional semiconductor materials, whose electric and optical properties are expected to dramatically degrade when scaled down to atomic dimensions due to the presence of surface defects. Two-dimensional TMDC materials provide an attractive atomic-scale material platform with versatile functionalities that may open up an age of atomic-scale technology, in particular, atomic-scale semiconductor technology.
A particularly promising application of 2D TMDC materials is in photonics. This is largely rooted in the strong exciton-binding energies of these materials and their prospect to enable unprecedented capabilities for engineering exciton dynamics. Two-dimensional TMDC materials may have exciton binding energies one order of magnitude larger than conventional semiconductor materials. For instance, the exciton binding energy of monolayer MoS2 is estimated to be in the range of 0.4–1.1 eV,Reference Cheiwchanchamnangij and Lambrecht4–Reference Shi, Pan, Zhang and Yakobson9 much larger than the tens of meV in typical semiconductor materials. This strong exciton binding energy bears significant importance for both fundamental and applied research. It can induce strong excitonic absorption and emission, promising the development of extremely flexible, cost-effective, and high-performance optoelectronic devices with only a minimal amount of materials used. It also makes 2D TMDC materials an ideal platform for studies on fundamental physics of excitons, in particular those that are usually difficult to study due to weak exciton binding energy.
Two-dimensional TMDCs may enable unprecedented capabilities to engineer the dynamics of excitons through vertical heterogeneous integration.Reference Kang, Tongay, Zhou, Li and Wu10–Reference Duan, Wang, Shaw, Cheng, Chen, Li, Wu, Tang, Zhang, Pan, Jiang, Yu, Huang and Duan20 Heterostructures, which consist of dissimilar materials integrated together, have been widely used as a major platform for the engineering of excitons in photonic devices. However, the performance of conventional heterostructures is limited by the requirement of suitable lattice matching to enable efficient charge transfer across interfaces. This requirement imposes significant constraints on the tunability of composition and structure attainable in conventional heterostructures, which eventually limits functionality. In contrast, TMDCs have no dangling bonds at the surface, and they interact with adjacent materials only by weak van der Waals (vdW) forces. Therefore, 2D heterostructures consisting of dissimilar, vertically stacked TMDC layers may have high-quality interfaces and efficient interfacial charge transfer even in the presence of substantial lattice mismatch between the layers involved. The composition, structure, and stacking orientation of each layer can be arbitrarily tuned without concern about the interface quality. This unprecedented tunability in composition and structure has the potential to enable new capabilities for the engineering of excitons unobtainable with conventional heterostructures. Unlike the fabrication of conventional semiconductor heterostructures with high-quality interfaces, which requires costly and sophisticated processes such as metal–organic chemical vapor deposition or molecular beam epitaxy, 2D heterostructures may be fabricated simply by manually stacking the component materials.
In the following sections, recent studies on the fundamental excitonic properties of 2D TMDC materials are reviewed with a focus on the most studied materials to date: MoS2, WS2, MoSe2, and WSe2. The strategies used to engineer the dynamics of the exciton, including heterostructures and resonant optics, are discussed. Also discussed are perspectives on scientific problems that are important for the development of 2D TMDC photonic devices but have yet to be answered.
Excitonic properties
Exciton states and binding energy
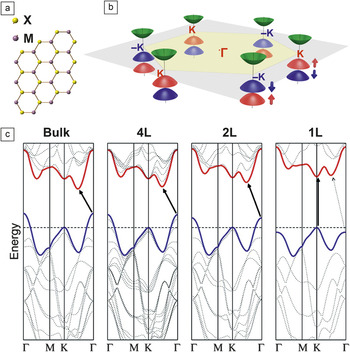
Knowledge of the band structure of 2D TMDC materials is important for understanding the excitonic properties of the materials. Figure 1 shows a schematic illustration for the Brillouin zone of 2D TMDC materials, which has hexagonal symmetry dictated by the crystalline structure. The valence band edge at the K point (the corner of the Brillouin zone) is split into two levels due to strong spin–orbital coupling, by 160–200 meVReference Mak, Lee, Hone, Shan and Heinz3,Reference Splendiani, Sun, Zhang, Li, Kim, Chim, Galli and Wang21 and 430–470 meVReference Zeng, Liu, Dai, Yan, Zhu, He, Xie, Xu, Chen, Yao and Cui22 for molybdenum and tungsten dichalcogenides, respectively. For monolayers, the valence band maximum and the conduction band minimum both are located at the K point, giving rise to a direct bandgap. As shown in Figure 1c, with an increasing number of layers, the valence band edge at the Γ point may cross over such that at the K point, the bandgap becomes indirect,Reference Mak, Lee, Hone, Shan and Heinz3,Reference Splendiani, Sun, Zhang, Li, Kim, Chim, Galli and Wang21 which is related to the atomic orbitals involved in the band structure. For instance, Mo 4d and S 3p orbitals play a decisive role in the band structure of MoS2.Reference Kadantsev and Hawrylak23–Reference Mattheis25 The spatial extent of these atomic orbitals (∼1.1Å) is comparable to the separation between the S atoms in adjacent layers but smaller than the separation between the Mo atoms.Reference Kadantsev and Hawrylak23 Intuitively, the energy levels dominated by the S p orbitals are subject to the influence of interlayer interactions, while those mainly contributed by Mo d orbitals are less sensitive to this interaction. The valence band edge at the Γ point involves contribution from S 3p orbitals and moves up substantially as the number of layers increases, while the conduction and valence band edges at the K point, mainly composed of Mo 4d orbitals, remain constant regardless of the number of layers.
Band structures of 2D transition-metal dichalcogenide (TMDC) materials. (a) Schematic illustration of the (001) plane and (b) the Brillouin zone of 2D TMDC materials. (c) Calculated band structures of bulk MoS2, quadralayer MoS2 (4L), bilayer MoS2 (2L), and monolayer MoS2 (1L). The black arrows indicate the lowest energy transitions. Direct excitonic transitions occur at high energies at the K point. With reduced layer thickness, the indirect bandgap becomes larger, while the direct excitonic transition barely changes. Monolayer MoS2 becomes a direct bandgap semiconductor. (b) Credit: Wang Yao. (c) Reprinted with permission from Reference 23. © 2010 American Chemical Society.

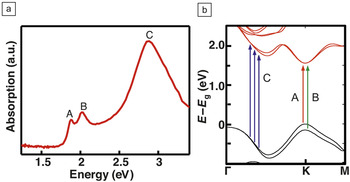
Multiple excitons have been observed in 2D TMDCs. Of greatest interest are the three excitons with the lowest energies, named A, B, and C from low to high energy, respectively (Figure 2a). The A and B excitons arise from the transitions between the spin–orbit split valence bands and the lowest conduction band at the K point,Reference Coehoorn, Haas and Degroot26 while the C exciton is associated with the transition from the valence band to the conduction band at some part of the Brillouin zone between the K and Γ pointsReference Qiu, Jornada and Louie7,Reference Kozawa, Kumar, Carvalho, Amara, Zhao, Wang, Toh, Ribeiro, Neto, Matsuda and Eda27 (Figure 2b).
Excitonic states in monolayer MoS2. (a) Spectral absorption of monolayer MoS2 with the A, B, and C excitons labeled as shown. (b) The band structure of monolayer MoS2 with arrows indicating the interband transitions associated with the A, B, and C excitons. (b) Reprinted with permission from Reference 21. © 2014 Nature Publishing Group. Note: E, energy; E g, bandgap energy.

Many of the interesting properties of the excitons are rooted in the atomic orbitals involved. For instance, the band edges at the K point are mainly contributed by Mo 4d orbitals, and hence the positions of A and B excitons are less sensitive to the number of layers than the C exciton.Reference Li, Chernikov, Zhang, Rigosi, Hill, Zande, Chenet, Shih, Hone and Heinz28 Additionally, the strong spin–orbit coupling of transition-metal orbitals (such as Mo 4d orbitals), along with a broken inversion symmetry, can lead to strong coupling between the valley and spin polarizations at the ±K point in monolayer TMDC materials.Reference Xiao, Liu, Feng, Xu and Yao29 The two spin polarizations (spin-up or spin-down) are separately fixed with the valleys at the +K and –K points (i.e., the charges in the valleys at the +K point show spin polarizations opposite to those in the valleys at the –K point). This provides an intriguing capability to control the spin polarization by selectively exciting/injecting charges into the different valleys. The selective excitation can be achieved through illumination of circularly polarized light with wavelengths matching the A or B exciton.Reference Cao, Wang, Han, Ye, Zhu, Shi, Niu, Tan, Wang, Liu and Feng30–Reference Zeng, Dai, Yao, Xiao and Cui32 A recent study reported that charge carriers might also be controlled to selectively distribute at the +K and –K points if they are electrically injected under the presence of a lateral electric field. This is because the electron and hole momentum shifts are opposite under such a field.Reference Zhang, Oka, Suzuki, Ye and Iwasa33 The strong coupling of valley–spin polarizations only holds for the A and B excitons but not for the C exciton,Reference Cao, Wang, Han, Ye, Zhu, Shi, Niu, Tan, Wang, Liu and Feng30,Reference Mak, He, Shan and Heinz34 which is again understandable considering the difference of the atomic orbitals involved.
While it is well recognized that 2D TMDC materials have a strong exciton binding energy and small exciton Bohr radius, the specific values of the binding energy and Bohr radius vary substantially in the literature. Most existing studies are theoretically based on first-principles techniques. The calculations for the A exciton binding energy in monolayer MoS2 vary from 0.5–1.1 eV,Reference Cheiwchanchamnangij and Lambrecht4–Reference Shi, Pan, Zhang and Yakobson9 and its Bohr radius ranges from 0.9–2 nm.Reference Cheiwchanchamnangij and Lambrecht4,Reference Komsa and Krasheninnikov6,Reference Qiu, Jornada and Louie7,Reference Feng, Qian, Huang and Li35 The substantial variation indicates the limited capabilities of first-principles techniques to deal with the tightly bound excitons in 2D TMDCs. Among the few experimental measurements of the exciton binding energy, the results show non-trivial variation and uncertainty as well. The binding energies of the A and B excitons in monolayer MoS2 are measured to be >570 meVReference Klots, Newaz, Wang, Prasai, Krzyzanowska, Lin, Caudel, Ghimire, Yan, Ivanov, Velizhanin, Burger, Mandrus, Tolk, Pantelides and Bolotin5 and 0.44 eV,Reference Hill, Rigosi, Roquelet, Chernikov, Berkelbach, Reichman, Hybertsen, Brus and Heinz36 respectively. The binding energy of the A exciton in monolayer WS2 is reported to be 0.7 eV37 and 0.32 eV36,38 by two different groups, the latter might underestimate the binding energy given that monolayer WS2 is expected to have a stronger exciton binding energy than monolayer MoS2, as indicated by the much higher luminescent efficiency. No experimental results are available for the Bohr radius of excitons yet, partially due to the lack of accurate information for the dielectric constant of the atomically thin materials.
Most of the current work is focused on the A exciton, but how the results could be different for the other excitons is not clear. Additionally, the definition of the exciton Bohr radius, which assumes excitons to be spherical, is only valid for materials systems that are isotropic or reasonably isotropic compared to the Bohr radius. However, the shape of the exciton in 2D TMDCs is expected to be anisotropic due to the extremely anisotropic dimension of the materials. Some clarification would be necessary for the exciton Bohr radius in 2D TMDCs to make it meaningful.
Exciton absorption and emission
Due to their extraordinarily strong exciton binding energy, 2D TMDC materials generally show strong excitonic absorption. One MoS2 monolayer is able to absorb around 5% or higher of the incident light above the optical bandgap (<670 nm), and even greater absorption can be observed in monolayer WS2.Reference Yu, Hu, Su, Huang, Liu, Jin, Purezky, Geohegan, Kim, Zhang and Cao13 The absorption efficiency per unit thickness is truly remarkable, one or two orders of magnitude higher than that of conventional semiconductors such as silicon or germanium. For this reason, 2D TMDCs hold great promise for the development of ultra-thin, flexible, absorption-based devices such as photodetectors, modulators, and solar cells. However, in order for these materials to be useful for practical applications, substantial improvement in the absorption is necessary as the total absorption efficiency in a monolayer is still weak due to the atomic-scale thickness.
Increasing the thickness through the use of multiple monolayers will increase the absorption efficiency to some degree, but the most appealing strategy would be leveraging the light-trapping power of optical resonant structures, such as photonic crystals or optical antennas. Previous studies have predicted perfect absorption in graphene for a narrow-band incidence by using photonic slabs.Reference Piper and Fan39 The strategy of critical coupling used in that work could serve as useful guidance for the design of 2D TMDC perfect absorbers. However, special attention to the dispersion of 2D TMDC materials is required.
In the design of graphene absorbers, the materials are assumed to be dispersionless (i.e., the refractive index is assumed to be wavelength independent).Reference Piper and Fan39 In contrast, the refractive index of TMDCs may vary by one order of magnitude in the range of visible wavelengths.Reference Beal and Hughes40 Better strategies that take material dispersion into account are needed for the rational design of perfect absorbers with 2D TMDC materials. Enabling perfect absorption in 2D TMDCs for broadband incidence like solar radiation is even more challenging. A recent theoretical study has demonstrated that by integration with a chirped planar dielectric cavity, monolayer MoS2 can absorb as much as 33% of incident visible light over a 300 nm bandwidth.Reference Zheng, Barton and Englund41 This is yet not good enough for many applications such as solar cells.
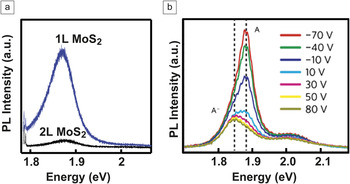
Monolayer 2D TMDCs also feature excitonic emissionReference Mak, Lee, Hone, Shan and Heinz3,Reference Splendiani, Sun, Zhang, Li, Kim, Chim, Galli and Wang21 (Figure 3a). The emission is usually dominated by the A exciton. Surprisingly, despite the strong exciton binding energy and natural surface passivation, the luminescence quantum yield of 2D TMDCs observed in experiments is not high. The photoluminescence (PL) quantum yield of monolayer MoS2 is reported to be around 0.45%,Reference Mak, Lee, Hone, Shan and Heinz3 which indicates that the decay of excitons is mainly through non-radiative pathways. Recent studies suggest that defects play a dominant role in facilitating the non-radiative recombination of excitons in 2D TMDCs.Reference Wang, Zhang and Rana42,Reference Docherty, Parkinson, Joyce, Chiu, Chen, Lee, Li, Herz and Johnston43
Excitonic emission of 2D MoS2. (a) Photoluminescence (PL) spectra collected from monolayer (1L) and bilayer (2L) MoS2. (b) PL spectra of the monolayer MoS2 applied with different back-gate voltages. Both the contribution from the neutral exciton (A) and trion (A−) (dashed lines indicate the corresponding resonance energies) are identified as shown. (a) Adapted from Reference 13. (b) Reprinted with permission from Reference 44. © 2014 Nature Publishing Group.

One unique feature in 2D TMDC emission is the involvement of negatively charged excitons, also called trionsReference Mak, He, Lee, Lee, Hone, Heinz and Shan44,Reference Ross, Wu, Yu, Ghimire, Jones, Aivazian, Yan, Mandrus, Xiao, Yao and Xu45 (Figure 3b). The negatively charged exciton consists of a neutral exciton bound with an additional electron by Coulomb interactions and forms because of the strong exciton binding energy of 2D TMDC materials. Its emission shows energy lower than that of the neutral exciton, and the difference represents the trion binding energy, which is around 20 meV in monolayer MoS2.Reference Mak, He, Lee, Lee, Hone, Heinz and Shan44 The emission efficiency of trions is much lower than that of neutral excitons (Figure 3b), because trions tend to facilitate three-particle non-radiative recombination, such as Auger recombination. Therefore, it is highly desired to minimize the population of trions to achieve high luminescence efficiency.
The population ratio between neutral excitons and trions strongly depends on the concentration of free electrons in the materials, as a higher concentration of free electrons facilitates the formation of trions. Recent studies have demonstrated that the PL of monolayer MoS2, WS2, and WSe2 depends on gating voltage, crystalline defects, chemisorption of molecules, and substrates. All of these can essentially be ascribed to the effect induced by the change in free carrier concentration. PL can serve as a useful tool to characterize the doping level of 2D TMDCs.Reference Sercombe, Schwarz, Del Pozo-Zamudio, Liu, Robinson, Chekhovich, Tartakovskii, Kolosov and Tartakovskii46
Exciton dynamics
Understanding the dynamics, including generation, dissociation, transfer, and relaxation, of excitons is important for the development of photonic devices. Because of the strong spin–valley coupling, the dynamics of excitons in monolayer TMDC materials involves two aspects, charge dynamics and polarization dynamics. Hot charge carriers may relax energy through interband transitions (charge dynamics) and relax spin–valley polarization through intervalley transitions (polarization dynamics). It is generally recognized that the interband relaxation in monolayer MoS2 is mainly non-radiative and involves two major decays: a fast decay on a time scale of 1–3 ps and a slow decay on a time scale of 10–100 picoseconds.Reference Wang, Zhang and Rana42,Reference Docherty, Parkinson, Joyce, Chiu, Chen, Lee, Li, Herz and Johnston43,Reference Shi, Yan, Bertolazzi, Brivio, Gao, Kis, Jena, Xing and Huang47,Reference Lagarde, Bouet, Marie, Zhu, Liu, Amand, Tan and Urbaszek48
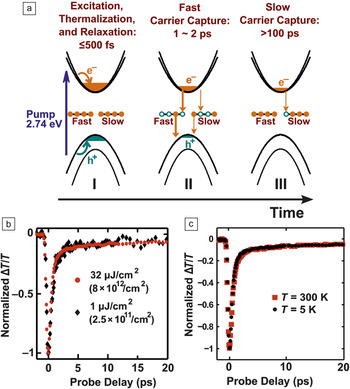
The radiative recombination of the excitons in monolayer MoS2 is estimated on a time scale of hundreds ps to ∼1 ns at room temperature.Reference Wang, Zhang, Chan, Manolatou, Tiwari and Rana49,Reference Palummo, Bernardi and Grossman50 The interband relaxation is believed to be dominated by defect-assisted recombinations.Reference Wang, Zhang and Rana42,Reference Docherty, Parkinson, Joyce, Chiu, Chen, Lee, Li, Herz and Johnston43 The two decay steps could be correlated with two defect-assisted capturing processes for hot charge carriers with different capture ratesReference Wang, Zhang and Rana42 (Figure 4a). The dominance of defect-assisted recombinations is supported by the independence of the decay rate on temperature and the fluence of the pumping beamsReference Wang, Zhang and Rana42,Reference Docherty, Parkinson, Joyce, Chiu, Chen, Lee, Li, Herz and Johnston43,Reference Nan, Wang, Wang, Liang, Lu, Chen, He, Tan, Miao, Wang, Wang and Ni51 (Figure 4b–c). It seems that phonon scattering and Auger recombination, two important mechanisms for exciton decay in conventional materials, do not play any major role in the interband exciton relaxation of monolayer MoS2. The spin–valley polarization dynamics of 2D TMDCs bears much similarity to the charge dynamicsReference Lagarde, Bouet, Marie, Zhu, Liu, Amand, Tan and Urbaszek48,Reference Mai, Barrette, Yu, Semenov, Kim, Cao and Gundogdu52 and has been reported to consist of two decay steps as well: a fast decay on a time scale of hundreds fs and a slow decay on a time scale of around 10 ps.Reference Lagarde, Bouet, Marie, Zhu, Liu, Amand, Tan and Urbaszek48,Reference Mai, Barrette, Yu, Semenov, Kim, Cao and Gundogdu52 The polarization decay is also found to be independent of temperature.Reference Lagarde, Bouet, Marie, Zhu, Liu, Amand, Tan and Urbaszek48 However, different from the interband relaxation, in which holes and electrons decay at the same rate, the polarization decay of holes is slower than that of electrons because of the lack of degeneracy at the valence band edge.Reference Mai, Barrette, Yu, Semenov, Kim, Cao and Gundogdu52
Excitonic dynamics in monolayer MoS2. (a) Illustration of the ultrafast carrier dynamics in MoS2: (I) After photoexcitation, the carriers thermalize, cool, and form a correlated electron–hole plasma. (II) Most of the holes followed by the electrons are captured by fast defects within 1∼2 ps. A small fraction of the photogenerated holes is also captured by slow defects. (III) After all the photoexcited holes have been captured and the electrons have filled the fast traps completely, the remaining photoexcited electrons are captured by the slow defects on a 60−70 ps time scale, and a slow transient lasts for more than 100 ps. (b) Measured ΔT/T (normalized) of the probe pulse in pump-probing measurement plotted for two pump fluences, 1 μJ/cm2 and 32 μJ/cm2, at temperature T = 300 K. (c) ΔT/T (normalized) plotted as a function of the probe delay for 5 K and 300 K. The data show no significant temperature dependence of the time scales associated with the transient. The pump fluence was ∼32 μJ/cm2 in both cases. Reprinted with permission from Reference 42. © 2015 American Chemical Society.

More studies are necessary to better understand the exciton dynamics in 2D TMDC materials. Uncertainty, inconsistency, and controversy can be found in existing studies. For instance, excitons are believed to decay mainly through defect-assisted recombination,Reference Wang, Zhang and Rana42,Reference Docherty, Parkinson, Joyce, Chiu, Chen, Lee, Li, Herz and Johnston43 but it is unclear which the major source of the defect is, intrinsic defects in the materials or extrinsic defects from the substrate. The results for how the exciton dynamics depends on the number of layers are inconsistent. Both an increaseReference Shi, Yan, Bertolazzi, Brivio, Gao, Kis, Jena, Xing and Huang47 and decreaseReference Docherty, Parkinson, Joyce, Chiu, Chen, Lee, Li, Herz and Johnston43 in the decay rate with an increasing number of layers have been reported.
Additionally, the results of time-resolved dynamics measurements are inconsistent with the time-averaged PL measurements. The polarization and charge dynamics of monolayer MoS2 are reported to be independent of temperature,Reference Wang, Zhang and Rana42,Reference Docherty, Parkinson, Joyce, Chiu, Chen, Lee, Li, Herz and Johnston43,Reference Lagarde, Bouet, Marie, Zhu, Liu, Amand, Tan and Urbaszek48 but time-averaged PL measurements indicate that both the amplitude and chirality of the PL increase with decreasing temperature.Reference Mak, He, Shan and Heinz34 Experimental results may also vary among different research groups, which makes it difficult to systematically cross-check the results obtained by different groups.
There are many important issues related to exciton dynamics that are not well understood or have yet to be explored. These include (1) the radiative lifetime, (2) the dynamics of charged excitons versus neutral excitons, (3) the dynamics of the different exciton states, (4) the impact of external effects (substrate, field cavity mode) on charge and polarization dynamics, (5) the effects of compositional and structural features (1T, 1H, 2H, 3R, or defects), and (6) the dynamics of strongly correlated phases of excitons, for instance, Bose–Einstein condensation. Understanding these issues will pave the way for the development of exotic excitonic devices.
Exciton engineering: Two-dimensional heterostructures and resonant light–matter interactions
Two-dimensional heterostructures
Two-dimensional heterostructures consisting of two or more dissimilar 2D TMDC materials can provide unprecedented capabilities to manipulate excitons.Reference Kang, Tongay, Zhou, Li and Wu10–Reference Komsa and Krasheninnikov12 There are two types of 2D TMDC heterostructures that have been demonstrated: vertical heterostructures in which dissimilar 2D materials are vertically stackedReference Yu, Hu, Su, Huang, Liu, Jin, Purezky, Geohegan, Kim, Zhang and Cao13–Reference Lee, Lee, Zande, Chen, Li, Han, Cui, Arefe, Nuckolls, Heinz, Guo, Hone and Kim15,Reference Hong, Kim, Shi, Zhang, Jin, Sun, Tongay, Wu, Zhang and Wang17–Reference Fang, Battaglia, Carraro, Nemsak, Ozdol, Kang, Bechtel, Desai, Kronast, Unal, Conti, Conlon, Palsson, Martin, Minor, Fadley, Yablonovitch, Maboudian and Javey19 and lateral heterostructures in which the component materials chemically bind along a line interface.Reference Huang, Wu, Sanchez, Peters, Beanland, Ross, Rivera, Yao, Cobden and Xu16,Reference Gong, Lin, Wang, Shi, Lei, Lin, Zou, Ye, Vajtai, Yakobson, Terrones, Terrones, Tay, Lou, Pantelides, Liu, Zhou and Ajayan18,Reference Duan, Wang, Shaw, Cheng, Chen, Li, Wu, Tang, Zhang, Pan, Jiang, Yu, Huang and Duan20 The vertical heterostructure is more promising from the standpoint of practical applications, because it provides a plane junction with an anatomically sharp interface. Most of the 2D vertical heterostructures studied to date are made by manually stacking with non-epitaxial orientations. Two recent studies have presented the synthesis of epitaxial MoS2/WS2 vertical heterostructures via chemical vapor deposition processes,Reference Yu, Hu, Su, Huang, Liu, Jin, Purezky, Geohegan, Kim, Zhang and Cao13,Reference Gong, Lin, Wang, Shi, Lei, Lin, Zou, Ye, Vajtai, Yakobson, Terrones, Terrones, Tay, Lou, Pantelides, Liu, Zhou and Ajayan18 but each of the monolayers in the synthesized heterostructure is mixed with 5–10% of other materials (i.e., the WS2 monolayer mixed with 5–10% MoS2 and vice versa).Reference Yu, Hu, Su, Huang, Liu, Jin, Purezky, Geohegan, Kim, Zhang and Cao13,Reference Gong, Lin, Wang, Shi, Lei, Lin, Zou, Ye, Vajtai, Yakobson, Terrones, Terrones, Tay, Lou, Pantelides, Liu, Zhou and Ajayan18
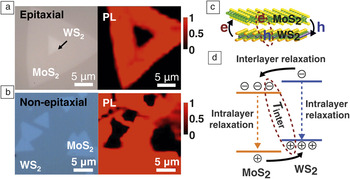
Efficient interlayer relaxation and recombination of excitons have been observed in various 2D vertical heterostructures, including WS2/MoS2,Reference Yu, Hu, Su, Huang, Liu, Jin, Purezky, Geohegan, Kim, Zhang and Cao13,Reference Tongay, Fan, Kang, Park, Koldemir, Suh, Narang, Liu, Ji, Li, Sinclair and Wu14,Reference Hong, Kim, Shi, Zhang, Jin, Sun, Tongay, Wu, Zhang and Wang17,Reference Gong, Lin, Wang, Shi, Lei, Lin, Zou, Ye, Vajtai, Yakobson, Terrones, Terrones, Tay, Lou, Pantelides, Liu, Zhou and Ajayan18 WSe2/MoSe2,Reference Hill, Rigosi, Roquelet, Chernikov, Berkelbach, Reichman, Hybertsen, Brus and Heinz36 and WSe2/MoS2Reference Lee, Lee, Zande, Chen, Li, Han, Cui, Arefe, Nuckolls, Heinz, Guo, Hone and Kim15,Reference Fang, Battaglia, Carraro, Nemsak, Ozdol, Kang, Bechtel, Desai, Kronast, Unal, Conti, Conlon, Palsson, Martin, Minor, Fadley, Yablonovitch, Maboudian and Javey19 (Figure 5). The interlayer relaxation, in which electrons and holes transfer across the interface in opposite directions into different layers, may be evidenced by the substantial decrease in the PL intensity of the heterostructure as compared to separate monolayers.Reference Yu, Hu, Su, Huang, Liu, Jin, Purezky, Geohegan, Kim, Zhang and Cao13 Interlayer recombination is the recombination of electrons from the conduction band of one layer and holes from the valence band of the other layer and may give rise to a new PL peak with energy lower than the intrinsic bandgaps of the component materials involved.Reference Tongay, Fan, Kang, Park, Koldemir, Suh, Narang, Liu, Ji, Li, Sinclair and Wu14,Reference Gong, Lin, Wang, Shi, Lei, Lin, Zou, Ye, Vajtai, Yakobson, Terrones, Terrones, Tay, Lou, Pantelides, Liu, Zhou and Ajayan18 The observed efficient interlayer relaxation and recombination indicates the transfer of charge carriers across the interface is very efficient. In WS2/MoS2 heterostructures, the interlayer charge transfer process is estimated to be on a time scale of 10–100 fs, one or two orders of magnitude faster than the intralayer decay of excitons.Reference Yu, Hu, Su, Huang, Liu, Jin, Purezky, Geohegan, Kim, Zhang and Cao13,Reference Hong, Kim, Shi, Zhang, Jin, Sun, Tongay, Wu, Zhang and Wang17
Efficient charge transfer in both epitaxial and non-epitaxial MoS2/WS2 heterostructures. (a–b) Optical images and photoluminescence mapping for epitaxial and non-epitaxial MoS2/WS2 heterostructures, respectively. (c) Schematic illustration of the MoS2/WS2 heterostructure and (d) its band structure diagram. Interlayer relaxation and transmission are marked by black arrows and dashed ovals, respectively. (a–b) and (d) Adapted from Reference 13. Note: PL, photoluminescence; T inter, interlayer recombination.

Very significantly, the interlayer charge transfer in 2D heterostructures is found to not be sensitive to the stacking epitaxy of the layers and similar in both epitaxial and non-epitaxial heterostructuresReference Yu, Hu, Su, Huang, Liu, Jin, Purezky, Geohegan, Kim, Zhang and Cao13 (Figure 5). This is actually surprising to some degree. Unlike epitaxial heterostructures, in which the layers are perfectly aligned in both real and reciprocal spaces and the interlayer charge transfer may naturally satisfy the requirement of momentum conservation, the momentum spaces of the layers in the randomly stacked non-epitaxial heterostructure may be substantially misaligned. The efficient interlayer charge transfer regardless of the stacking orientation suggests that the momentum mismatch could be compensated in highly efficient ways. While the underlying physics is elusive at this moment, the insensitivity of the interlayer charge transfer to the stacking orientation bears significant implications for the development of functional 2D heterostructures. It suggests that complex 2D heterostructures fabricated by randomly stacking dissimilar 2D materials may be expected to be similarly functional as the counterparts made with perfect epitaxy and alignment. Two-dimensional heterostructures may provide an unprecedented material platform whose composition and structure could be arbitrarily tuned at the truly atomic level without concern for interfacial charge transfer. This is expected to enable new capabilities for the manipulation of excitons that not obtainable with conventional heterostructures.
Resonant light–matter interactions and dielectric functions
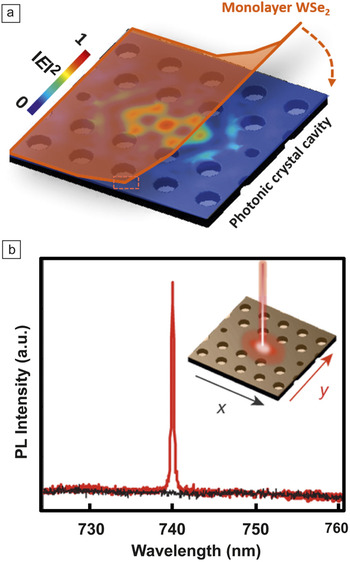
The integration of 2D TMDC materials with resonant optics structures, such as photonic crystals, optical cavities, and plasmonic structures, provides another powerful strategy for the engineering of excitons. Resonant optics structures can enable photon confinement, in which electromagnetic fields are concentrated into a volume much smaller than the wavelength. The integration of 2D TMDC materials with resonant optics structures presents an intriguing combination of electron (quantum) and photon confinements that may allow for sophisticated manipulation of excitons. Both dielectricReference Zheng, Barton and Englund41,Reference Reed, Zhu, Zhu, Yi and Cubukcu53,Reference Wu, Buckley, Schaibley, Feng, Yan, Mandrus, Hatami, Yao, Vučković, Majumdar and Xu54 and metallic (plasmonic)Reference Butun, Tongay and Aydin55–Reference Kang, Najmaei, Liu, Bao, Wang, Zhu, Halas, Nordlander, Ajayan, Lou and Fang57 resonant optics structures have been employed to engineer the optical response of 2D TMDCs. Notably, optically pumped lasing has recently been demonstrated in monolayer WSe2 or WS2 using photonic crystal cavities or microdisk resonators, respectivelyReference Wu, Buckley, Schaibley, Feng, Yan, Mandrus, Hatami, Yao, Vučković, Majumdar and Xu54,Reference Ye, Wong, Lu, Zhu, Chen, Wang and Zhang58 (Figure 6). Although more studies are necessary to substantiate the true lasing characteristics, the results nevertheless represent an important step forward toward the realization of atomic-scale lasers. Also interestingly, strong coupling between cavity modes and excitons in monolayer MoS2 has been recently demonstrated at room temperature by integrating the monolayer into a high-finesse Fabry–Perot cavity.Reference Liu, Galfsky, Sun, Xia, Lin, Lee, Kéna-Cohen and Menon59 This result may eventually lead to the development of polariton lasers.
Lasing in monolayer WSe2. (a) Schematic illustration of the device architecture with WSe2 monolayer on top of a photonic crystal cavity, where the electric field (E) profile (in-plane, x–y) of the fundamental cavity mode (pristine cavity before WSe2 transfer) is embedded as a color plot. (b) Polarization-resolved photoluminescence (PL) spectrum of the device taken at 80 K, showing a completely polarized narrow emission at ∼740 nm. Inset arrows correspond to detected linear polarization in the x, y directions. Reprinted with permission from Reference 54. © 2015 Nature Publishing Group.

One major problem in designing TMDC-based resonant photonics lies in the limited knowledge of the dielectric function of the materials. The most reliable technique for the measurement of dielectric functions is spectroscopic ellipsometry (SE), but the implementation of SE measurements with 2D TMDC materials is problematic. To perform SE measurements usually requires the sample size to be several millimeters at the smallest. Additionally, given the atomically thin dimension of 2D TMDC materials, even minor roughness or non-uniformity could lead to substantial errors in the resulting dielectric function. While there are several SE studies reported for MoS2 monolayers,Reference Liu, Shen, Su, Hsu, Li and Li60,Reference Shen, Hsu, Li and Liu61 the accuracy remains to be confirmed because of the potential imperfection of the MoS2 monolayers studied. Spectral absorption was also recently used to derive the dielectric function of monolayer TMDC materials based on the Kramers–Kronig relationReference Li, Chernikov, Zhang, Rigosi, Hill, Zande, Chenet, Shih, Hone and Heinz28 or a model of reflection from multi-layered systems.Reference Zhang, Ma, Wan, Rong, Xie, Wang and Dai62 But, these results could bear non-trivial errors as well because numerous assumptions were involved in the derivative process. It is worthwhile to point out that all of these experimental results show substantial differences from the theoretical predictions for the dielectric function based on density functional theory (DFT),Reference Shi, Pan, Zhang and Yakobson9 again indicating the limitation of DFT in modeling the excitons of 2D TMDC materials.
Summary and outlook
Two-dimensional TMDCs represent a remarkable excitonic system and promise the development of atomic-scale photonic devices to provide novel functionalities. However, the implementation of device development critically hinges on a thorough understanding of the excitonic properties of these materials. Intuitively, the excitonic properties are rooted in the unique physical features of 2D TMDC materials, including (1) extraordinarily strong exciton binding energy, (2) atomic-scale dimensions, (3) vdW interactions with external material systems, and (4) strong many-body interactions, such as spin–orbital, electron–phonon, and exciton–exciton. Therefore, the key issue is to understand how these unique physical features could enable unique excitonic properties. For instance, the truly atomic-scale dimension of 2D TMDC materials could make the exciton extraordinarily sensitive to the influence of external perturbations, even those whose effect might typically be negligible, such as charging from substrates. Additionally, the strong many-body interactions might enable exotic functionalities such as the selective emission/absorption of light with chirality, and the vdW interaction could lead to new strategies for the manipulation of excitons. The existing understanding of excitons in 2D TMDC materials is limited. More studies are necessary to fully exploit the potential of these materials for the development of atomic-scale photonic devices.