


INTRODUCTION
The 300-year Spanish rule of the Americas was carried out, to a large extent, by provincial governors who had huge discretion over the lives of their indigenous subjects. While some of these individuals were recognized as competent and honest, contemporaries regard others as little more than “tyrants or thieves” (Solorzano and Pereira, cited by Moreno Reference Moreno Cebrian1977, 71). Many of these governors bought their posts from the Spanish crown during times of fiscal crisis. In this paper, I use a hand-collected dataset of these prices to distinguish the “tyrants or thieves” from other governors and investigate their long-run impact on economic development within Peru. I find that provinces with worse colonial governors experience economic disadvantage even hundreds of years after the governors left office, likely because they created a persistent culture of political violence, mistrust, and low incentives to culturally assimilate. While other papers focus on how historical institutions explain contemporary underdevelopment through property rights or public good provision, how the selection and quality of colonial officials impacts long-run growth has been relatively overlooked in this context.
First, I take advantage of a unique market for colonial offices in seventeenth and eighteenth century Spain to show how the returns from extraction shape the incentives of worse or more “extractive” governors to seek office. Between 1673 and 1751, the Spanish Crown routinely sold provincial officesFootnote 1 in the colonial government of Peru and elsewhereFootnote 2 as a way to alleviate fiscal crises due to its involvement in costly European wars. Since greater fiscal need pressured the Crown to trade off individuals’ qualities in exchange for revenue, colonial officials were more likely to be selected based on their willingness and ability to pay and less so on their qualifications or experience.
In particular, office prices show that Peruvian provinces with more opportunities for extraction were in greater demand when the Crown was less selective about who served in the colonies. Following a difference-in-difference strategy, I compare the increase in prices as the Crown relaxed its selection criteria—during fiscal crises caused by European wars—in provinces with greater potential for profit vis-a-vis others. Lacking changes in the selectivity criteria of the Crown and controlling for other possibilities, there should be no substantial difference in the willingness to pay for the same province at times of war versus peace. Yet, estimates show that war periods lead, on average, to a 16% difference in the prices of provinces with greater potential to profit from a key extractive activity (known as repartimiento). This result translates into more than three times the yearly wage of a military captain in the Spanish army at the time.Footnote 3 The finding is not driven by common-year or fixed-provincial traits. There is also no evidence that the increase in office prices reflects changes in the attractiveness of Peruvian provinces during European wars, or selectivity in sales by the Crown, among other explanations.
Rather, the jump in office prices seems to capture the willingness of “worse” colonial officials to pay for high-profit offices during wartime. Data on buyers’ traits show that provinces with greater opportunities for extraction were more likely to be bought by individuals of lower social status during wars. Given that in eighteenth century Spain the nobility and military classes faced greater social and reputation costs from disloyalty to the Crown, and were considered more competent and morally upright in office, these results are consistent with historians’ descriptions of the advent of “worse” colonial officials due to office-selling (Ramos Gomez Reference Ramos Gomez1985; Lohmann Villena Reference Lohmann Villena1957; Moreno Reference Moreno Cebrian1977, 71; Sanz Tapia Reference Sanz Tapia2009, 43).
After using office prices and individual traits to document potential negative selection, I then examine how this class of rulers may have impacted long-run development within Peru. The main empirical challenge is that factors rendering certain offices more valuable to “tyrants or thieves” may also affect long-run economic outcomes in ways that have nothing to do with the type of government officials. To distinguish between these effects, I focus on the difference or gap in office prices at times of low oversight (during wars) relative to periods of high oversight (during peace). Because province fundamentals in Peru are unlikely to vary between war and peace times in Europe, price differences likely capture shifts in the selectivity criteria of the Crown due to fiscal considerations and not other factors.
Results using this approach show that a 30% increase in the average office price sold during wartime leads to a 9.6% reduction in the average household consumption today. Higher prices also reduce years of schooling and public good provision. Because all specifications include the prices paid during peace (a time of greater selectivity), this estimate accounts for provincial traits that do not vary between war and peace times. In fact, additional analyses show that the gap in office prices is unrelated to a host of slow-changing geographic, demographic and economic traits that could plausibly affect development in the long run. Moreover, regional economic disparities are already visible by 1827—just after Peru gained independence—suggesting the importance of colonial rather than postcolonial factors.
Exploitation by more extractive governors often led to rebellions by the indigenous population. These rebellions were usually brutally put down, creating further resentment and a cycle of persistent conflict. Using detailed data on local rebellions for eighteenth century Peru, and following the same specification as before, I find that provinces with higher prices paid during European wars experience a higher number of spontaneous uprisings against their colonial rulers in the office-selling period (1673–1751) than immediately afterward (1752–1780). Additional results from a panel specification—thus controlling for fixed provincial traits and common-year factors—are consistent with these findings. Furthermore, this relationship is still visible in recent times: districts with higher prices in the seventeenth and eighteenth centuries also exhibit greater initial support for anti-government Maoist guerrillas in the 1980s (Shining Path). Given that frequent political violence discourages investment in physical and human capital, and reduces the effectiveness of government, it is unsurprising that these high-priced provinces exhibit lower levels of consumption, schooling and public good provision today.
Exploitation and political violence also exerted a long-run effect on culture and trust, which a recent literature has argued has important effects on economic development (e.g., Nunn and Wantchekon Reference Nunn and Wantchekon2011). The most direct effect of exploitation and violence was thus a reduction of trust in public institutions such as the electoral system, potentially undermining the efficient functioning of government.
More generally, it is likely that persistent exploitation led the Peruvian indigenous population to limit their interactions with colonial authorities and Spanish settlers leading to low cultural assimilation (Diaz-Cayeros Reference Diaz-Cayeros2011). Yet, such a lack of assimilation may be economically costly in the long run due to the loss in potential gains from interactions with the majority (and richer) group (Lazear Reference Lazear1999). In the case of Peruvian provinces, the ethnic segregation of the indigenous population started to become visible post office-selling (1780), worsened in the nineteenth century (1876), and is even higher in contemporary times (2013).
To the best of my knowledge, this is the first study to use office prices to examine negative selection into government positions and their long-term impact. Existing studies have clearly laid out the problem of political selection (Besley Reference Besley2005) and the returns to public office (Querubin and Snyder Reference Querubin and Snyder2013; Eggers and Hainmueller Reference Eggers and Hainmueller2009) but have not examined the link between returns obtained while in office and lasting political and economic underdevelopment.
In particular, this paper shows that the type of local rulers is a key mechanism explaining the long-run impact of colonial institutions. While a number of studies document the legacy of colonial institutions on development (Engerman and Sokoloff Reference Engerman, Sokoloff and Haber1997; Coatsworth Reference Coatsworth2008; Acemoglu, Johnson, and Robinson Reference Acemoglu, Johnson and Robinson2001, Reference Acemoglu, Johnson and Robinson2002; Banerjee and Iyer Reference Banerjee and Iyer2005; Bruhn and Gallego Reference Bruhn and Gallego2012; Dell Reference Dell2010), part of this effect may be driven by attracting certain types of colonial officials in the first place.Footnote 4 In other words, low-quality individuals sorting into certain offices partly explains why institutions impact current development across subnational regions in Peru.
The paper also relates to the literature on social connections and bureaucratic performance. Although some studies find social connections detrimental to bureaucratic performance (Xu Reference Xu2017), others suggest they may help screen officials and improve performance in office (Jia, Kudamatsu, and Seim Reference Jia, Kudamatsu and Seim2015; Allen Reference Allen2005). In colonial Peru, the temporary shift in the type of officials governing the colony coincided with more political conflict in the short and long run, indicating that social connections may have helped the Crown screen and incentivize officials compared to those who entered office via office-selling.
Finally, these results document the role of conflict in magnifying and perpetuating the impact of historical events. Given the wide-ranging impact of conflict on income, health, human capital, and other economic outcomes, its recurrence may help explain regional disparities not only in Peru but also in other settings where its persistence has been well documented (e.g., Besley and Reynal-Querol Reference Besley and Reynal-Querol2014, for sub-Saharan Africa).
BACKGROUND—SALE OF PUBLIC OFFICES
The sale of public offices was a common practice in settings as diverse as France, England, the Ottoman Empire, and China (Swart Reference Swart1980). In the case of Spain, office-selling was used in the early sixteenth century to allocate minor posts and nobility titles. Yet it only became an important mechanism to select colonial governors in the late seventeenth century (Parry Reference Parry1953) when the Hapsburg King Charles II began to exchange colonial governorships for money.Footnote 5
That is, prior to the 1670s, colonial governorships were generally allocated to individuals who fulfilled certain requisites or who provided “services” to the Crown (Sanz Tapia Reference Sanz Tapia2009, 50). According to the laws governing the Indies, ideal governors were those with “lineage, prudence and good manners.” For instance, governors were not to be of “low social status, humble origins or come from manual occupations” (Lohmann Villena Reference Lohmann Villena1957, 98). While this preference for high social status bureaucrats can be interpreted as classism, it actually served key functions in premodern bureaucracies, such as inducing loyalty (Parry Reference Parry1953, 2) or conveying private information. In fact, among eighteenth century observers, patronage was preferable to sales because it provided a reason for officials to behave with “reason and justice” whereas selling positions was akin to the Crown “consenting” to the extorsion of the indigenous population in the colonies (Ramos Gomez Reference Ramos Gomez1985, 174). The logic is similar to that of seventeenth century Britain where “[. . .] what policed the behavior of the office-holder was the threat of expulsion from the aristocracy, loss of the benefits of office, and the loss of social capital if caught or suspected of acting outside the interest of the patron” (Allen Reference Allen2005, 62).
Despite these known concerns with office-selling, the dire financial situation of the Crown circa 1670—during the Franco-Dutch war—led to the systematic sale of colonial governorships. The decision was framed as an emergency (and temporary) measure to face “pressing needs” (urgencias presentes) from warfare. Although the negative consequences from office-selling were well-known and legal scholars strongly condemned it at the time (Parry Reference Parry1953, 1), the policy remained in place due to a combination of persistent fiscal weakness and direct benefits accruing to members of the court involved in it (Sanz Tapia Reference Sanz Tapia1998). For example, once Philip V took office in 1701, he vowed to improve governance in the colonies and revoked all appointments sold in the last 10 years by his predecessor. Yet, these intentions proved short-lived, since as early as 1705—during the war of the Spanish succession—Philip himself began to sell governorships citing the prospect of potential military defeat in Europe and subsequent disintegration of the Spanish Empire (Burkholder and Chandler Reference Burkholder and Chandler1977). The practice would only end definitely in 1751, during an Empire-wide effort to modernize government, known as the Bourbon Reforms.
According to contemporaries, the office-selling episode proved “demoralizing” to longstanding officials and high-status individuals in the Americas (benemeritos) who expected a position in the colonial administration after a lifetime of service (Moreno Reference Moreno Cebrian1977, 80 citing Cespedes del Castillo 1961). That is, “deserving” individuals had to watch how positions were granted to those lacking “merit” (Moreno Reference Moreno Cebrian1977, 75), “competence and probity” (Lohman Reference Lohmann Villena1957, 130), or the “preparation or vocation” to serve (Sanz Tapia Reference Sanz Tapia2009, 43). Although certainly appointment by patronage (as opposed to sales) does not preclude low-quality individuals from entering office, the constraints imposed by social status and the potential for better screening were less likely among those purchasing positions.
Provincial Governors (Corregidores)
Among all positions sold, that of provincial governor, or corregidor, was highly demanded (Sanz Tapia Reference Sanz Tapia2009, 89). This, despite the fact that provincial governorships were not particularly prestigious, there were no guarantees of further appointments after the five-year term in office, and the task of governing the often unruly indigenous population of Peru could cost officials their lives. Moreover, wages paid to officials were a rather small, stagnant, and insufficient amount for the task at hand and the risks involved (Moreno Reference Moreno Cebrian1977).Footnote 6 It is telling that when the Crown tried to improve the performance of governors by the late eighteenth century, the main proposals centered around increasing wages and creating a career-based system so that “good” governors could be promoted to future posts (Moreno Reference Moreno Cebrian1977, 604). These proposals never materialized.
Two main avenues existed to purchase the position of provincial governor.Footnote 7 First, the Council of Indies made public available vacancies with a twenty-day limit in the royal court in Madrid to receive files (Sanz Tapia Reference Sanz Tapia2009, 89).Footnote 8 Interested candidates would send sealed letters with their qualifications and the price offered for the position. The King—through the Royal Chamber—would then assess the merits and bids of candidates and usually chose the highest bidder (Sanz Tapia Reference Sanz Tapia2009, 93). The second, and by far the most frequently taken avenue, was the purchase of positions years in advance of potentially taking office (futuras), in which individuals directly (or via intermediaries) approached the Crown and offered a payment for the position. In these cases, the Crown decided whether or not to accept the offer, yet, it was well known that interested candidates could greatly improve the likelihood of securing the appointment by offering higher prices (Moreno Reference Moreno Cebrian1977, 75 citing Castillo de Bobadilla 1759 I(I), 48).
Although, in theory, the Crown tried to select individuals of proven quality—originally from Spain, of high social status, or military background—it was often willing to undermine its own standards in exchange for money. For instance, some individuals living in the colonies were able to buy positions despite clear conflicts of interest, such as ruling the provinces they resided in, considered inappropriate at the time (Sanz Tapia Reference Sanz Tapia2009, 89). Similarly, although governors were barred from ruling the same province more than once—as a way to prevent corruption—the Crown was ready to make exceptions if rewarded accordingly. Other regulations established that governorships were not to be transferred to a third party. However, during the office-selling period, the Crown agreed to such exchanges. As a result, governor titles became little more than a commodity: appointments were purchased a number of years in advance and it was possible to bequest them or use them as a dowry for whomever married their daughters or nieces. Not surprisingly, individuals serving in the colonies would be more likely to be driven by profit than service (Moreno Reference Moreno Cebrian1977, 71; Sanz Tapia Reference Sanz Tapia2009; Lohmann Villena Reference Lohmann Villena1957).
Rent Extraction
The main attraction for occupying office was that governors served as tax collectors and “justice administrators,” thus exerting considerable leverage among the population to engage in extractive activities. The most common of these activities—outlawed at the time of office-selling—was repartimiento, or the forced sales of merchandise. The practice entailed the forced distribution of goods and credit to the local population at inflated prices, which kept them in heavy and permanent debt.Footnote 9 Under this arrangement, governors allied themselves with merchants in Lima, or in Seville, to obtain goods and resell them at inflated prices without the proper consent of locals (Andrien Reference Andrien1984, 13). Debt repayment was ensured by the fact that the governor was not only the executive, but also the judicial authority in his province (Moreno Reference Moreno Cebrian1977; Baskes Reference Baskes2000); debtors could be flogged, jailed, or have their goods confiscated. The rents obtained via repartimiento are estimated to be at least twice as large as those obtained from forced labor (mita) and head taxes (tributo) from the indigenous population (Golte Reference Golte1980).
Rumors about potential profits from repartimiento guided the bids for a position.Footnote 10 For example, in the case of Peru the province of Ica was considered “first-class” or “high utility” due to the ease in collecting proceeds from illegal trade activities, while that of Cercado (near the capital) was described as yielding “poor returns” (Cebrian Reference Moreno Cebrian1977, 78). Not surprisingly, Ica’s average price was twice that of Cercado. Hence, factors such as circulating currency, taxable markets, and the ease in collecting payments were important in determining the extractive value of certain offices versus others and the governor’s willingness to pay.
Aside from repartimiento, governors were also known to overtax the population when collecting the yearly head tax (tributo) that every indigenous person owed to the Spanish Crown. Governors often extorted amounts above the permitted legal amount, from those exempted (e.g., mestizos), and even forced families to pay for those who were absent due to death or migration. Moreover, funds from local taxes earmarked for hospitals or other public works were often used for the governors’ own purposes (Andrien Reference Andrien1984, 13–14).
Finally, governors also benefited from mobilizing labor in their province for a profit. For instance, they would “lease” workers to neighboring haciendas in exchange for 2/3 of the wage owed to the workers (Andrien Reference Andrien1984). Governors serving in provinces forced to provide labor to the mines (mita) were able to delay implementation of these regulations in exchange for greater gains from repartimiento (Mukherjee Reference Mukherjee2008). Or, they would allow individuals to forego the mita altogether in exchange for a fee. In sum, colonial officials found numerous opportunities to profit from their position.
DATA
The data used in this paper comes from several sources. The time series for the prices of governor positions was coded from primary sources located at the Spanish Colonial Archives (Archivo General de Indias). I collected information on sold and appointed colonial governorships beginning 1673 until 1751, when the last sale was made. During this 78-year period, 62 years or 80% of the time saw the sale of at least one Peruvian province for a total of 518 sales. In terms of appointments, there were 107 governorships assigned this way. Governor titles also provide information about the personal characteristics of the purchaser, such as social status. An example of a title of governor can be found in Figure A.1 and A.2 of the Appendix. All prices account for inflation, using changes in the price of silver (base year = 1673) provided by Arroyo-Abad (Reference Arroyo Abad2005). On average, a Peruvian province was sold in 5,300 pesos, which is around 20 times the yearly wage of a military captain in the Spanish army at the time.Footnote 11
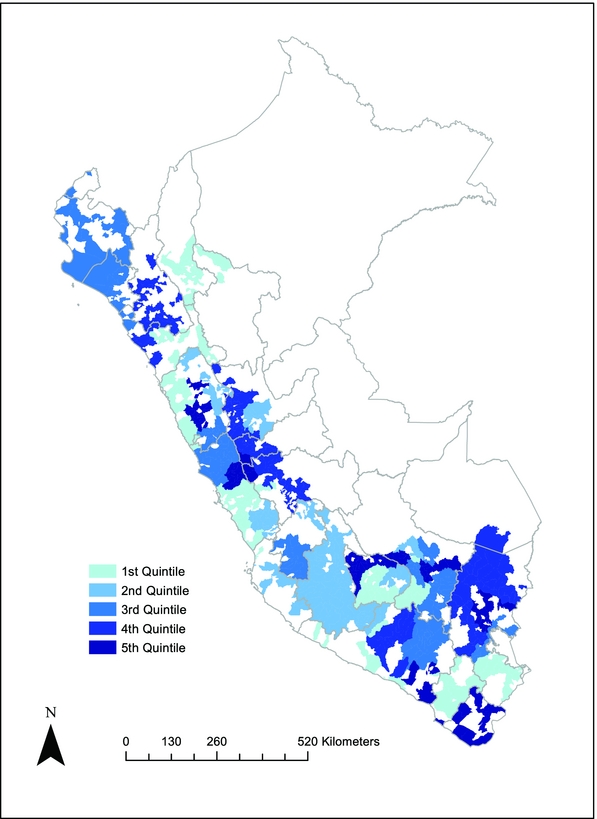
To match colonial and current districts, I use the geographic accounts of Cosme Bueno (Reference Bueno and Valcarcel1951 [1783]), who wrote a detailed description of the parishes in each province and its “annexes,” now districts. Out of around 1850 current districts today, it is possible to match 967 to their colonial counterpart. Only current districts identified as being part of the province in the eighteenth century are included to make sure there are no disparities in the presence of the colonial state at the time. Figure 1 provides a visual representation of the spatial distribution of office prices among contemporary districts in Peru.Footnote 12 As noted, provinces in the highest price quartile do not necessarily cluster geographically.
Current Districts and Office Prices

To account for variation in the selectivity criteria of the Crown, I use warfare in Europe involving Spain as a source of exogenous variation in fiscal needs. WarLength t is coded as the duration of years in a given war, under the assumption that longer wars tend to drain the treasury more. The Nine Years’ War, for example, lasted from 1688 until 1697; hence, 1688 is coded as one, 1689 as two, and so on, and the first year of peace is coded as 0. The online appendix describes the European wars included.
Given the lack of time-varying information on profitability, I use the monetary value of the merchandise assigned to trade with the indigenous population (repartimiento) by the 1754 legalization decree (Moreno Reference Moreno Cebrian1977). The idea is that higher quotas proxy for more repartimiento taking place.Footnote 13 Other potential measures of office profitability (e.g., agricultural suitability, indicator for market hubs, forced labor assignment, and the presence of mines) included in the analysis are described in the Appendix.
Data on district-level public good provision comes from the 2007 census by INEI. Other geographic variables such as latitude, longitude, distance to Lima, and elevation (in meters over sea level) comes from the Ministry of Education. Finally, to look at household consumption, individual political attitudes and ethnic composition, I use the 2013 national household census (ENAHO), which includes a sample of around 14,000+ head of households representing 47 out of the 48 colonial provinces studied.
Because differences in development could be reflecting differences prior to the office-selling episode, I also collected taxation, budgetary, and demographic data from settlements within colonial provinces (reducciones) dating from the first census conducted in Peru between 1571 and 1573 (Miranda Reference Miranda1873). These measures provide a baseline against which to compare subsequent economic changes in Peru’s corregimientos (provinces) plausibly driven by colonial governors.
The proposed channel of persistence is the heightened political conflict prevailing in provinces since colonial times. Therefore, I use province-level data on the number and type of rebellions occurring throughout the eighteenth century (O’Phelan Reference O’Phelan1988; Golte Reference Golte1980). These sources distinguish whether the rebellion is against a provincial governor (corregidor) or against other actors. I also use more contemporary data on conflict collected by the Peruvian Truth and Reconciliation Commission (CVR), which recorded individual level data on the early patterns of violence by Maoist guerrillas during the Peruvian civil conflict (1980– 2000).
Finally, measures of historical income and ethnic composition come from several sources: the 1780 data comes from Vollmer (Reference Vollmer1967); 1827 measures of GDP and population were estimated by De Marzi and Diaz (Reference De Marzi and Diaz2014); the 1876 ethnic composition data comes from the central statistics office (Direccion de estadistica del Peru 1878); and finally, contemporary information on ethnic identity and language comes from the 2013 ENAHO survey.
Additional details of other variables and descriptive statistics are included in the Appendix.
PRICES FOR GOVERNORSHIPS AND EXTRACTION
In this section, I examine whether certain provinces were particularly sought after for extractive purposes. To do so, I start by estimating the change in the prices paid for rent-rich offices when selectivity is low (war) relative to when it is higher (peace) for particularly profitable provinces relative to those less so. Because Peruvian province fundamentals and profitability are unlikely to vary with European wars—and buyers could improve the likelihood of securing a position by offering higher prices—substantial price increases are a sign of greater demand for office.
The empirical analysis thus follows a difference-in-differences approach by interacting the cross-sectional variation in provincial profitability with plausibly exogenous time-variation in the likelihood of “low-quality” types to successfully bid for a position during wars. Because European wars were fiscally onerous to the Spanish treasury, the Crown was more likely to trade off “quality” for revenue at this time relative to others. More importantly, given the onset and length of wars is largely driven by geopolitical calculations in Europe they are thus less susceptible to strategic timing: sales are driven by emergency needs rather than by other considerations. In terms of cross-sectional variation, I use the repartimiento quotas assigned to each province in 1754 which, for many, was the main attraction behind serving in the colonies.
By comparing provinces with high versus low repartimiento during war and peace times, it is possible to capture shifts in the willingness to pay not driven by province fundamentals. Furthermore, competing explanations that either do not vary greatly within a province over time (e.g., prestige, location) or would not be different for positions with greater access to rents precisely at times of greater scrutiny or not (e.g., altruism, career benefits), are also unlikely to be driving the results. I thus estimate the following:
 $$\begin{eqnarray}
Log(Price_{ijt})&=&\alpha _{ij}+\gamma _{t}+\beta (Repartimiento_{ij}\times War_{t})\nonumber\\
&&+\,\mathbf {X}_{ijt}+\mathbf {W}_{jt}+\epsilon _{ijt},
\end{eqnarray}$$
where Log(Price ijt) represents the real price paid for province i in bishop region j in year t; αij and γt captures provincial and year fixed effects, respectively. Xijt includes time-varying controls such as anti-governor rebellions; Repartimiento ij represents either a continuous measure of repartimiento quotas or an indicator for provinces above or below the median of assigned quotas (HighReparto); WarLength t is either the duration of war in a given year, or the simple presence of international conflict involving Spain (War t). Finally, Wjt captures yearly trends for each of the seven different bishop regions to account for differential price trends.
In terms of standard errors, it is important to account for serial correlation in office prices within a province. Because the number of clusters (44 or 48) is not large enough relative to the vector of fixed effects, time effects, and differential trends, standard errors clustered at the province level may be less credible. Instead, I compute significance levels using wild cluster bootstrap with the null hypothesis imposed as suggested by Cameron, Gehlbach, and Miller (Reference Cameron, Gelbach and Miller2008).
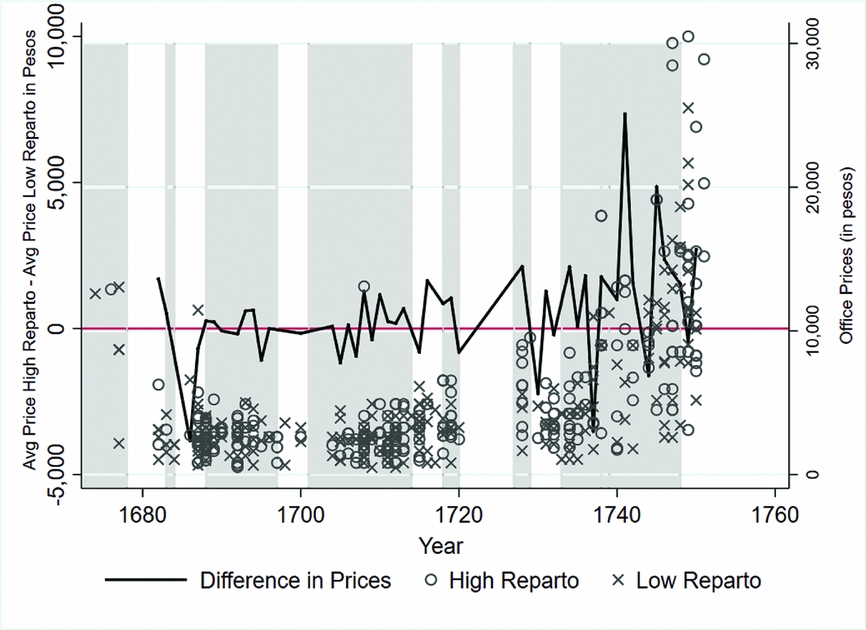
Figure 2 provides some descriptive evidence by showing the year to year difference in average office prices for provinces with high and low repartimiento throughout the period. As noted, price differences are likely to be larger (more positive) during wartime periods (shaded) and smaller during peace (more negative). However, given some exceptions are visible, it is important to examine this relationship more systematically.
Year to Year Price Differences in High versus Low Repartimiento Provinces. War periods shaded.

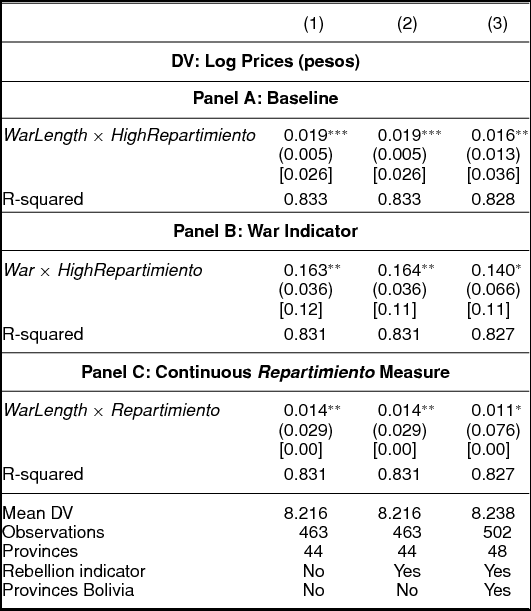
Estimates from Table 1 show that provinces with greater potential for profit via repartimiento fetch higher prices relative to other provinces, particularly when the Crown is less selective (during war). In terms of magnitude, the coefficient of 0.019 in column 1, Panel A, suggests that for provinces with a high repartimiento quota (above the median), an additional year at war leads to an increase in the prices of these provinces of around 2%. Considering the average war lasts about five years and the mean price of a Peruvian province is 5,300 pesos, this represents approximately 500 pesos or two times the yearly wage of a military captain in the Spanish army. This estimate is consistent with findings from Panel B column 2, showing how more profitable provinces exhibit 16% higher prices during war times than peace.Footnote 14 However, because not every year saw the sale of provinces both above and below the median of the repartimiento quota,Footnote 15 Panel C instead uses the continuous measure of repartimiento with similar results. In general, estimates do not change much when including an indicator for whether the province had a rebellion in the year of sale (column 2), suggesting that their impact might have already been priced-in.Footnote 16 Results also remain similar but less precise when including in the sample four provinces that today are part of Peru but used to be part of Bolivia.
Office Prices and Repartimiento

p-values in parentheses. Cluster-robust wild-bootstrap p-values in brackets. All specifications include province FE, year FE, and time-trends for individual bishop regions. Bolivia provinces are four provinces ruled by the Audiencia of Charcas at the time (not Lima) but currently part of Peru. *** p < 0.01, ** p < 0.05, * p < 0.1
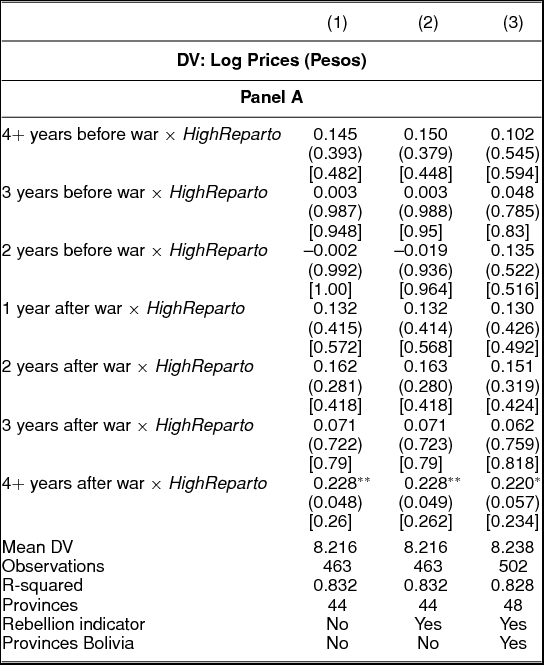
Parallel Trends. An important identifying assumption is that in the absence of war, price trends are parallel among provinces with high and low repartimiento quotas. To validate this assumption, I employ a strategy similar to the event study methodology by estimating the following:
 $$\begin{eqnarray}
&&\hspace*{-8pt}\scriptsize{ Log(Price_{ijt})=\alpha _{ij}+\gamma _{t}}\nonumber\\
&&\hspace*{-8pt}\quad\scriptsize{+\,\!\!\!\!\hspace*{-12pt} \sum_{{\tau \in \lbrace -4+,-3,-2,0,1,2,3,4+\rbrace}}{\!\!\!\!\!\!\!\!\!\!\!\!\!\!\!\!\!\!\!\!\beta _{\tau }*\;I_{\tau }*}\;\; HighReparto_{ij}+\mathbf {x}_{ijt}+\mathbf {w}_{jt}+\epsilon _{ijt}}\nonumber
\\
\end{eqnarray}$$
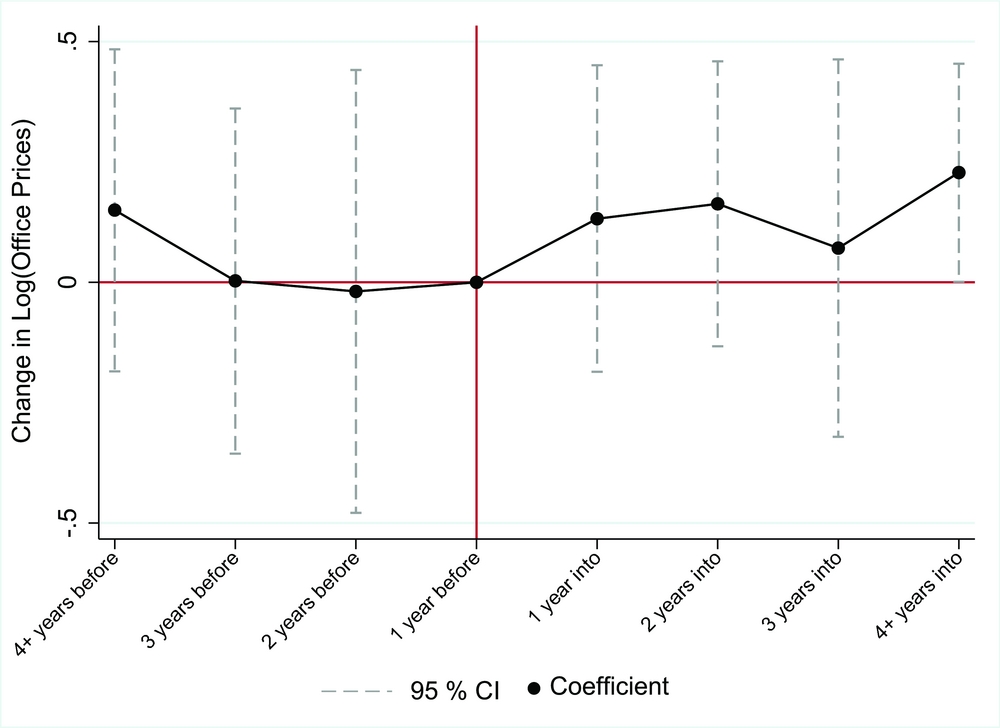
where I τ is a set of seven dummy variables equal to 1 if τ years had passed since the start of war (−4 + ≤τ ≤ 4 +), where −4+ refers to more than 4 years before a war and 4+ refers to more than 4 years into the war. The year immediately before a war is left as the comparison group and assigned zero in Figure 3 for visualization purposes. If the coefficient of the periods prior to a war (β−4 +, β−3 and β−2 ) are not significantly different from zero, the parallel trends assumption is likely to hold.
Coefficients from Table 2

Results presented in Figure 3 and Table 2 show that prices in provinces with high repartimiento versus others did not significantly differ in the years immediately before a war, but that the divergence actually took place during war times as can be seen in the increase in the size of the coefficient in the first year of war and remaining positive in subsequent years. It is only after more than four years at war that the difference exhibits greater statistical precision.
War and Office-Prices

p-values in parentheses. Cluster-robust wild-bootstrap p-values in brackets. All specifications include province FE, year FE, and time-trends for individual bishop regions. Bolivia provinces are four provinces ruled by the Audiencia of Charcas at the time (not Lima) but currently part of Peru. *** p < 0.01, ** p < 0.05, * p < 0.1
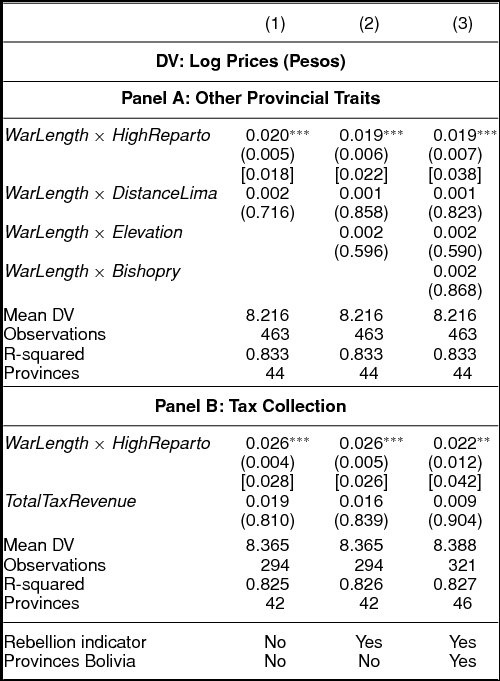
Time-Varying Confounders. In addition to checking for pretreatment trends, it is important to rule out other factors unrelated to extraction that would be driving the increase in office prices during wars in Europe. To do so, I interact traits such as the distance of the province to the capital (Lima), the elevation of the province, and an indicator for the presence of a bishop seat with the length of war to examine the stability of the baseline coefficients. Table 3 shows that the combined effect of repartimiento quotas and wartime in Europe is still the main determinant of the increase in office prices rather than reflecting “better” provinces in terms of location, elevation, distance to capital, or a bishop seat. Furthermore, Panel B shows that the inclusion of time-varying measures of revenue collection at the caja levelFootnote 17 change little the baseline estimates. The latter reduces concerns that higher prices are mostly driven by reported fiscal revenue.
Office Prices and Repartimiento—Additional Time-Varying Controls

p-values in parentheses. Cluster-robust wild-bootstrap p-values in brackets. All specifications include province FE, year FE, and time-trends for individual bishop regions. Bolivia provinces are four provinces ruled by the Audiencia of Charcas at the time (not Lima) but currently part of Peru. *** p < 0.01, ** p < 0.05, * p < 0.1
Robustness. Other robustness checks allow me to assess the sensitivity of the baseline results. First, in Table A.3 of the Appendix, I provide a nonparametric way of evaluating the relationship of interest by splitting the continuous measure of repartimiento quotas into quartiles and interacting them with the length of European wars. As noted, coefficients become larger and more precise the higher the value of the conditioning variable, consistent with the findings from the linear models.
Second, in Table A.4 I limit the sample to only those conflicts in which Spain was theoretically less susceptible to manipulate the onset and length of wars. Specifically, “succession” wars, where the timing is driven by the sudden death of a monarch.Footnote 18 Results show that the findings are not driven by potentially endogenous entry into wars.
Given the main effect is an interaction term, it is susceptible to potential outliers. Therefore, I estimate the preferred specification (column 2 of Table 1) while leaving out two provinces at the time (out of 44) to assess the sensitivity of the results to changes in the sample. As shown in Figure A.5 of the Appendix, the t-statistic is always well-above conventional levels of statistical significance and coefficients remain similar to the baseline. An additional exercise in Table A.5 shows that the result is robust to including flexible province-specific trends (as opposed to regional ones) to account for potential omitted variables.
In sum, results show that buyers paid more for more profitable positions during war times relative to peace, the key question is then: Why?
Mechanism: Negative Selection of Colonial Officials?
Does the increase in office prices reflect a change in the type of officials in provinces with greater opportunities for extraction versus others? Although measuring “quality” in this context is no easy task, I provide evidence based on one dimension: the social status of purchasers. That is, whether they belong to the nobility (Duke, Marquis, Count, etc.), to a nobility order (Knight of the Santiago or Calatrava order), or have pursued a career in the army (captain, sergeant, among others).
As discussed more extensively above, in eighteenth century Spain social status was a sign (if imperfect) of economic status, social capital and connections to the royal court in Madrid, as well as of lineage and a family reputation.Footnote 19 In fact, the laws governing the Indies established that individuals of high-social status were the best suited to serve as corregidores in the colonies (Lohmann Villena Reference Lohmann Villena1957, 100). In line with this, Panel A of Table A.6 shows that the Crown preferred to appoint those with military careers or nobility titles, whereas those lacking social status were more likely to access office via purchase. Such a preference is optimal in a context of poor information and monitoring since it allows the monarch to “police behavior” by choosing individuals with higher reputation costs in the form of social capital (Allen Reference Allen2005, 161). Being found in contempt of the Crown could ostracize members across generations thus reducing social capital and economic opportunities.
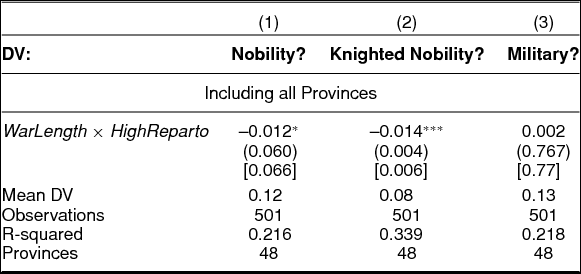
To examine this possibility more formally, Table 4 explores whether provinces with high repartimiento are significantly less likely to be purchased by those with nobility and military titles during war times compared to peace. Column 1 shows that an additional year at war decreases in about 1.4% the likelihood of a titled governor, particularly from the knighted nobility (caballeros). Given the average war is 4.7 years, this represents a 7% reduction. Estimates for those with a military career (column 3) are small in magnitude, and less precisely estimated likely due to the breadth of the category. Figure A.6 in the Appendix provides additional graphical evidence of this relationship.
Office-Selling and Social Status of Corregidores

p-values in parentheses. Cluster-robust wild-bootstrap p-values in brackets. All specifications include province FE, year FE, and time-trends for individual bishop regions. Bolivia provinces are four provinces ruled by the Audiencia of Charcas at the time (not Lima) but currently part of Peru. *** p < 0.01, ** p < 0.05, * p < 0.1
These estimates are broadly consistent with historical accounts describing how office-selling allowed “worse” individuals to enter office (Sanz Reference Sanz Tapia2009, 43; Lohmann Villena Reference Lohmann Villena1957, 130; Solorzano and Pereira cited by Moreno Reference Moreno Cebrian1977, 71) and other work in contemporary settings.Footnote 20 According to Andean historians, repartimiento only became widespread by the end of the seventeenth century, precisely when office-selling started (O’Phelan Reference O’Phelan1988, 90; Lohmann Villena Reference Lohmann Villena1957, 130). Moreover, contemporary reports to King Ferdinand VI (the “Secret News of the Americas”) unequivocally linked office-selling to the extractive behavior of corregidores regarding repartimiento activities (Ramos Gomez Reference Ramos Gomez1985, 174–5).
An alternative explanation for these results is that individuals buying profitable provinces during wars may be of higher quality on other dimensions (e.g., sheer intelligence, or managerial capacity) even if lacking social status. Yet, it is unclear why these individuals would systematically purchase places with higher repartimiento and not other (more prestigious) offices. Similarly, it is unlikely that variation in the social status of colonial governors is driven by a change in the pool of potential governors due to wars. For this possibility to be driving the results, war times would need to selectively affect the pool of officials available for high repartimiento provinces in Peru but not for low ones—which, again, is difficult to envision.Footnote 21 Finally, as will be discussed, antigovernor rebellions were much more likely in provinces ruled by “worse” governors during the office-selling period than when their rule was over, consistent with worse governance while in office.
Alternative Explanations
In addition to the above, it is important to rule out other explanations for the increase in office prices such as (1) career concerns and altruism, (2) local economic booms, (3) wages and compensation differentials, (4) other forms of extraction (5) time-varying returns to office, (6) tax theft as opposed to extraction, and (7) selective sales.
First, it is possible that governing certain provinces brings about career benefits within the royal bureaucracy that would justify paying disproportionate prices for becoming an official. Yet this is unlikely for three reasons: first, as shown in Table 3, the most prestigious positions (where the bishop resided) were not particularly valued during war times. Second, since office-selling was an emergency and temporary measure, purchasers were not entitled to any future appointment after the 5-year term and were not considered members of the royal bureaucracy. Once office-selling stopped altogether, the Crown quickly filled vacant positions with individuals whom the Crown considered “trustworthy,” generally of higher social status (military, or nobility) as shown in Panel B of Table A.6. Finally, analyzing the career paths of all those serving throughout the eighteenth century in the level of government above that of corregidor (Lohmann Villena Reference Lohmann Villena1974)—minister of the Audiencia in Lima—shows that only two out of 147 ministers had ever served as a corregidor of a Peruvian province. Alternatively, it is possible that governors are altruistic and want to help the Crown during difficult times (e.g., fiscal crises). Yet, altruistic types are unlikely to be paying disproportionately more for positions in provinces with greater profit potential.
Second, it is possible that individuals may be timing their purchases to coincide with economic booms in the province. Yet, because the specific year corregidores entered office is uncertain, this is unlikely. For instance, travel delays to the Americas and/or shorter terms due to sickness or death of sitting governors led to uncertainty about when exactly they would occupy office. Furthermore, there is no evidence that the increase in office prices is reflecting changes in the economic attractiveness of Peruvian provinces during European wars as measured by silver production and inflation (Table A.7) or reflecting a worsening of outside options in Spain due to war (Table A.8).
A third possibility is that prices are merely reflecting higher wages to be obtained in office. While it is true that high pay attracts high-quality officials (Ferraz and Finan Reference Ferraz and Finan2015; Dal Bo, Finan, and Rossi Reference Dal Bo, Finan and Rossi2013), wages were low and stagnant during the period. Furthermore, Table A.9 shows that the wages paid during office are not driving the differential increase in prices. Instead, buyers paid hefty sums to govern backwater provinces—provided repartimiento was high—despite wages being low and risks high.
Fourth, given repartimiento is not the only form of extraction possible, Table A.10 include other potential correlates with extraction such as forced labor regulations (mita), mining, and sheer population size interacted with war length. While plausible, most of the variation in prices is still driven by the repartimiento quota and not by these other factors. For instance, Table A.11 includes measures such as the presence of market-hubs (Panel A) and agricultural suitability (Panel B) to show that the presence of these alternative measures do increase the willingness to pay for office. Yet, once I include the repartimiento quota measures, the effects of the latter are larger and more precisely estimated.
Fifth, excessive extraction in early times might affect later returns to extraction and other economic activities—which would be imprecisely captured by the time-invariant repartimiento variable. Although this would lead to more measurement error, in Table A.12 I include a time varying proxy for a province’s extractive value based on the taxes collected from natural resources (gold, silver, and mercury), head taxes (tribute), and sales taxes (alcabala). Results show that, if anything, coefficients are larger once accounting for these proxies of resource potential although less precisely estimated due to uneven data availability. These findings also show that it is unlikely that officials sought these positions not to extract from the population but to cheat the Crown from owed taxes. In fact, the Crown mandated all governors to pay a bond or name a creditor who would cover the head taxes that the Crown expected (fianza). Taxes were specified in advance according to the previous census, set in the contract, and settled even before entering office. Furthermore, since the time to assume office was uncertain, revenue growth at the time of purchasing office may be an unreliable reference point for purchasers.
The final concern is that of selective sales or left-censoring; that the Crown is only selling positions that will command a higher price in the market (e.g., high repartimiento provinces). Although this type of strategic behavior would only downward bias my estimates, in Table A.13 of the Appendix I show that there are no differences in the likelihood of selling versus appointing offices in provinces with high repartimiento quotas during lengthy wars (Panel A) or war periods more generally (Panel B).
THE LONG-RUN IMPACT OF COLONIAL GOVERNORS
Given that high office prices are likely reflecting a different type of colonial governors—with less social and loyalty constraints and greater incentives to recoup their investment—how did their rule impact the long-term development outcomes of these provinces? A priori, the answer is not obvious. On the one hand, the presence of these rulers may have had no impact on economic fundamentals or in the processes of agglomeration and increasing returns to colonial settlements (Maloney and Valencia Reference Maloney and Valencia2016). On the other, a temporary shift in the type and incentives of colonial officials may have led to profound and persistent institutional and governance disparities among provinces in Peru, leading to markedly different development paths.Footnote 22 In this section, I explore how differences in the prices paid for office during war versus peace—as a proxy for these different types of governors—relate to subnational economic patterns across Peru.
The main threat to identify the effect of these “bad” colonial officials is omitted variable bias—or the presence of factors rendering certain offices more attractive in the eighteenth century for “worse” officials (reflected in office prices) and impacting long-run development outcomes today. For instance, provinces with greater agricultural suitability may be poorer today, not because they were governed by “worse” colonial officials, but due to changes in the returns to agricultural activities in the last century. To better account for these potential confounders, I focus on the variation in office prices stemming from times of low (war) versus higher (peace) selectivity by the Crown. By including both measures of prices, it is possible to control for fixed and slow-changing observable and unobservable traits that may affect development today but would not be different during war and peace times in Europe. This way, the price gap more likely reflects shifts in the selectivity criteria of the Crown and not other factors. The baseline equation for the regression specifications is thus given by
 $$\begin{eqnarray}
y_{ip}&=&\alpha +\beta _{1}\cdot \log (PriceWar_{p})\nonumber\\
&&+\beta _{2}\cdot \log (PricePeace_{p})+\mathbf {z}_{ip}+e_{ip},
\end{eqnarray}$$
where y ip represents contemporary development outcomes in district i and province p. The main sample comprises 967 current districts belonging to 47 colonial provinces.Footnote 23 Log(PriceWar p) and Log(PricePeace p) are the average and the minimum price paid for province p during war and peace periods between 1673 and 1751, respectively. All prices are weighted by total population size in 1754 to account for scale effects. Zip includes district level pre-treatment controls (elevation, agricultural suitability index—based on the slope, soil, and climate—latitude, longitude, and distance to the capital). In all specifications, I report p-values from clustering the standard errors at the level of the province to account for arbitrary correlation across districts that belong to the same province. However, because the number of clusters might be a concern (47), I also report significance levels using wild cluster bootstrap t-statistics (Cameron, Gehlbach, and Miller Reference Cameron, Gelbach and Miller2008).
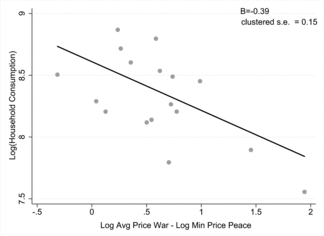
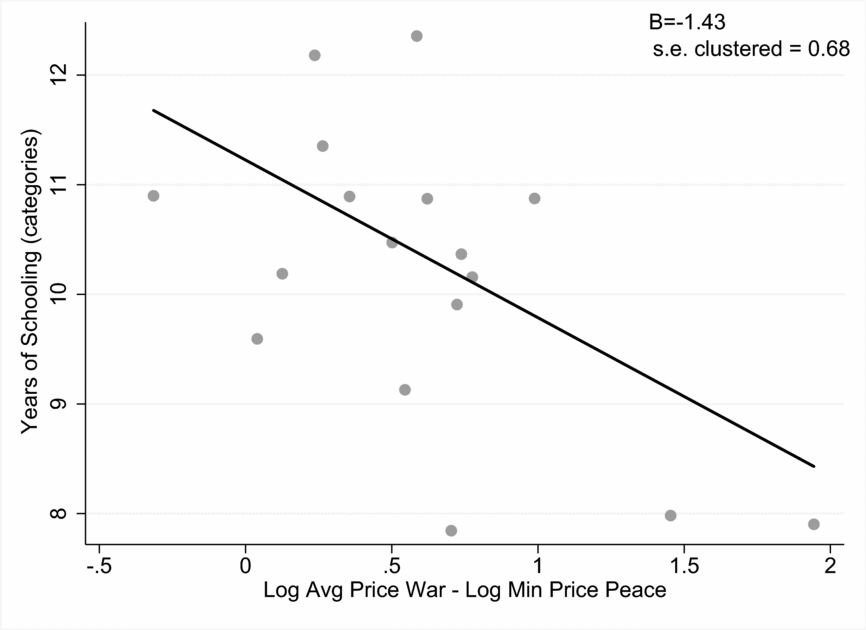
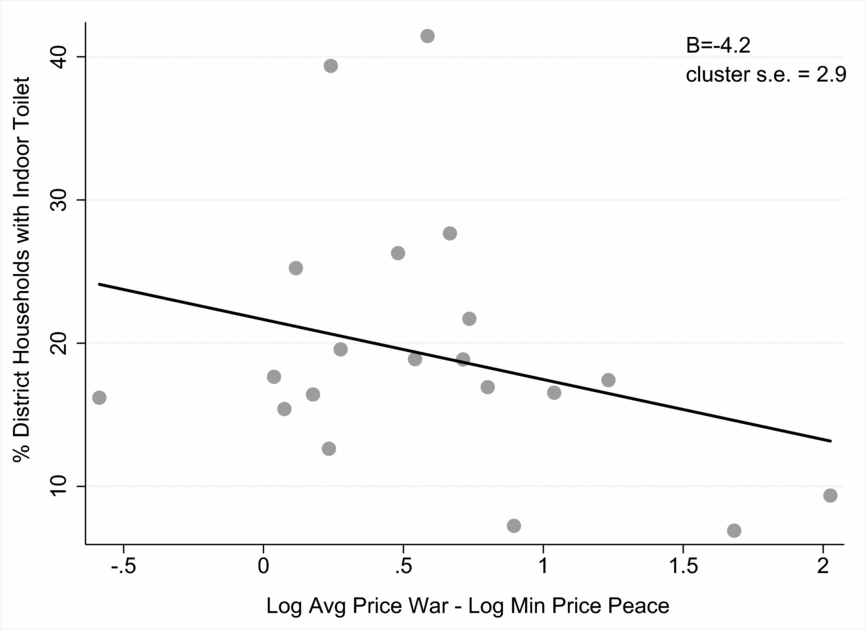
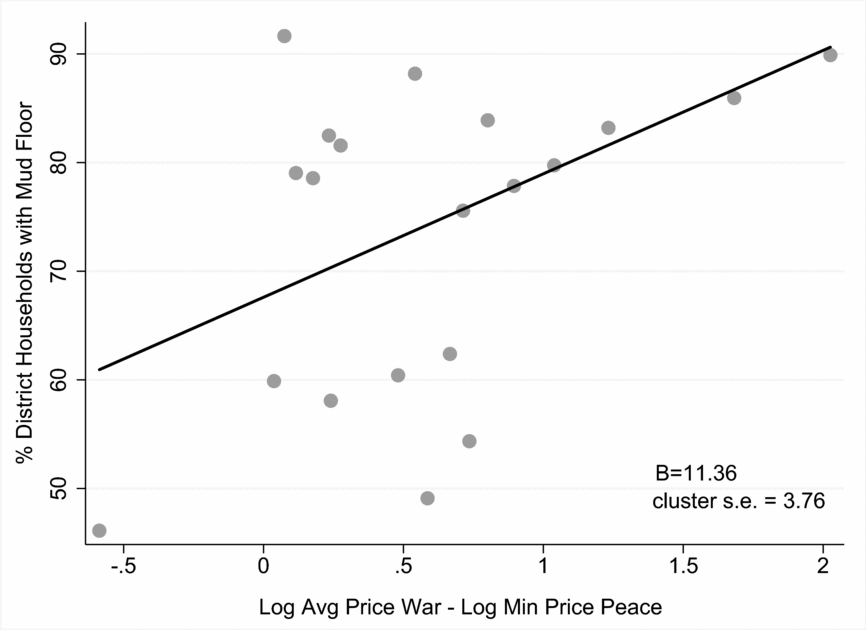
To start, Figures 4 to 7 provide some graphical evidence (binned scatter plots) of the impact of higher office prices during war versus peace on key development outcomes. For most outcomes, the greater difference in prices between war and peace time prices lead to worse development outcomes today.
HH Consumption

Years of Education (Categories)

% District HH Indoor Toilets

% District HH Mud Walls

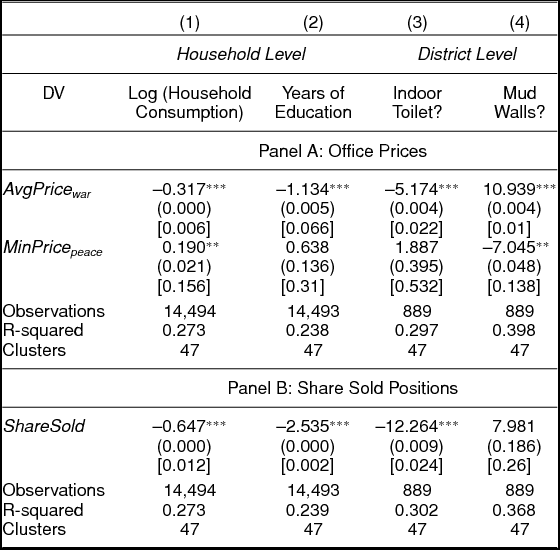
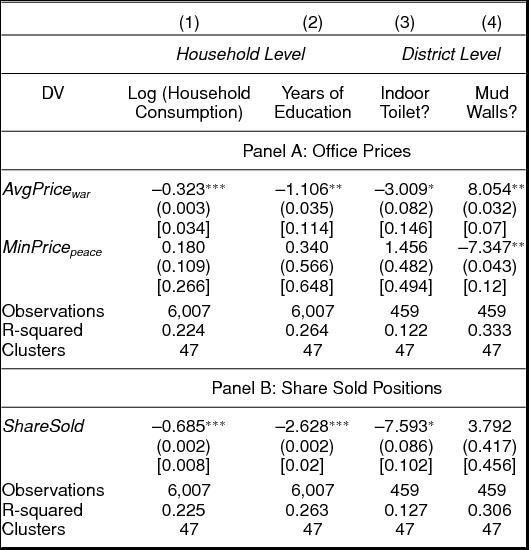
Main Estimates. Table 5 reports the OLS estimates of Equation (3). Across a number of development measures, it is clear that higher prices paid during wars are associated with worse household or district outcomes while controlling for the minimum price (Panel A) it drew during peace.Footnote 24 In contrast, higher prices during peace times correlate with better development outcomes (albeit generally less precisely estimated). In terms of magnitude, estimates from column 1 suggest that a 10% increase in the average price paid during war leads to a 3.2% reduction in household consumption. The same pattern is visible in years of schooling measured in categories (column 2), in the district-level share of households with indoor toilets (column 3) and in the share of households with mud walls (column 4). Finally, in Panel B I include the share of governors between 1673–1751 (weighted by 1754 population) that were sold, as an alternative measure, since it approximates the length of rule by these governors. Results using this latter measure are consistent with those of Panel A. Additional results show that the higher prices paid during war also lead to a reduction in electricity, water provision, and other educational indicators. The latter is not surprising given the strong correlation across development outcomes.Footnote 25
Baseline: Office Prices and Contemporary Development Outcomes

Clustered robust p-values at the province level in parentheses. Cluster-robust wild-bootstrap p-values in brackets. All specifications include elevation, distance to Lima, latitude, longitude, and agricultural constraints. Household specifications also include number of adults, infants, and kids in the household, age, and gender. Prices and share of sold positions are weighted by population size in 1754. *** p < 0.01, ** p < 0.05, * p < 0.1
Identification. The main identification assumption is that there is no other reason, apart from the gap in office prices between European war and peace times, that is driving the divergence in economic development among former Peruvian colonial provinces. To examine the plausibility of this assumption, I start by looking at the correlation between the jump in office prices during war and peace in Europe and a host of key fixed or slow-moving provincial traits likely to impact development in the long run.Footnote 26 If the gap in office prices is reflecting some persistent provincial trait, we should expect a significant relationship between these.Footnote 27 Yet, Table A.14 shows how the office price gap is unrelated to traits such as elevation, agricultural suitability, distance to Lima, latitude, or longitude. In addition, Table A.15 includes other economic and demographic variables at the time—size of the indigenous population, the presence of colonial market hubs, colonial mines, forced labor drafts, as well as the repartimiento quota itself—which may reflect some factor not fully captured by geographic traits. As noted, there is very little association between these traits and the gap or difference in office prices.
To complement these results, Tables A.16 to A.18 show that the gap in office prices is unrelated to characteristics preceding the sales period such as population, tax rates, and number of taxed individuals (Table A.16), administrative capacity (Table A.17), or to the demographic composition of the population (Table A.18).Footnote 28
Altogether, this battery of tests indicates that there is no clear confounding variable that correlates with the gap in eighteenth century office prices and would impact development today.Footnote 29 Rather, these findings are consistent with the gap in office prices reflecting temporary shifts in the selection process of colonial governors occurring in Spain during European wars.
Robustness. In addition to the above, Table A.21 of the Appendix shows that these results are not driven by the measure of office prices used. Panel A documents a negative and statistically significant effect of the average price paid during wars on contemporary household consumption and education while controlling for the average price paid during peace. Results change little if instead one controls for the first price paid during peace (Panel B).
Additional results in Table A.22 examine the robustness of these findings to including other provincial traits, such as measures of forced labor (mita), mining, presence of bishop seats, provincial wages, and the size of the indigenous population in 1754. If anything, the inclusion of these controls leads to larger coefficient estimates than the baseline. For instance, Panel A shows that the effect remains very similar to baseline estimates after accounting for measures of forced labor (mita). The reason may lie in the fact that forced labor regulations were ubiquitous across Peru, leaving ample room for subnational differences in colonial governance.
Finally, Table A.23 presents the results from a placebo exercise, whereby 47 randomly drawn groups of Peruvian districts (equal to the total number of historical provinces) are assigned office prices in alphabetical order to make sure the results are not simply driven by spurious correlation.
Neighboring Districts. As an additional robustness check, I exploit the fact that the colonial governors’ “type” changed discretely with the provincial border: on one side, all districts of a province were subject to a particular governor, while on the other, all districts were ruled by a different one. Yet, border districts share a number of observable and unobservable characteristics (e.g., geographic features, disease environment, markets). Indeed, a comparison of key geographic, demographic, administrative, and taxation covariates in Tables A.24 to A.27 corroborate this intuition.Footnote 30
Table 6 below presents the estimates of Equation (3) using the sample of border districts. Estimates show that an increase of 10% in the prices paid during war times leads, on average, to a 3.2% reduction in household consumption. This result is encouraging, given that Peruvian districts are relatively small and the estimated coefficients for household consumption and education are very similar to the ones obtained with the whole sample. The latter suggests that omitted variable bias may be a lesser concern. However, the lower number of observations reduce the size and precision of the estimates when using district-level data.
Office Prices and Contemporary Development: Neighboring Districts

Clustered robust p-values at the province level in parentheses. Cluster-robust wild-bootstrap p-values in brackets. All specifications include: elevation, distance to Lima, latitude, longitude, agricultural constraints (soil, climate, slope). Household specifications also include number of adults, infants, and kids in the household, age, and gender. Prices and share of sold positions are weighted by population size in 1754. *** p < 0.01, ** p < 0.05, * p < 0.1
Spillovers and Sorting (Migration). A crucial assumption behind this strategy is that there are no spillovers from the rent-extracting activities of one governor affecting the districts of the neighboring province. While unlikely—there are few records of intergovernor conflicts—this would only bias against finding any difference among districts from different provinces.
A different concern is that of migration, or that individuals might flee highly extractive areas and resettle in less extractive ones. While this mechanism is certainly plausible, this migration likely took place with more liberal colonial policies in the late eighteenth century and with independence (1827).Footnote 31 In fact, during the office-selling period, the ability of individuals to relocate was limited. The market of land for the indigenous population was practically nonexistent, and migrating to a different ayllu or community imposed a cost on that community to share an already small plot of land. As shown in Table A.28 of the Appendix, the available provincial level measures of internal migration from 1754 show no disproportionate number of migrants or forasteros in low-price provinces.
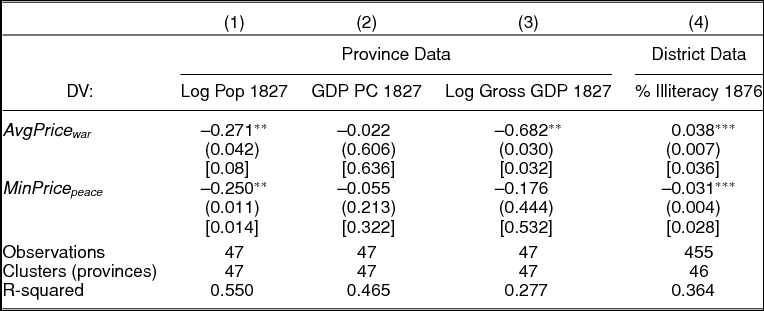
Timing of Gap. While the results above quantify the contemporary gap in development outcomes, they do not show when the divergence started. Evidence from the first census conducted after independence (1827) presented in Table 7 already documents a difference in gross total income and population size (rough proxies for economic development) for provinces with higher prices paid in the eighteenth century. Although this data is calculated using the estimated income per capita per ethnicity at the time (Indigenous, Spanish, or Mestizo),Footnote 32 it provides some indication of the development paths of these provinces at the start of independent life. As shown in column 3 of Table 7, an increase of 10% in the average price paid for the province during war times in the eighteenth century is associated with a decrease of 6.8% in the gross provincial income by 1827.
Office Prices and Timing of Economic Divergence: 1827 and 1876 Census

Clustered robust p-values at the province level in parentheses. Cluster-robust wild-bootstrap p-values in brackets. All specifications include: elevation, distance to Lima, latitude, longitude, agricultural constraints (soil, climate, slope). Prices are weighted by population size in 1754. *** p < 0.01, ** p < 0.05, * p < 0.1
To further document the persistence of this economic gap in the nineteenth century, column 4 also looks at district-level illiteracy rates—which tend to correlate with economic development—50 years after independence (1876). As shown, in the late nineteenth century provinces with higher wartime prices exhibit a higher illiteracy rate, which would remain throughout the following century. Overall, it appears that office prices are related to worse development outcomes starting at least since 1827 and continuing over time. In the next section, I investigate why office prices may have had such a lasting effect.
Channels of Persistence: Political Conflict and Cultural Assimilation
For these type of colonial rulers to have a long-lasting impact on development outcomes, they must have led to persistent changes in slow-moving factors, which hindered the economic prospects of these regions relative to others. Since these governors are unlikely to alter fixed geographic characteristics as shown in the multiple checks, I focus on how their rule could have fostered different forms of “resistance” with long-term development consequences.Footnote 33 First, violent resistance in the form of spontaneous uprisings; and second, a reluctance to culturally assimilate as a response to extractive policies and low perceived returns from adopting the “Spanish-Mestizo” culture.
Political Conflict
To determine the impact of these governors on violent resistance, I use detailed data on local rebellions in eighteenth century Peru. Uprisings were common during colonial rule, caused by what was perceived as “excesses” and lack of proper justice administration. For instance, governors were known to rely on violent mechanisms (or threat of) to arbitrarily impose excessive taxation, coerce labor, and collect undue debts from repartimiento (Andrien Reference Andrien1984; Moreno Reference Moreno Cebrian1977; Golte Reference Golte1980; O’Phelan Reference O’Phelan1988). O’Phelan (Reference O’Phelan1988) provides a list and brief description of all known rebellions between 1708 and 1780 in Peru. She describes how, in 1726, in Ayabata (Carabaya) the indigenous population stoned to death governor Don Luis Cerro. In Cajamarca, both the indigenous and mestizo population stoned the local governor to rescue a prisoner. In 1731, Cajamarca also saw an uprising against the governor because he had included mestizos (normally exempt) in his forced sales or repartimientos. And so on. Yet, rebellions were not only against governors: local priests and other colonial authorities also faced revolts, typically associated with their tax- or tithe-collection activity. This suggests that high extraction may lower the rebellion threshold such that when additional tax burdens are imposed (e.g., tithes), uprisings are more likely.
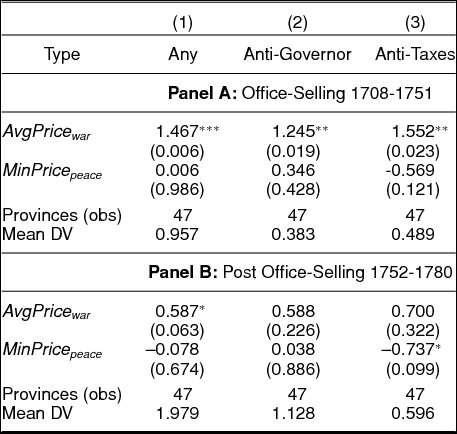
Based on this data, I estimate Equation (3) using as dependent variable the number of colonial rebellions between 1708–1780, the years for which there is comprehensive data. Due to the importance of population size in determining conflict, I include it as an additional control in all specifications and use a negative binomial model to account for the count nature of the dependent variable.Footnote 34 Estimates from Table 8 show that provinces with differentially higher prices experience more spontaneous rebellions against governors during the office-selling period (Panel A) and less so afterward (Panel B). Column 2 in Panel A shows how an increase in the average price per capita during war of 1 log unit (approximately one standard deviation) leads to a difference in the logs of expected counts of 1.2. That is, holding all else constant, provinces with a 1-unit increase in the average office price paid during war are expected to have a rate 3.47 times greater for anti-governor rebellions.
Office Prices and Violent Uprisings

Cluster robust p-values in parentheses. All specifications include: elevation, distance to Lima, latitude, longitude, and agricultural constraints (soil, climate, slope) as well as population size for 1754. Prices are weighted by population size in 1754. *** p < 0.01, ** p < 0.05, * p < 0.1
One concern with these estimates is whether protests would directly affect prices (reverse causality). For instance, it is plausible that buyers would discount the probability of facing an uprising when bidding for office, leading to lower prices paid for these provinces. Yet, this runs against the hypothesized effect—given more protests would reduce prices—suggesting these results may represent a lower bound of the overall effect of prices on protests.Footnote 35
While results from Table 8 exploit cross-sectional variation in protests for the office-selling period and afterward, it is also possible to examine how within-province variation in governance in the period during and after office-selling relate to uprisings, using the following panel specification:
 $$\begin{eqnarray}
AntiGovRebellion_{ijt}&=&\alpha _{ij}+\gamma _{t}+\beta _{1}(SalesPeriod_{ijt}\nonumber\\
&&\times \log (PriceWar_{ij}))\nonumber\\
&&+\,\beta _{2}(SalesPeriod_{ijt}\nonumber\\
&&\times\, \log (PricePeace_{ij}))\nonumber\\
&&+\,\beta _{3}(SalesPeriod_{ijt})\nonumber\\
&&+\,\mathbf {w}_{jt}+\epsilon _{ijt},
\end{eqnarray}$$
where AntiGovRebellion ijt is an indicator for whether an anti-governor uprising took place. SalesPeriod ijt is equal to 1 the years a given province is likely governed by a colonial official entering during the office-selling period and becomes 0 with the first governor appointed after sales end. Since the number of times an office is sold vary per province, this staggers the entry of their post office-selling replacement. SalesPeriod ijt is then interacted with log (PriceWar ij) and log (PricePeace ij) which are the same variables described in Equation (3). As an alternative specification, I also include the weighted share of positions sold in the province. All other covariates are the same as those outlined in Equation (1) with the exclusion of the rebellion indicator.
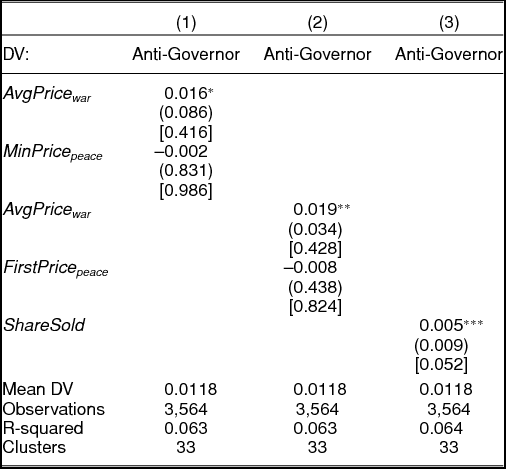
Table 9 presents the results from estimating Equation (4). Consistent with the cross-section (Table 8), coefficients from columns 1 to 3 show that provinces with either higher prices during war, or more positions sold, exhibit a higher likelihood of rebellions during office-selling compared to the period afterward. Specifically, the coefficient in column 1 suggests that a 10% increase in the average price increases the likelihood of a rebellion in around 13% (evaluated at the mean likelihood of an uprising in a given year) in the period ruled by office-selling governors compared to the one afterward. One drawback of this exercise is that for a number of provinces it is unknown the exact year when the post-office-selling replacement was appointed, thus reducing the sample of provinces included and overall estimate precision.
Office Prices and Rebellion Onset (1708-1780)

p-values in parentheses. Cluster-robust wild-bootstrap p-values in brackets. All specifications include province FE, year FE, and time-trends for each bishop region. *** p < 0.01, ** p < 0.05, * p < 0.1
Although these rebellions were relatively small and highly localized, their presence signaled a general discontent with certain colonial governors. More importantly, recurrent rebellions likely lowered the returns from office for prospective officials: ruling these districts becomes relatively “risky” such that only those with “extractive abilities” would be willing to govern them, furthering the cycle of poor governance and revolt.
Shining Path. Against this background, the rise of an extremist Maoist organization called Sendero Luminoso, or Shining Path, 200 years later appears less surprising. Based on the charisma of its leader (Abimael Guzman), the long-term work of its members in the Peruvian countryside, and the longstanding support for Marxist ideologies (McClintock Reference McClintock1984), Shining Path cells managed to infiltrate numerous indigenous communities that provided shelter, sustenance, and recruits. While “fiercely ideological,” the movement capitalized on economic discontent, poor service delivery, and lack of government assistance to these impoverished areas since immemorial times. As described by Weinstein (Reference Weinstein2006, 84) “Sendero luminoso generated interest and support by pointing to the government’s economic and political failures.” Thus making it likely that districts with relative worse local governance dating from colonial times could be more attracted to Shining Path’s core message.
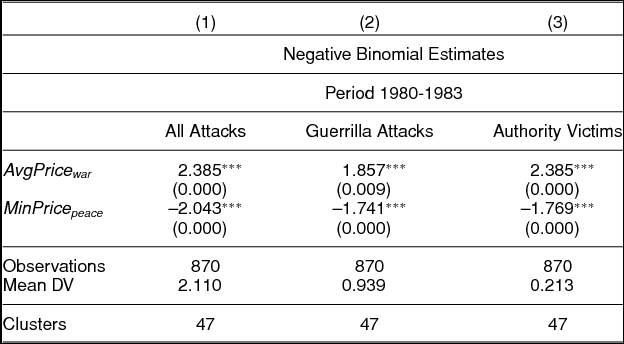
In Table 10, I examine the effect of office prices in the eighteenth century on support for Shining Path. To measure support, I use both the violent incidents committed by Shining Path members, but also take advantage of the fact that villages which Sendero had infiltrated routinely conducted “popular trials” in which hated individuals among the population (thieves, adulterers) and government representatives denounced by locals would be put publicly to death. By examining the identity of the victims, it is possible to better capture support for the insurgency and not opposition to it. I focus exclusively on violent episodes in the early stages (1980–1983) of the conflict, just before Shining Path launched its “Great Leap” to expand operations beyond its strongholds in 1984 (Weinstein Reference Weinstein2006, 86; CVR 2004). These areas constituted the initial “base” of Shining Path’s territory and were plausibly more supportive to its ideas.
Office Prices and Shining Path Attacks

Clustered robust p-values at the province level in parentheses. All specifications include: elevation, distance to Lima, latitude, longitude, and agricultural constraints (soil, climate, slope) as well as population size for 1990. Prices are weighted by population size in 1754. *** p < 0.01, ** p < 0.05, * p < 0.1
Estimates from Table 10 show that districts belonging to provinces for which governors paid higher office prices during eighteenth-century wars exhibit higher levels of insurgent violence during initial phases of the conflict and had a disproportionate number of victims belonging to local government officials or social leaders. Because only a handful of districts ever experienced violence in the early phase, I again use count models to account for the distribution in the number of attacks. I find that higher prices increase the intensity of violence, particularly against local authorities. Specifically, an increase of 1 log point (approximately one standard deviation) in the average price paid in the eighteenth century is expected to increase the rate of conflict events by a factor of 10.85, 6.4, and 10.85 for overall attacks, attacks by Shining Path, and attacks against local authorities, respectively.
Violence during the Peruvian Civil War shares with anticolonial rebellions the fact that it was particularly targeted against local political figures: estimates from column 3 support the idea that political authorities (local party leader, mayor, council member) were in greater danger of being attacked in districts with higher prices paid for office in the eighteenth century.
Political Attitudes. Following this logic, Table A.30 examines whether provinces with higher eighteenth century office prices have different attitudes towards political institutions and democratic processes. Although the household survey used (2013 ENAHO) only fields the questions on political attitudes for a sub-sample of respondents, estimates show how, across different measures of trust in general (column 1) and of particular aspects of politics such as local governments (column 2), electoral institutions (column 3), judicial and law enforcement bodies (column 4), and even the media (column 5), trust measures consistently exhibit a negative sign. However, the coefficients are only statistically significant for trust in electoral authorities. Because these results are less precise, they provide only indicative evidence that places ruled by “bad” colonial rulers have lower trust in existing institutions.
Cultural Integration
A second form of resistance to “bad” rulers was to limit interactions with Spanish colonial authorities and settlers by refusing to culturally assimilate and adopt the dominant language (see Diaz-Cayeros Reference Diaz-Cayeros2011 for the case of Mexico). Yet, failure to culturally assimilate may be economically costly to minorities, since it deprives these groups from the gains from trade with the majority or mainstream group (Lazear Reference Lazear1999). This backlash against the dominant culture and loss of economic opportunities is quite plausible in the case of Peru: the presence of colonial exploitation targeted against the indigenous population, combined with strong geographical barriers (e.g., Andes), and the preservation (until recently) of traditional patterns of land-holding, may all have reduced the incentives to culturally assimilate into the “Spanish” and “Mestizo” culture, leading to relatively worse economic outcomes over time.
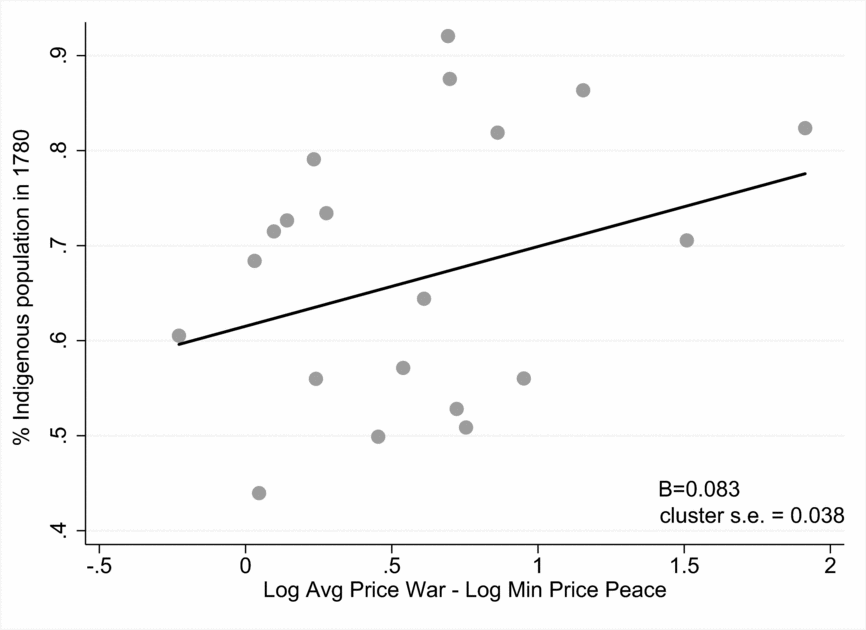
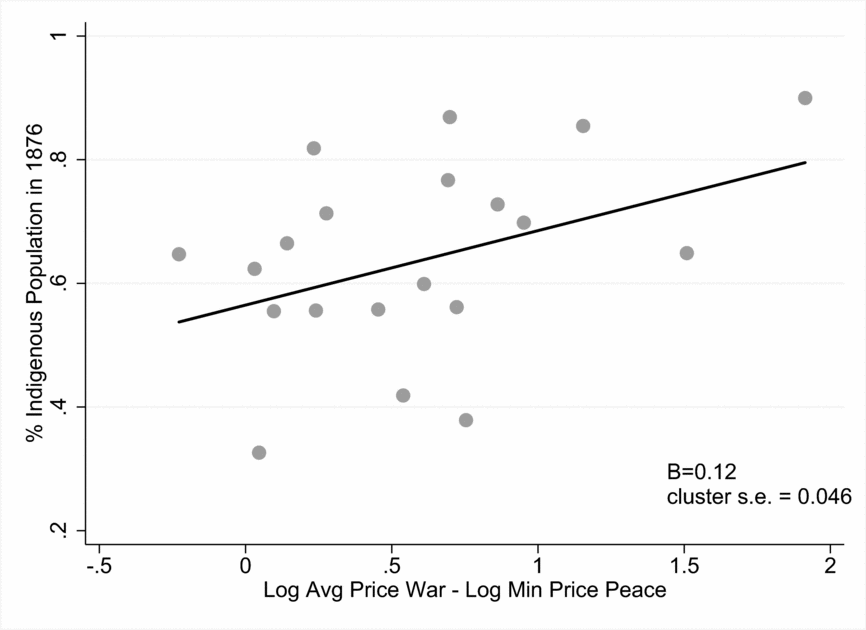
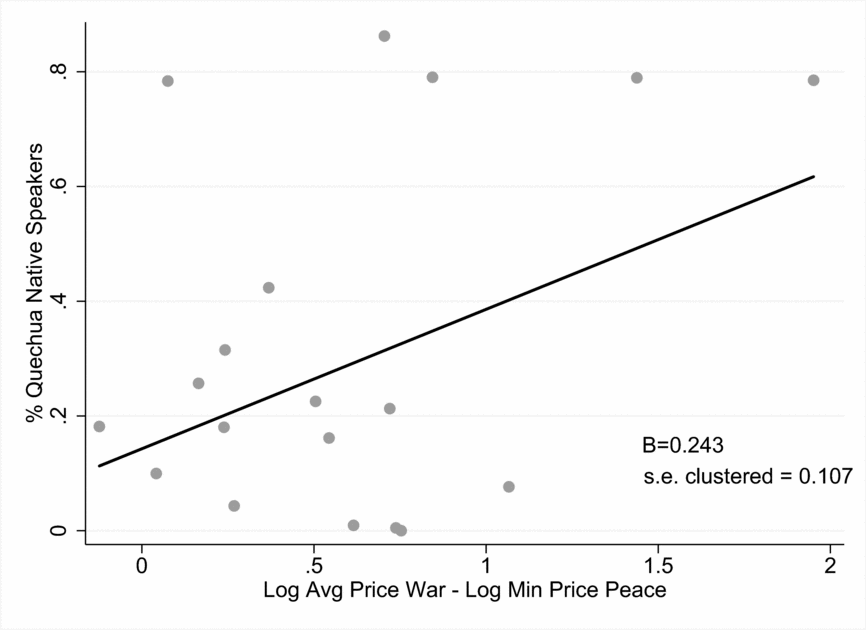
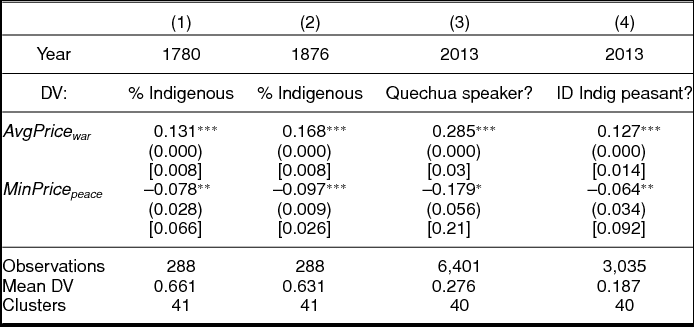
To examine this possibility, Table 11 traces the ethnic composition of the population among former colonial provinces. Specifically, I examine the share of Indigenous as opposed to the Mestizo and Spanish population in these districts from 1780 until 2013. During colonial times, the population was greatly limited in their settlement choices (even Spanish-born individuals were confined to live in corregimientos de espanoles), but after independence (1824), individuals were relatively free to move and arbitrage any differences. To deal with variation on data availability across censuses, I focus on districts with data measured consistently across two centuries. Figures 8, 9, and 10 provide graphical evidence of this relationship: higher price differences are associated with a higher share of indigenous population.
Price Differences and Indigenous Population in 1780

Price Differences and Indigenous Population in 1876

Price Differences and Indigenous Population in 2013

Office Prices and Ethnic Composition: 1780-2013

Clustered robust p-values at the province level in parentheses. Cluster-robust wild-bootstrap p-values in brackets. All specifications include: elevation, distance to Lima, latitude, longitude, and agricultural constraints (soil, climate, slope). Household specifications include: number of adults, infants, and kids in the household, age, and gender. Prices are weighted by population size in 1754. *** p < 0.01, ** p < 0.05, * p < 0.1
More systematically, Table 11 shows a positive and significant difference in 1780 in the share of indigenous population of around 1.3 percentage points for a 10% increase in prices. By 1876, this difference had become larger on average (1.7 percentage points), but the gap is even larger today (2013) when using measures of self-reported language (around 2.8%) and indigenous identity.
These estimates show that in post-independence Peru—with relatively more freedom of movement—colonial differences in the quality of governance and in the economic returns to cultural assimilation could have been exacerbated by the migration and settlement choices of individuals in the nineteenth century. Individuals chose to settle in places with better institutions, where they were better able to interact socially and economically with the local population. Altogether, these findings suggest a widening and not a convergence in the ethnic composition of the population over time, consistent with the regional economic disparities documented.
CONCLUSION
This paper uses the prices paid for colonial offices between 1673 and 1751 to study how the sale of offices by the Spanish Crown plausibly led to a more extractive ruling class during colonial times in Peru, which negatively impacted its development prospects in the long run.
The paper first shows that officials were likely to pay more and be of “lower quality” when purchasing positions with greater opportunities to profit at times of war. Additional tests show that the results are not driven by altruism, wages, prestige, or career-benefits. Moreover, there is no evidence that the increase in office prices is reflecting changes in the attractiveness of Peruvian provinces during European wars, or selectivity in which provinces to sell by the Crown, among other explanations. Rather, these results are consistent with individuals with fewer loyalty or social constraints willing to pay higher prices to secure access to office for private gain, or negative selection.
The long-term impact of their time in office was overall detrimental: positions coveted during colonial times are systematically worse off in terms of household consumption and public goods provision today. One of the reasons the effect of these colonial governors persisted over time is that their rule warped the relationship between citizens and authorities. The presence of exploitative practices led to contentious politics characterized by political violence, first, against the colonizing power (anticolonial rebellions) and later, against democratically elected governments. Such perceived antagonism to colonial governors could have lowered the payoffs for “good” types to seek office, furthering the cycle of negative selection and poor governance. Similarly, the presence of economic extraction entrenched ethnic identities as a way to limit interactions with the Spanish-Mestizo world, making it difficult to culturally assimilate or adopt the common language. Such a lack of assimilation may have deprived minority groups from the gains from trade with the majority or mainstream group and reinforce itself over time.
SUPPLEMENTARY MATERIAL
To view supplementary material for this article, please visit https://doi.org/10.1017/S000305541800045X.
Replication materials can be found on Dataverse at: https://doi.org/10.7910/DVN/TI5BPV.




Comments
No Comments have been published for this article.