1. Introduction
Impurity sources are inherent in the operation of present day fusion devices and will also be present in future reactors. Erosion from the first wall can release impurities to the plasma core, which can lead to the radiative collapse of the plasma if the impurity concentration becomes sufficiently high. Impurities can also be intentionally introduced in the plasma to access the density and radiative conditions for divertor detachment, reducing the heat loads over the divertor surface to tolerable levels. In reactors, thermalized alpha particles will constitute the main impurity in the plasma core, and its removal will be critical to avoid the dilution of the deuterium-tritium fuel. Impurities are also in the design basis of different diagnostics of bulk plasma properties, such as spectroscopy-based measurements of plasma flows, main ion temperature or radial electric fields. For these reasons, substantial efforts have been devoted, in stellarator and tokamak experiments, theory and numerical simulations, to the identification of the mechanisms that control impurity transport.
In stellarators, the concern for impurity accumulation arises from its observation in experiments (Hirsch et al. Reference Hirsch, Baldzuhn, Beidler, Brakel, Burhenn, Dinklage, Ehmler, Endler, Erckmann and Feng2008; Burhenn et al. Reference Burhenn, Feng, Ida, Maassberg, McCarthy, Kalinina, Kobayashi, Morita, Nakamura and Nozato2009), more severe in ion root conditions (negative radial electric field) that standard neoclassical theory predicts when the main ion and electron temperatures are comparable. However, some scenarios have been identified too, that contradict that tendency, like the high-density H-mode (known as HDH) W7-AS plasmas (McCormick et al. Reference McCormick, Grigull, Burhenn, Brakel, Ehmler, Feng, Gadelmeier, Giannone, Hildebrandt and Hirsch2002) and the impurity hole scenarios in the Large Helical Device (LHD) (Ida et al. Reference Ida, Yoshinuma, Osakabe, Nagaoka, Yokoyama, Funaba, Suzuki, Ido, Shimizu and Murakami2009).
The existence of these scenarios has been the drive of a recent intense revision of neoclassical theory and numerical modelling, starting with the impact on impurity transport of the full neoclassical electric field, not only radial but also tangential to the flux surfaces (García-Regaña et al. Reference García-Regaña, Kleiber, Beidler, Turkin, Maaßberg and Helander2013, Reference García-Regaña, Beidler, Kleiber, Helander, Mollén, Alonso, Landreman, Maassberg, Smith and Turkin2017; Calvo et al. Reference Calvo, Velasco, Parra, Alonso and García-Regaña2018b); the role of the tangential components of the magnetic drift and the electric field has been rigorously formulated (Calvo et al. Reference Calvo, Parra, Velasco and Alonso2017) and numerically implemented in the recently released code KNOSOS (Velasco et al. Reference Velasco, Calvo, García-Regaña, Parra, Satake and Alonso2018, Reference Velasco, Calvo, Parra and García-Regaña2020); these advances have gone along with more accurate treatments of collisions in self-consistent multispecies radially local simulations (Mollén et al. Reference Mollén, Landreman, Smith, García-Regaña and Nunami2018); the so-called mixed-collisionality-regime (low collisional main ions and highly collisional impurity ions) has been uncovered with important implications regarding ion temperature screening (Helander et al. Reference Helander, Newton, Mollén and Smith2017; Buller et al. Reference Buller, Smith, Helander, Mollén, Newton and Pusztai2018; Calvo et al. Reference Calvo, Parra, Velasco, Alonso and García-Regaña2018a); the importance of the classical transport for highly charged impurities has been reinvigorated in optimized stellarators (Buller et al. Reference Buller, Mollén, Newton, Smith and Pusztai2019); finally, the first radially global neoclassical simulations including all these new neoclassical ingredients have been recently released (Fujita et al. Reference Fujita, Satake, Kanno, Nunami, Nakata, García-Regaña, Velasco and Calvo2020). The outcome of these works has made evident that this broader neoclassical framework can introduce corrections of order unity in the impurity fluxes with respect to the predictions of standard neoclassical theory, like those based on the drift kinetic equation solver (DKES) (Hirshman et al. Reference Hirshman, Shaing, van Rij, Beasley and Crume1986). On the experimental side, the first transport analyses of laser blow-off (LBO)-injected iron impurities in Wendelstein 7-X (W7-X) and the comparison against neoclassical DKES calculations (Geiger et al. Reference Geiger, Wegner, Beidler, Burhenn, Buttenschön, Dux, Langenberg, Pablant, Pütterich and Turkin2019) have shown that, while it cannot be discarded that the measured impurity convection coefficient is explained by neoclassical mechanisms, the experimental diffusion coefficient and that numerically obtained with DKES can differ by more than two orders of magnitude. Impurity confinement time scaling studies (Langenberg et al. Reference Langenberg, Wegner, Pablant, Marchuk, Geiger, Tamura, Bussiahn, Kubkowska, Mollén and Traverso2020) have also reported similar discrepancies with numerical estimations based on DKES. The fact that neither the above-mentioned extensions of the neoclassical theoretical framework nor the classical channel have been reported to provide order-of-magnitude corrections has supported the hypothesis that the drive of impurity transport in W7-X plasmas has a significant turbulent component. The absence of impurity accumulation in most scenarios of the first operation phase, including those of high density with high likeliness of developing large ion-root electric fields, has been attributed to the turbulent component (Klinger et al. Reference Klinger, Andreeva, Bozhenkov, Brandt, Burhenn, Buttenschön, Fuchert, Geiger, Grulke and Laqua2019).
With regard to impurity transport driven by gyrokinetic microturbulence, little work has been done for stellarator geometry. Among the few examples that have attempted to model it, the quasilinear analysis performed with the code GS2 in Mikkelsen et al. (Reference Mikkelsen, Tanaka, Nunami, Watanabe, Sugama, Yoshinuma, Ida, Suzuki, Goto and Morita2014) is one of the first examples available in the literature. Only very recently, nonlinear impurity transport simulations have also been carried out with the code GKV and reported in Nunami et al. (Reference Nunami, Nakata, Toda and Sugama2020). There, a sensitivity study of the particle fluxes of light impurities is provided, based on one of the LHD impurity hole discharges and considering the specific mix of impurities present in those plasmas. Apart from these numerical examples, some basic features of the quasilinear flux of impurities from gyrokinetic instabilities with perpendicular wavenumber such that  $k_{\bot }\rho _i\lesssim 1$ have been analytically estimated in the collisionless electrostatic limit in Helander & Zocco (Reference Helander and Zocco2018) such as, for example, the relative size of the different diffusive and convective contributions to the flux or their signs. This work has been generalized including the effect of collisions (Buller & Helander Reference Buller and Helander2020), which are not included in the analyses presented here.
Therefore, the aim of the present work is building, by means of linear and nonlinear gyrokinetic simulations, a first numerical characterization of the radial turbulent transport of impurities in W7-X plasmas, that alleviate the lack of numerical results for stellarators and shed light on the interpretation of W7-X experimental measurements. The analyses that follow consider a set of selected impurities and bulk species gradients such that the triggered background instabilities are representative of ion temperature gradient (ITG), trapped electron mode (TEM) and electron temperature gradient (ETG) modes. All the numerical work is presented in § 2, which is divided into three subsections. In the first of them, § 2.1, the results presented are quasilinear and, through fast simulations that include ions, electrons and a single impurity at a trace concentration level, provide an overview of the relative weight, sign, mass, charge dependence, etc. of each diffusive or convective contribution to the turbulent particle transport spectra for the selected impurities. Section 2.2 presents nonlinear simulations that, considering similar parameters to those employed for the quasilinear calculations, provide a quantitative evaluation of the actual size of diffusion and convection coefficients. Finally, the experimentally relevant situation of non-trace impurity content is briefly discussed in § 2.3. All the calculations performed have been obtained with the newly developed stellarator gyrokinetic code stella (Barnes, Parra & Landreman Reference Barnes, Parra and Landreman2019). Finally, the conclusions are summarized in § 3.
2. Numerical results
In the present section, the numerical results of turbulent impurity transport with the code stella are presented and discussed. A complete description of the code can be found in (Barnes et al. Reference Barnes, Parra and Landreman2019) but, for convenience, its main features are concisely summarized below.
The code stella is a recently developed  $\delta f$ code whose current version solves, in the flux tube approximation, the gyrokinetic Vlasov and Poisson equations for an arbitrary number of species.Footnote 1 The magnetic geometry can be specified either by the set of Miller's parameters for a local tokamak equilibrium or by a three-dimensional equilibrium generated with VMEC, which has been the option considered for the simulations carried out in this paper. The spatial coordinates that the code uses for stellarator simulations are: the flux surface label
 $x=a\sqrt {s}$ (commonly denoted by
 $r$), with
 $a$ the effective minor radius of the device provided by VMEC, and
 $s=\psi _t/\psi _{t,\mathrm {LCFS}}$ the toroidal magnetic flux normalized to its value at the last closed flux surface; the magnetic field line label
 $y=a\sqrt {s_0}\alpha$, a rescaled version of the Clebsch angle
 $\alpha =\theta ^*-\iota \zeta$, with
 $\theta ^*$ and
 $\zeta$ the poloidal and toroidal, respectively, PEST flux coordinates (Grimm, Dewar & Manickam Reference Grimm, Dewar and Manickam1983),
 $\iota$ the rotational transform and
 $s_0$ the value of the flux surface label around which the flux tube is centred; the parallel coordinate
 $z=\zeta$. The velocity coordinates are the magnetic moment
 $\mu$ and the parallel velocity
 $v_{\|}$. The crucial feature of the algorithm employed by stella to solve the gyrokinetic equation is the mixed implicit–explicit treatment of its different terms. In particular, a splitting of the Vlasov operator is applied, and the pieces containing the parallel streaming and acceleration are treated implicitly. For electrons, these pieces scale up to a factor of order
 $\sqrt {m_i/m_e}$ (with
 $m_i$ and
 $m_e$ the main ion and electron mass, respectively) with respect to all other terms in the gyrokinetic equation, imposing in fully explicit time-advance schemes a severe restriction to the time step size, tighter at lower perpendicular wavenumber
 $k_{\bot }$. The mixed implicit–explicit algorithm employed by stella relaxes this constraint on the time step and allows one to include kinetic electrons in multispecies simulations with practically no increase of computational cost apart from the requirement to loop over more species.
Returning to the impurity transport problem, the possibility of including kinetic electrons with practically no need of decreasing the time step, has made it possible to address with multiple nonlinear simulations the quantitative characterization of the transport of impurities under both ion- and electron-driven background turbulence in W7-X geometry. This is the raison d’être of the present work, and the obtained results, discussed in detail in § 2.2, its main achievement. However, given the very few stellarator references addressing this problem even on a quasilinear fashion, § 2.1 is dedicated to a quasilinear analysis that precedes the nonlinear treatment of § 2.2. To what extent the conclusions drawn from the presented quasilinear calculations follow analytical quasilinear theory predictions (Helander & Zocco Reference Helander and Zocco2018) and hold in light of nonlinear results will be briefly commented.
Sections 2.1 and 2.2 consider impurities at trace concentration, which allows us to assume that transport coefficients are independent of the impurity density and temperature gradients and to express the turbulent radial impurity flux as
 \begin{equation} \varGamma_Z=-n_Z\left(D_{Z1}\frac{\text{d}\ln n_Z}{\text{d} r}+D_{Z2}\frac{\text{d}\ln T_Z}{\text{d} r}+C_Z\right), \end{equation}
with  $D_{Z1}$ the impurity diffusion coefficient,
 $D_{Z2}$ the thermodiffusion coefficient and
 $C_Z$ the flux in the absence of impurity density and temperature gradients, which includes the contribution from the curvature pinch and the flux arising from the acceleration of impurities due to the turbulent parallel electric field.Footnote 2 In expression (2.1)
 $n_Z$ and
 $T_Z$ are the impurity density and temperature, respectively. Finally, in § 2.3 the question about the dependence that the transport coefficients develop at non-trace impurity concentration is addressed. In particular, the impurity flux scaling with the impurity density gradient at
 $Z_{\text {eff}}=2$ is investigated by means of nonlinear simulations, in order to determine whether the conclusions drawn assuming the trace limit can be extrapolated to more realistic plasma conditions.
All simulations, linear and nonlinear, at trace and non-trace impurity content, have the following in common: the magnetic geometry, which is the standard W7-X configuration (see Geiger et al. (Reference Geiger, Beidler, Feng, Maassberg, Marushchenko and Turkin2015) for an overview of the W7-X configuration space); the main ion species, hydrogen, and the chosen flux surface,  $\sqrt {s_0}=0.49$. Other parameters, specific to the type of simulations performed, are given in the corresponding section. Unless explicitly mentioned, the simulations are performed at the so-called bean flux tube, centred around
 $(\theta^{\ast},\zeta )=(0,0)$, as it is usually found to be the most unstable flux tube in W7-X (see Helander et al. (Reference Helander, Beidler, Bird, Drevlak, Feng, Hatzky, Jenko, Kleiber, Proll and Turkin2012) for a discussion about the localization of the turbulent fluctuations of the electrostatic potential along this flux tube). However, for comparison purposes, selected linear and nonlinear simulations have also been carried out for the triangle flux tube, centred at
 $(\theta^{\ast},\zeta )=(0,{\rm \pi} /5)$.
2.1. Linear stability and quasilinear impurity transport analysis
How the impurity transport is affected by the driven gyrokinetic electrostatic instabilities of a set of specific LHD impurity hole discharges can be found in Mikkelsen et al. (Reference Mikkelsen, Tanaka, Nunami, Watanabe, Sugama, Yoshinuma, Ida, Suzuki, Goto and Morita2014). However, a similar analysis is not reported, to our knowledge, for W7-X geometry, which motivates us to perform a quasilinear characterization of the turbulent impurity transport in this device prior to turning to the fully nonlinear treatment in § 2.2. In addition, recent work by Helander & Zocco (Reference Helander and Zocco2018) has analytically deduced some qualitative features of the quasilinear transport coefficient of impurities, which can be contrasted with the presented quasilinear numerical estimations.
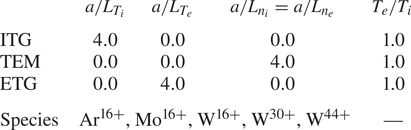
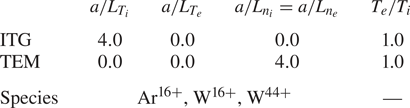
The selected parameters and impurity species for the quasilinear study are summarized in table 1. The gradients of the bulk species have been set such that hybrid instabilities were discarded. That is,  $\{a/L_{T_i}, a/L_{T_e}, a/L_{n_e}\}=\{4, 0, 0\}$ has been set for the ITG driven instability,
 $\{a/L_{T_i}, a/L_{T_e}, a/L_{n_e}\}=\{0, 0, 4\}$ for density gradient driven TEMs, and
 $\{a/L_{T_i}, a/L_{T_e}, a/L_{n_e}\}=\{0, 4, 0\}$ for ETG modes.Footnote 3 This election is based on the typical gradient scales measured at the edge of W7-X plasmas, see e.g. Geiger et al. (Reference Geiger, Wegner, Beidler, Burhenn, Buttenschön, Dux, Langenberg, Pablant, Pütterich and Turkin2019). In particular, normalized temperature gradients larger than
 $4.0$ are commonly observed in enhanced performance scenarios induced by auxiliary pellet fuelling (Baldzuhn et al. Reference Baldzuhn, Damm, Beidler, McCarthy, Panadero, Biedermann, Bozhenkov, Brunner, Fuchert and Kazakov2019; Bozhenkov et al. Reference Bozhenkov, Kazakov, Ford, Beurskens, Alcusón, Alonso, Baldzuhn, Brandt, Brunner and Damm2020). Although a density gradient of approximately
 $4.0$ may be more characteristic of the far edge than of the simulated radial position,
 $r/a=0.7$, setting it equal to the temperature gradients follows from the intention of comparing the contribution with the radial impurity transport produced by the different instabilities at equal size of their driving gradient. For all cases the flux tube has been extended three turns poloidally, the wavenumber along the radial direction has been set to
 $k_x=0$, and the wavenumber along the binormal direction,
 $k_y$, has been scanned. All simulations have been performed with kinetic main ions, electrons and a single impurity species at a trace concentration. The set of selected impurities have included
 $\textrm {Ar}^{16+}$,
 $\textrm {Mo}^{16+}$,
 $\textrm {W}^{16+}$,
 $\textrm {W}^{30+}$ and
 $\textrm {W}^{44+}$.
Normalized gradients, electron to ion temperature ratio and selected impurities considered for the quasilinear transport study.

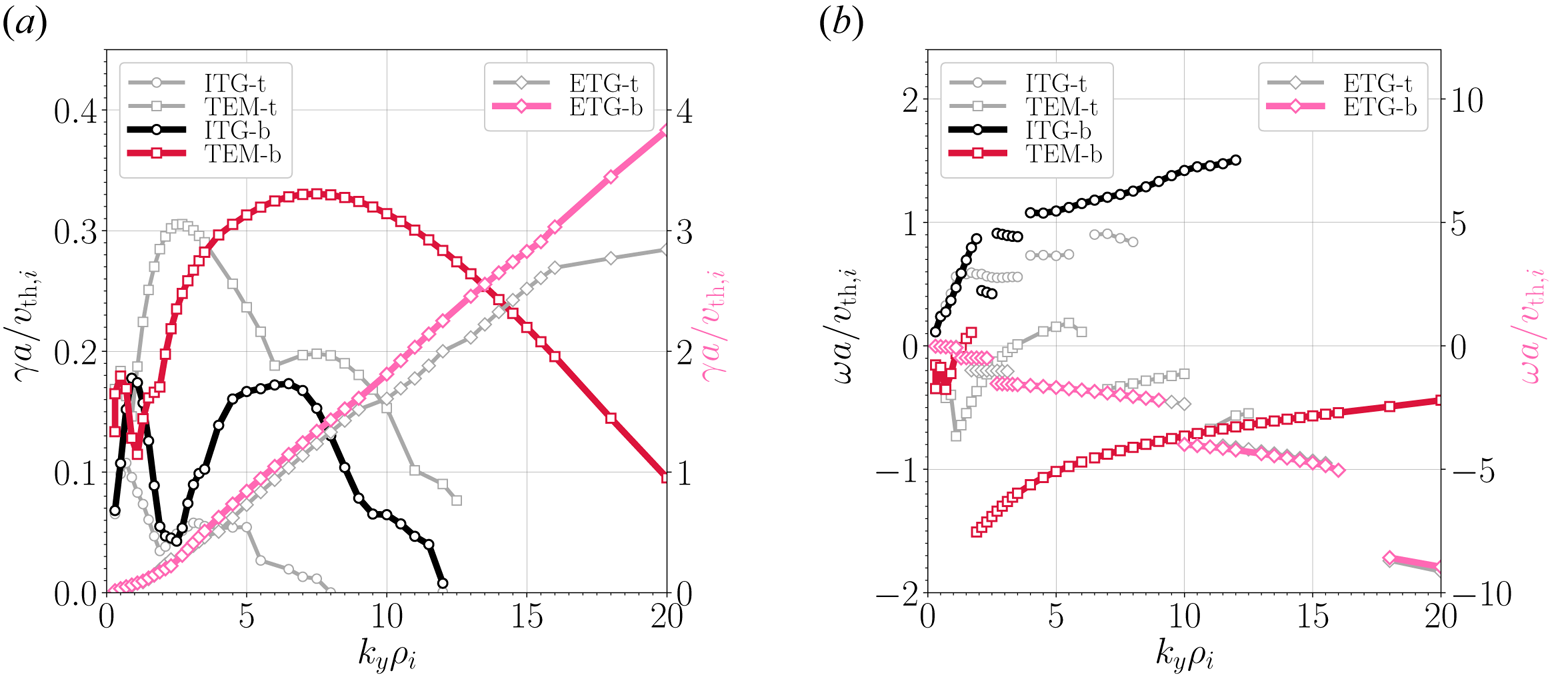
For the bean and triangle flux tubes, the spectra of the growth rate,  $\gamma$, and frequency,
 $\omega$, for the three different linear instabilities simulated are represented in figure 1(a) and figure 1(b), respectively. For the three instabilities, figure 1(a) shows that the bean flux tube develops more unstable modes along the whole
 $k_y$ range than the triangle flux tube. Focusing then on the bean flux tube, it is observed that the ITG-driven instability features a double peak structure and extends over a considerably broad
 $k_y$ range up to
 $k_{y}\rho _i\approx 12$. However, the fastest growing mode is located at
 $k_{y}\rho _i\approx 1$. Changes in the dominant eigenmode can be inferred from the discontinuous spectrum of the frequency. The sign of the frequency indicates that the modes rotate in the ion diamagnetic direction for all
 $k_y$. On the other hand, the density gradient driven TEM is found to be more unstable than the ITG, with the fastest growing mode of the former featuring a growth rate a factor of two larger than that of the latter. The fastest growing mode is located at
 $k_y\rho _i\approx 7.5$, although the instability extends beyond
 $k_y\rho _i=20$. The sign of the frequency indicates that the mode can rotate both in the ion diamagnetic direction for the low
 $k_y$ part of the spectrum, and in electron diamagnetic direction at moderate and high
 $k_y$. Finally, the ETG-driven instability shows a monotonic increase of the growth rate towards electron Larmor scales, not covered on the simulated range of
 $k_y$, where the most unstable
 $k_y$ is expected to be located. Note, though, the large value of the growth rate (referred to the right-hand
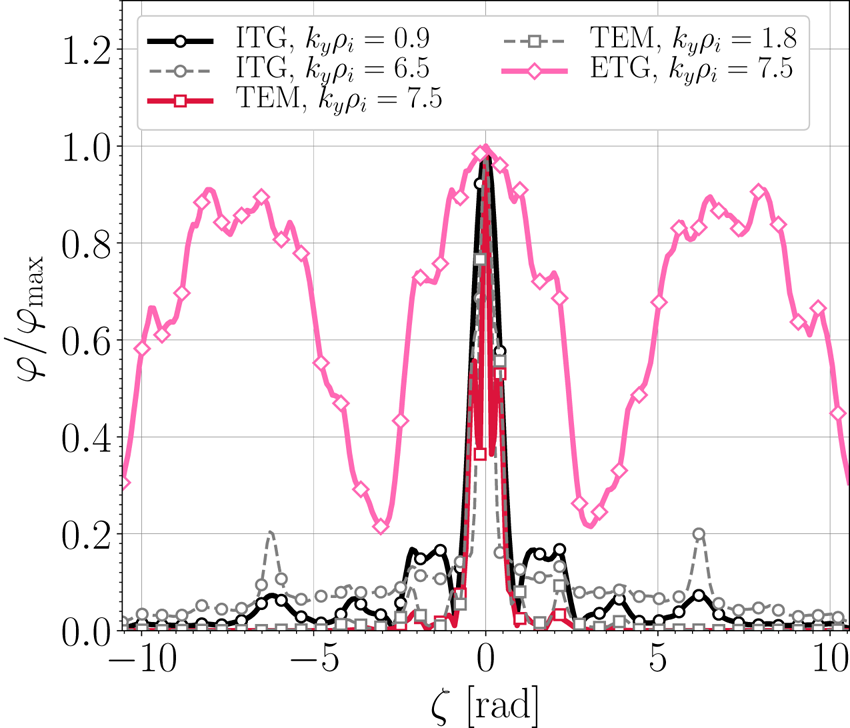
 $y$-axis) that the ETG-driven instability develops at scales of a few ion Larmor radii. The frequency, in this case, shows that the mode rotates in the electron diamagnetic direction and that different branches, presumably dominated by a different eigenmode, are encountered, as the discontinuous frequency pattern points out. Finally, figure 2 represents for the bean flux tube the parallel structure of the most unstable ITG and TEM modes, with
 $k_y\rho _i=0.9$ and
 $k_y\rho _i=7.5$, respectively, as well as that of the ETG mode with
 $k_y\rho _i=7.5$. For comparison, the eigenfunctions of the ITG and TEM mode corresponding to the second local maximum of the growth rate, located in figure 1(a) at
 $k_y\rho _i=6.5$ and
 $k_y\rho _i=1.8$, respectively, are also represented. The figure reveals the strong localization of the TEM and the ITG instabilities around the centre of the bean flux tube, although the latter presents a comparatively greater spread-parallel structure than the former. On the other hand, the ETG exhibits by far the most extended structure, without any predominant localization at a specific region along the parallel coordinate.
For the bean (thick coloured lines) and the triangle (thin grey lines) flux tubes, normalized growth rate (a) and frequency (b) as a function of the normalized binormal wavenumber  $k_y$ for the three sets of background unstable conditions considered for the quasilinear impurity transport study, namely, ITG driven by
 $a/L_{T_{i}}=4.0$ (circles), TEM driven by
 $a/L_{n_{e}}=a/L_{n_{i}}=4.0$ (squares) and ETG driven
 $a/L_{T_{e}}=4.0$ (diamonds). Here, the normalization uses the ion Larmor radius,
 $\rho _i$, the ion thermal speed,
 $v_{\text {th},i}$ and the effective minor radius,
 $a$.

For the bean flux tube: eigenfunctions of the ITG modes (circles) corresponding to the two local maxima of the ITG growth rate spectrum represented in figure 1; eigenfunctions of the TEMs (squares) corresponding to the two local maxima of the TEM growth rate spectrum represented in figure 1; eigenfunction of the ETG mode with  $k_y\rho _i=7.5$ (diamonds). For the ITG and TEM cases, the coloured solid lines correspond to the most unstable mode and the grey dashed lines correspond to the second local maximum of their growth rate spectra.

Returning to the question about the impurity transport driven by the above-mentioned instabilities, we have followed the same approach as in Mikkelsen et al. (Reference Mikkelsen, Tanaka, Nunami, Watanabe, Sugama, Yoshinuma, Ida, Suzuki, Goto and Morita2014). Given a mode with wavenumbers  $k_x$ and
 $k_y$, the linear Vlasov–Poisson gyrokinetic system of equations is solved for each simulated time step, and the gyroaveraged impurity distribution
 $g_Z(k_x, k_y,z,v_{\|}, \mu , t)$ and electrostatic potential
 $\varphi (k_x, k_y,z, t)$ are obtained. From these two quantities, the flux surface averaged impurity flux,
 $\varGamma _Z(k_x,k_y, t)$, is computed. Note that, once the instability has been triggered the electrostatic potential
 $\varphi$ and, consequently,
 $\varGamma _Z$ grows exponentially. However, a quasilinear mixing-length estimate of the flux,
 \begin{equation} \varGamma^{ql}_{Z}(k_x, k_y, t)=\frac{\varGamma_{Z}(k_x, k_y, t)\gamma(k_x, k_y, t)} {n_Z\left\langle\varphi^2(k_x, k_y,z, t)\right\rangle k_\bot^2(k_x,k_y)}, \end{equation}
can be defined, so that a well-converged quantity is obtained once the growth rate is stabilized. In this expression  $\left \langle \cdots \right \rangle$ denotes the flux surface average operator and
 $k_\bot =k_x\boldsymbol {\nabla } x+k_y\boldsymbol {\nabla } y$. Considering
 $k_x=0$ for all simulations, for each impurity species in the presence of a background instability, the
 $k_y$-spectrum of the quasilinear flux has been extracted at the last simulated time step. This process has been repeated with three different pairs of impurity density and temperature gradients, in order to obtain from each impurity species embedded in a different type of instabilities the spectra of the three transport coefficients.
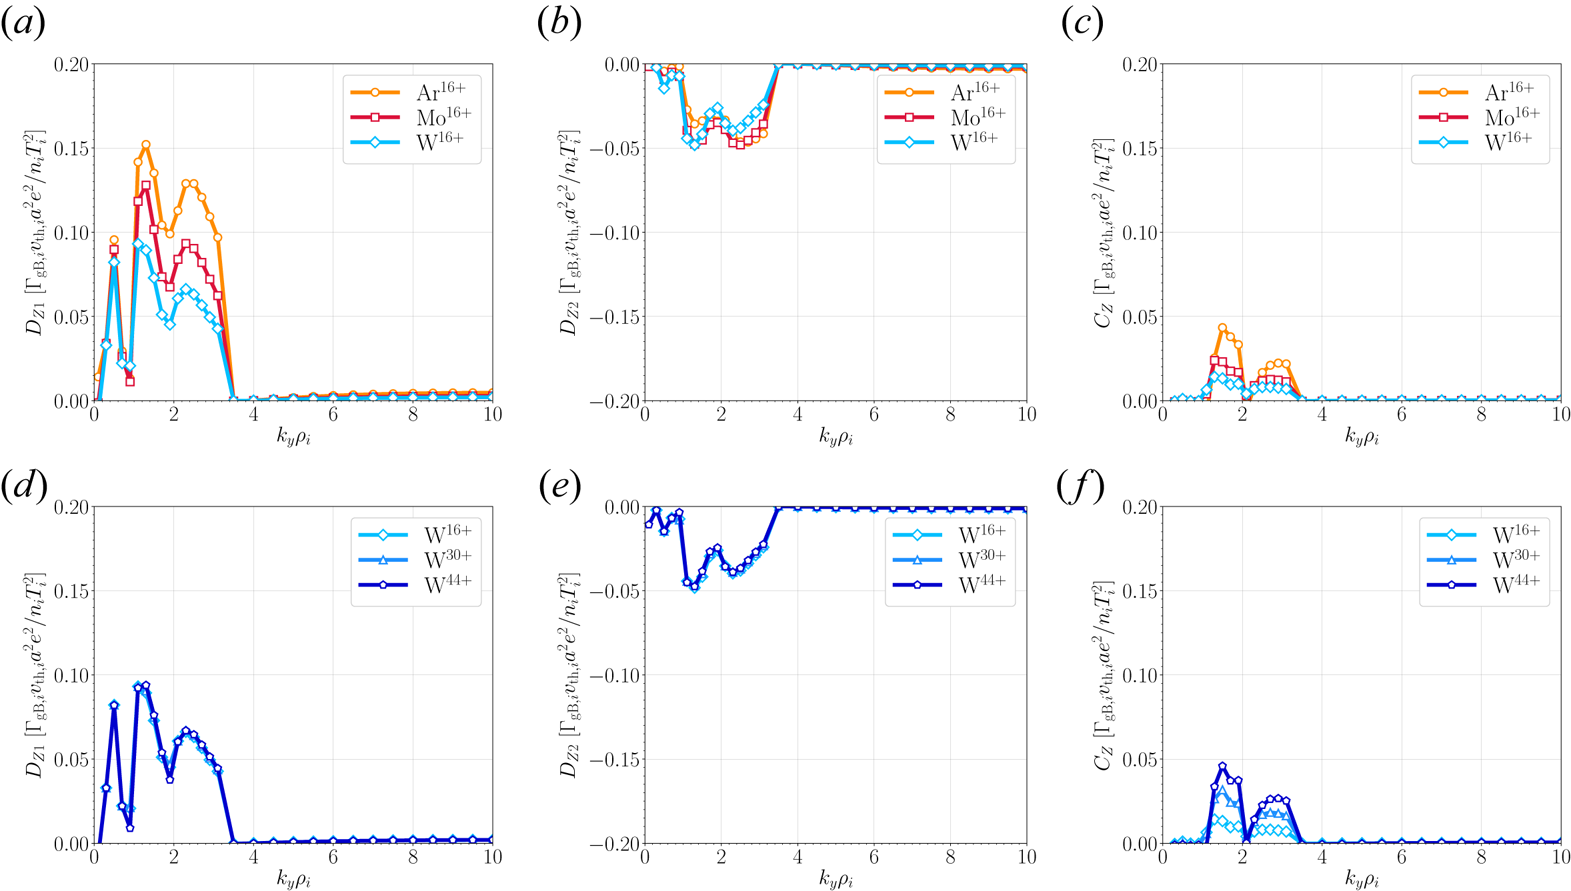
For the ITG instability, the spectra of the diffusion coefficient,  $D_{Z1}$, thermodiffusion coefficient,
 $D_{Z2}$ and the impurity flux in the absence of impurity density and temperature gradients,
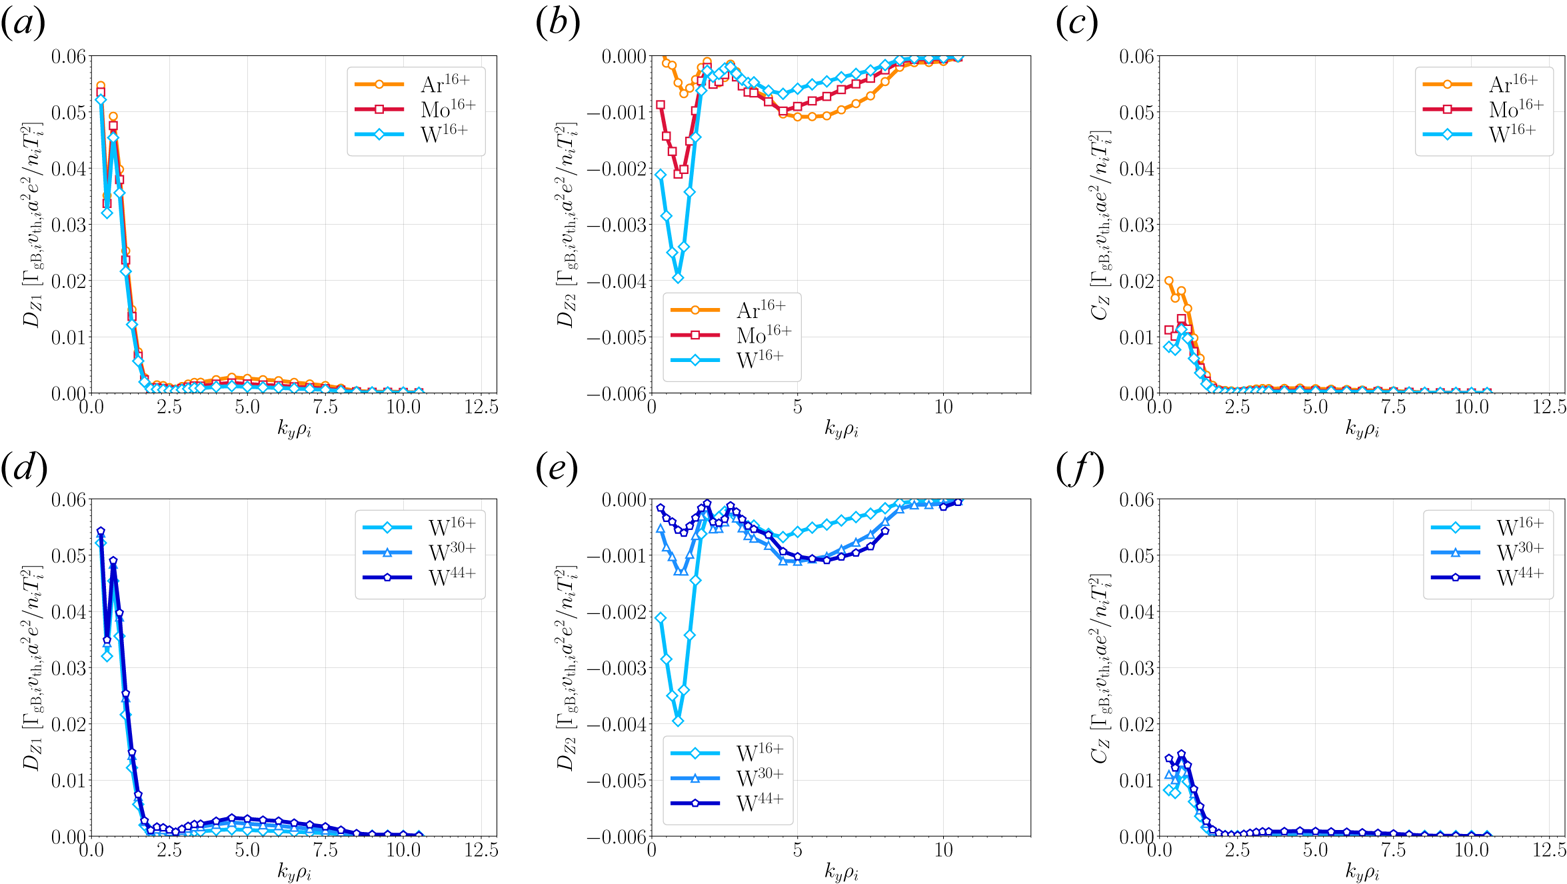
 $C_Z$, are displayed on the left-hand, centre and right-hand columns of figure 3, respectively. While the panels (a–c) show the results for the selected impurities with different mass, panels (d–f) do the same for the impurities with different charges. In first place,
 $D_{Z1}$ turns out to be roughly one order of magnitude larger than
 $D_{Z2}$, each having a different sign. That is, while diffusion drives impurities downhill the density profile, thermodiffusion would add an inward convection contribution, assuming a peaked impurity temperature profile. In any case, this contribution seems very weak. Another inward contribution to the flux arises at vanishing impurity density and temperature gradients, which, however, also seems comparatively small compared with the size of
 $D_{Z1}$. The spectra of the three transport coefficients show that most contributions to the total flux come from the lowest part of the spectrum, from
 $k_y\rho _i\lesssim 1.5$. Finally, no significant dependence on the impurity charge or mass is observed for
 $D_{Z1}$ and
 $C_Z$. On the other hand, the size of the weak
 $D_{Z2}$ is larger with increasing mass and decreasing charge.
For the ITG case (see table 1),  $k_y$-spectra of the diffusion coefficient
 $D_{Z1}$ (a,d), thermodiffusion coefficient
 $D_{Z2}$ (b,e) and pinch in the absence of gradients
 $C_{Z}$ (c, f) for the different impurities, for a mass (a–c) and charge (d–f) scan. The values are given in normalized units, with
 $\varGamma _{\text {gB},i}$ the gyro-Bohm ion particle flux,
 $v_{\text {th},i}$ the ion thermal speed,
 $e$ the unit charge,
 $a$ is the effective minor radius and
 $n_i$ and
 $T_i$ the main ion density and temperature, respectively.

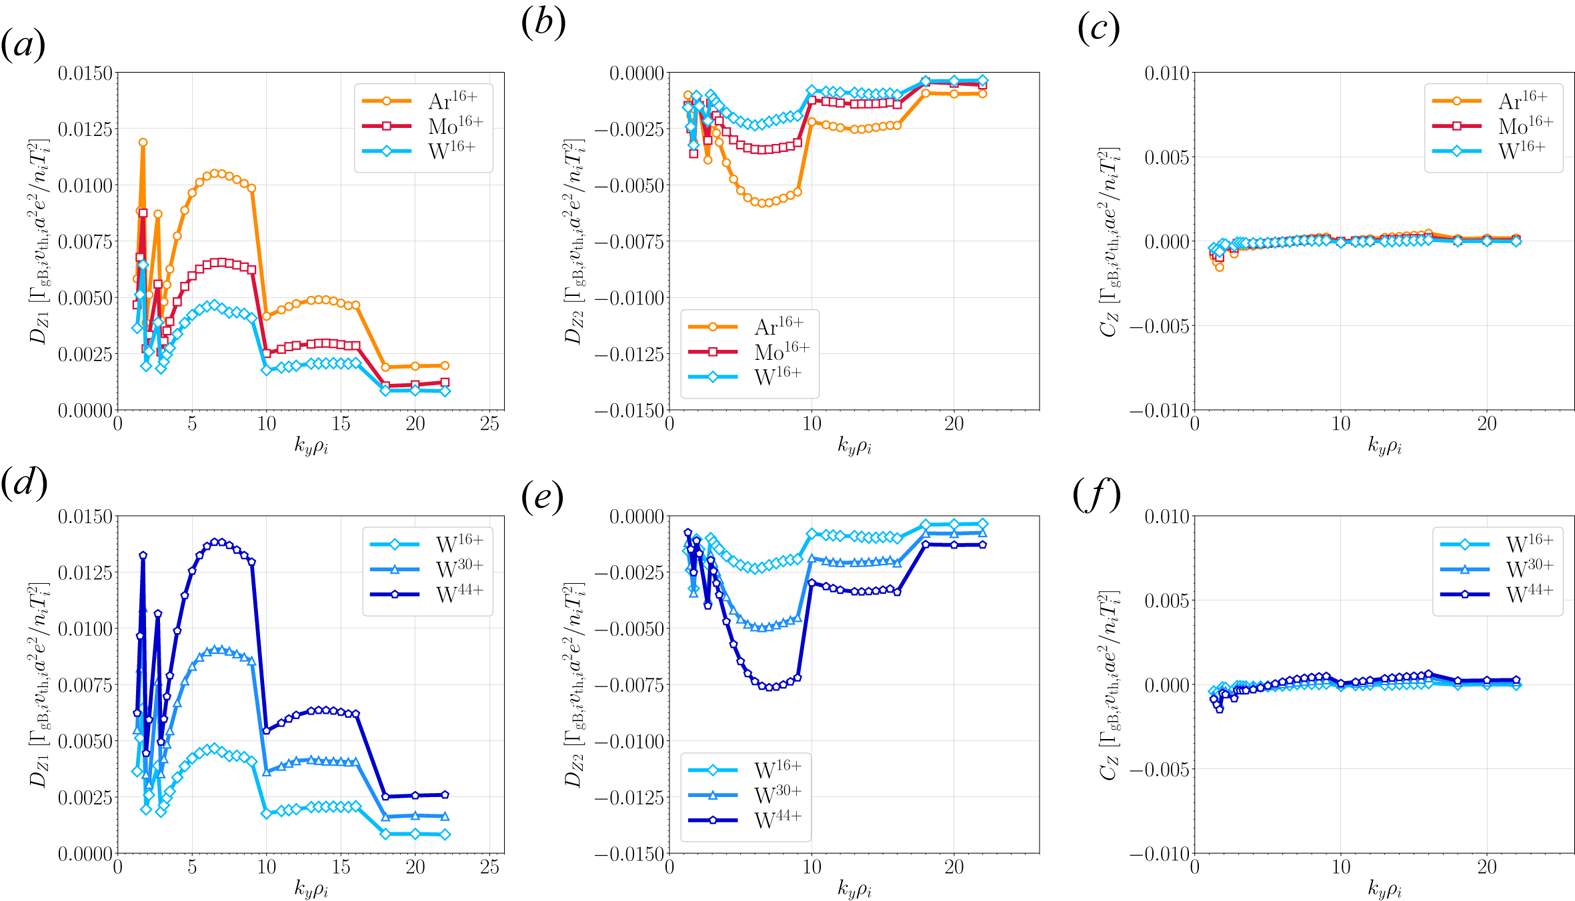
For the impurity transport coefficient driven by TEM instability, the corresponding results are shown in figure 4. In general, the transport coefficients follow the same trends as those observed in the ITG case. The diffusion coefficient is, in absolute value, larger than the thermodiffusion, and the sign of each of them is the same as for the ITG instability. However, the difference between  $D_{Z1}$ and
 $D_{Z2}$ is a factor of three, while in the ITG case they differed by roughly one order of magnitude. Furthermore, the strength of
 $D_{Z1}$ in this case is enhanced with respect to the ITG mode, possibly due to the more unstable character of this TEM, see figure 1. Furthermore, the three coefficients exhibit broader
 $k_y$-spectra than in the ITG case. Regarding the dependence of the coefficients on the mass or the charge, it is observed that
 $D_{Z1}$ somewhat depends on the charge and that
 $C_Z$ also depends on the charge and the mass.
For the TEM case, see table 1,  $k_y$-spectra of the diffusion coefficient
 $D_{Z1}$ (a,d), thermodiffusion coefficient
 $D_{Z2}$ (b,e) and pinch in the absence of gradients
 $C_{Z}$ (c, f) for the different impurities, for a mass (a–c) and charge (d–f) scan.

Finally, the results concerning the ETG instability are represented in figure 5. In contrast to the ITG and TEM cases,  $D_{Z1}$ is not particularly larger than
 $D_{Z2}$ in absolute value, and both are, in any case, considerably smaller than in the previous two cases. In addition,
 $C_Z$ is practically zero, which indicates that ETG driven impurity transport should be substantially smaller compared with that driven by the ITG mode or the TEM.
For the ETG case, see table 1,  $k_y$-spectra of the diffusion coefficient
 $D_{Z1}$ (a,d), thermodiffusion coefficient
 $D_{Z2}$ (b,e) and pinch in the absence of gradients
 $C_{Z}$ (c, f) for the different impurities, for a mass (a–c) and charge (d–f) scan.

In summary, the quasilinear approach to the problem has delivered the following conclusions. Both ITG and TEM should drive most of the impurity transport by ordinary diffusion. The ITG mode seems to be prone to developing slightly peaked impurity density profiles, as  $C_Z$ and
 $D_{Z2}$ are considerably smaller than the dominant
 $D_{Z1}$ and both add inward convective contributions to the total flux. The TEM case follows roughly the same characteristics, although
 $C_Z$ and
 $D_{Z2}$ are not as small compared with the diffusion coefficient
 $D_{Z1}$, which points out the tendency to develop peaked impurity density profiles with larger gradients than in the ITG case. In general, the sign and size of the transport coefficient are in reasonably good agreement with the analytical predictions (Helander & Zocco Reference Helander and Zocco2018). For instance, comparing the absolute value of
 $D_{Z1}$ for the three instability types, represented on the left-hand column of figures 3, 4 and 5, with the size of
 $D_{Z2}$, shown on the central column of those figures, it is found that
 $|D_{Z2}|$ is considerably smaller than
 $|D_{Z1}|$. The sign of
 $D_{Z2}$ also matches the quasilinear analytical prediction. The main differences between our results and those analytically derived reside on the mass or charge dependence of our results, which arises from the fact that all terms, including the parallel streaming neglected on the analytical treatment of Helander & Zocco (Reference Helander and Zocco2018), are retained in our simulations. For that reason too, the pinch in the absence of gradients in the present work,
 $C_Z$, is not strictly comparable to the so-called curvature pinch of the cited quasilinear analytical treatment.
2.2. Nonlinear turbulent transport of trace impurities
Quasilinear analyses allow us to extract qualitative information about the more or less prominent role of an instability in the turbulent impurity flux, the relative size of the different diffusive and convective terms, the direction, inward or outward, of the flux driven through each transport coefficient, and its wavenumber spectra. However, quasilinear calculations cannot provide a quantitative estimation of the flux, as nonlinear simulations do, since no saturated state is reached. While nonlinear multispecies gyrokinetic simulations have been employed with remarkable success for tokamaks – see for instance Barnes, Parra & Dorland (Reference Barnes, Parra and Dorland2012) for a comprehensive study of the scaling of the impurity transport of particles, momentum and energy – in stellarators they are anecdotal. In the present section, the question about the size of the turbulent impurity transport driven by ITG- and TEM-driven microturbulence and the respective transport coefficients is addressed by means of nonlinear simulations. Three of the impurities considered in the previous section,  $\textrm {Ar}^{16+}$,
 $\textrm {W}^{16+}$ and
 $\textrm {W}^{44+}$, have been selected. Each simulation includes hydrogen nuclei, electrons and one single impurity species, all three kinetically treated. For the ITG case the resolution has been set to
 $N_z\times N_x\times N_y\times N_{v_{\|}}\times N_{\mu }=96\times 76\times 151\times 24\times 12$, while for the TEM turbulence
 $N_z\times N_x\times N_y\times N_{v_{\|}}\times N_{\mu }=96\times 76\times 256\times 48\times 12$ has been taken. The width of the box along the binormal and radial directions has been set to
 $L_y=125\rho _i$ and
 $L_x=180\rho _i$, respectively, and the flux tube has been extended one turn poloidally. Standard twist-and-shift boundary conditions (Beer, Cowley & Hammett Reference Beer, Cowley and Hammett1995) have been considered. In table 2 the parameters considered for the background turbulence of interest in each case is indicated, together with the selected impurities.
Normalized gradients, electron to ion temperature ratio, and selected impurities considered for the nonlinear transport analysis.

In order to obtain the transport coefficients,  $D_{Z1}$,
 $D_{Z2}$ and
 $C_Z$, for each impurity and type of background turbulence, three simulations have been performed with different values of impurity normalized density and temperature gradients,
 $a/L_{n_Z}$ and
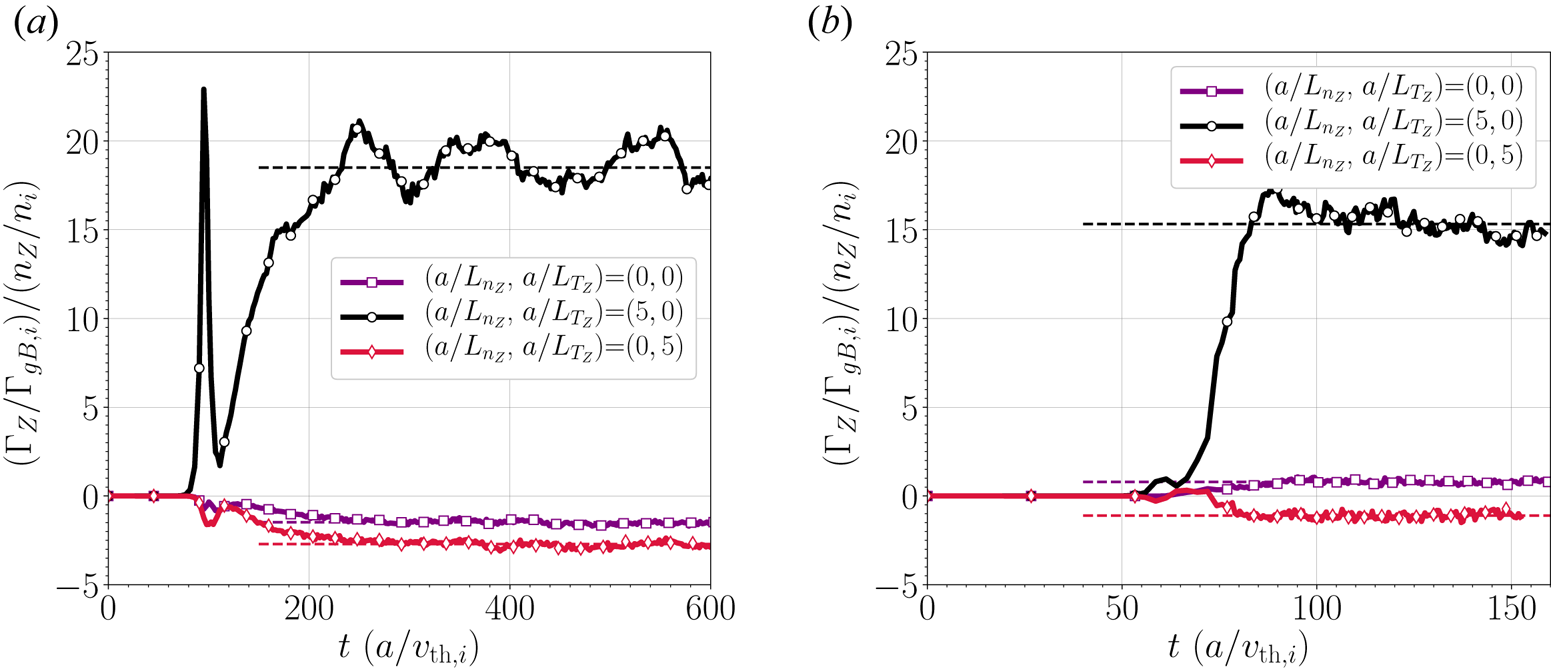
 $a/L_{T_Z}$, respectively. As an example, the three time traces of the turbulent flux of
 $\textrm {Ar}^{16+}$ are illustrated for the ITG case in figure 6(a) and for TEM turbulence in figure 6(b). For each of them, the mean value of the flux during the saturated phase is represented by a dashed line. Looking at the flux evolution when the impurity density and temperature gradients are zero (open squares linked by the purple solid line), it is immediately observed that each type of turbulence drives, in the absence of impurity density and temperature gradients, flux contributions with opposite sign. While ITG drives an inward (pinch) contribution, TEM turbulence drives outward transport (anti-pinch). Note that this first observation contradicts the quasilinear results, where in both cases
 $C_Z$ was positive, thus it drove negative flux for all
 $k_y$. However, that contribution is weak, and comparable to that arising when the temperature gradient is non-zero (open diamonds connected by the red solid line). On the other hand, the flux driven when only the density gradient is applied (open circles connected by the black solid line) is by far the largest, no matter if the background turbulence is ITG- or TEM-driven, which anticipates that ordinary diffusion will be the dominant contribution to the turbulent particle flux of impurities, as it will be quantitatively confirmed below for the other two impurity species considered.
Normalized  $\textrm {Ar}^{16+}$ particle flux as function of time in the presence of ITG-driven (a) and TEM-driven (b) background turbulence. The result is represented for three different pairs of Ar
 $^{16+}$ density and temperature gradients:
 $(a/L_{n_Z}, a/L_{T_Z})=(0,0)$ (squares);
 $(a/L_{n_Z}, a/L_{T_Z})=(5,0)$ (circles);
 $(a/L_{n_Z}, a/L_{T_Z})=(0,5)$ (diamonds).

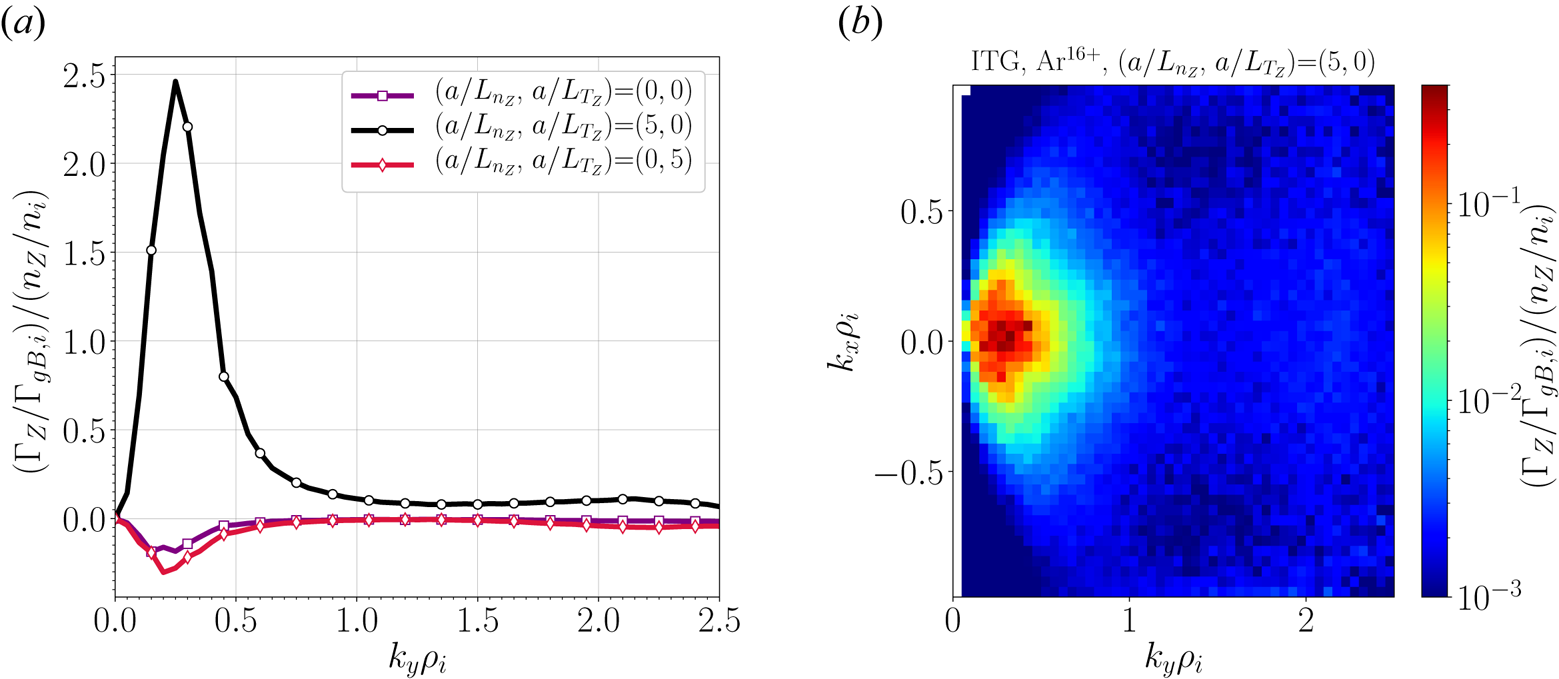
Given the width of the linear growth rate spectra of the simulated ITG and TEM modes, see figure 1, one might wonder if the turbulent flux spectra are that broad or if the chosen resolution does not leave important flux contributions out of the selected range of wavenumbers. For the case of  $\textrm {Ar}^{16+}$ embedded in ITG microturbulence, the binormal wavenumber spectrum is represented for the three simulated pairs of impurity density and temperature gradients in figure 7(a). It can be seen that most of the flux contribution arises from large scales with
 $k_{y}\lesssim 1$, although finite contributions can also be observed for the remaining part of the spectrum. This is particularly visible when the impurity density gradient is the only gradient applied (open circles connected by the black solid line). Regarding the radial wavenumber spectrum, figure 7(b) shows the spectrum
 $k_x$ and
 $k_y$ of the
 $\textrm {Ar}^{16+}$ converged flux. As for the ITG-driven turbulence, the largest contributions to the flux arise from a narrow region of large radial scales, with maximum contribution along
 $k_x=0$. Although not shown here, these features are found with little variation for the rest of estimated fluxes under ITG conditions, independently of the impurity species.
For ITG microturbulence: (a)  $k_y$-spectrum of the normalized turbulent flux of
 $\textrm {Ar}^{16+}$ considering
 $(a/L_{n_Z}, a/L_{T_Z})=(0,0)$ (squares),
 $(a/L_{n_Z}, a/L_{T_Z})=(5,0)$ (circles),
 $(a/L_{n_Z}, a/L_{T_Z})=(0,5)$ (diamonds); (b)
 $(k_x,k_y)$-spectrum of the normalized turbulent flux of Ar
 $^{16+}$ when
 $(a/L_{n_Z}, a/L_{T_Z})=(5,0)$.

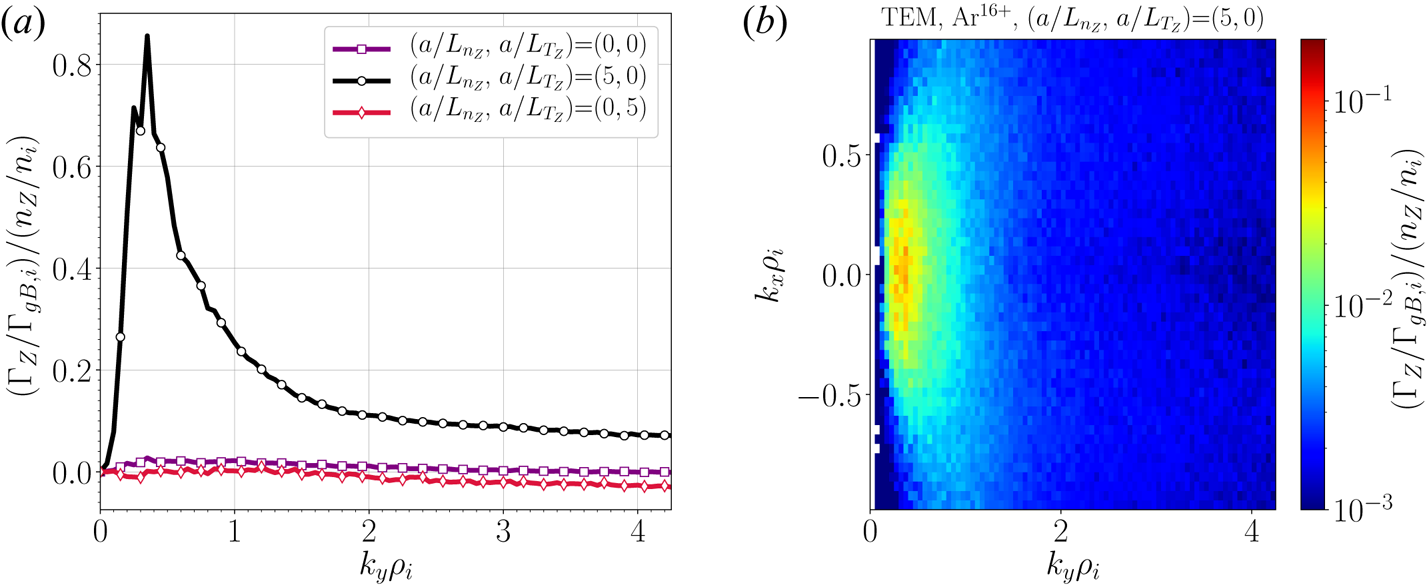
The equivalent two plots for the three simulations performed for Ar $^{16+}$ in the presence of TEM microturbulence are shown in figure 8. Panel (a), representing the binormal flux spectrum, reveals qualitative differences compared with the corresponding figure of the ITG case discussed in the previous paragraph, figure 7(a). Looking at the
 $k_y$-spectrum of the flux when
 $a/L_{n_Z}=5$, it is obvious that TEM turbulence leads to a noticeably broader flux spectrum. Although the flux of
 $\textrm {Ar}^{16+}$ finds its largest contribution at scales with
 $k_y\rho _i\approx 1$, the spectrum decays for increasing wavenumber less abruptly than in the ITG example. This yields appreciable flux contributions even at the largest
 $k_y$ represented. Concerning the radial direction, figure 8(b) depicts, for the case
 $a/L_{n_Z}=5$, the flux spectrum in
 $k_x$ and
 $k_y$, that exhibits a wider
 $k_x$ range with noticeable flux contributions than in the ITG case as well. Finally, regarding the much weaker flux driven in the absence of impurity density and temperature gradients, although difficult to appreciate due to the much smaller amplitude, no significant contributions to the flux are present for
 $k_y\gtrsim 2$. In contrast, when the impurity temperature gradient is set to a finite value, the flux spectrum slightly diverges as
 $k_y$ increases. It is worth noting that in that case two small contributions, connected to the thermodiffusion driven pinch and the anti-pinch in absence of gradients, are opposing to each other (see discussion about figure 6b), which may require a finer resolution than the one considered.
For TEM microturbulence: (a)  $k_y$-spectrum of the turbulent particle flux of
 $\textrm {Ar}^{16+}$ considering
 $(a/L_{n_Z}, a/L_{T_Z})=(0,0)$ (squares),
 $(a/L_{n_Z}, a/L_{T_Z})=(5,0)$ (circles),
 $(a/L_{n_Z}, a/L_{T_Z})=(0,5)$ (diamonds); (b)
 $(k_x,k_y)$-spectrum of the turbulent particle flux of Ar
 $^{16+}$ when
 $(a/L_{n_Z}, a/L_{T_Z})=(5,0)$.

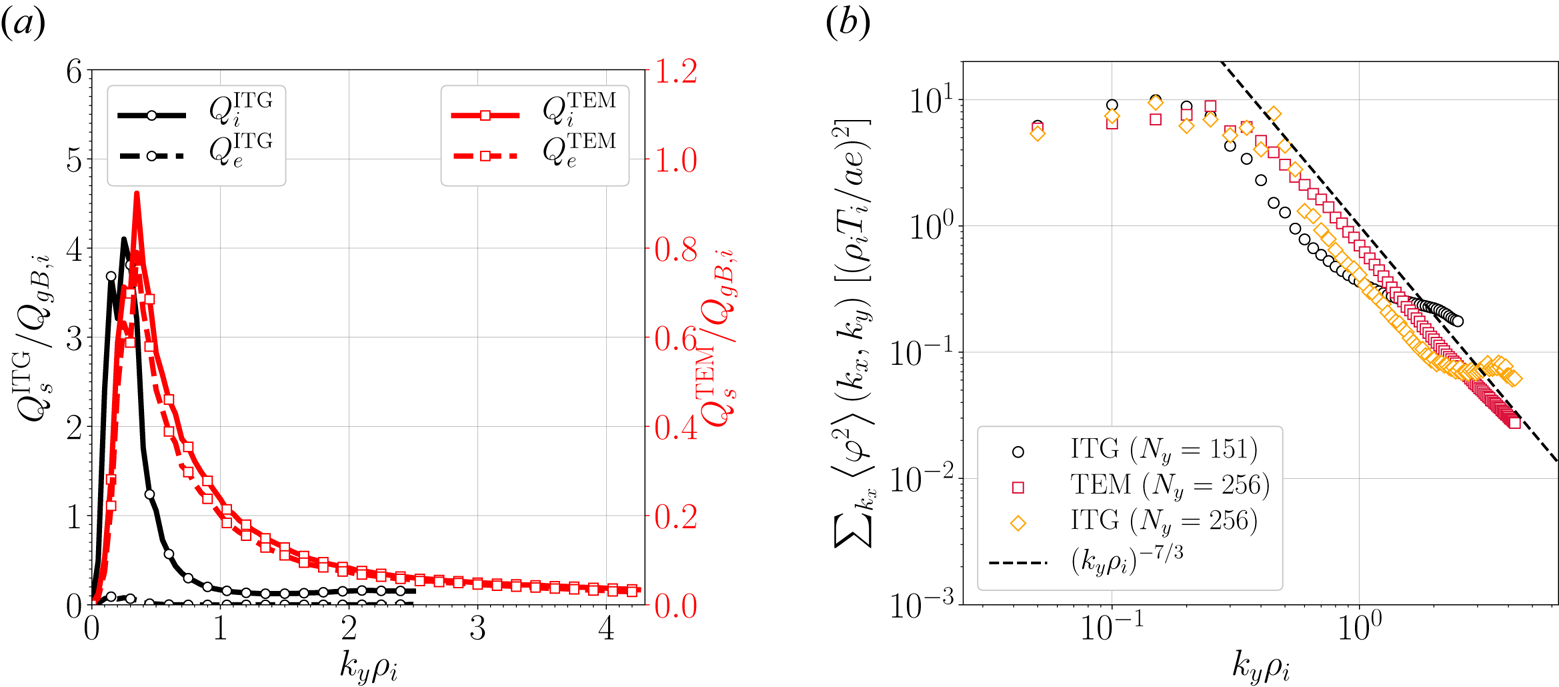
Despite the better delimitation of the ITG-driven impurity flux spectra within the considered wavenumber window in comparison with the TEM case, it is important to emphasize that other properties of interest of the background turbulence are equally well captured by both ITG and TEM simulations. Such is the case of the bulk ion and electron heat fluxes, whose spectra are represented in figure 9(a). Similarly to the impurity particle flux, the heat flux spectra are broader for the TEM case than for the ITG case. However, figure 9(a) demonstrates that, for the estimation of the heat fluxes, regardless of the type of turbulence and the species under consideration, there is margin to consider a narrower  $k_y$ range. With regard to the features that figure 9(a) illustrates, it is worth noting the comparable bulk ion and electron heat fluxes driven by the TEM turbulence and the practically negligible electron heat flux compared with the ion heat flux driven by the ITG turbulence. Another quantity of interest for the background turbulence is the electrostatic fluctuation spectrum, which is represented, for the two types of turbulence considered throughout this section, in figure 9(b). It can be immediately appreciated how TEM turbulent electrostatic fluctuations (open red squares) tightly follow a power law with exponent -7/3. For the ITG turbulence, the same power law is followed up to
 $k_y\rho _i\approx 1$, and deviates for larger values of
 $k_y\rho _i$. Note that this deviation is just a matter of resolution, as it shows up at lower
 $k_y$ values for the choice
 $N_y=151$ (open black circles) than for the finer resolution of
 $N_y=256$ (open orange diamonds). A specific investigation about why the ITG-driven particle flux spectra seem to be better bound by our mode window than for the TEM case, while the energy cascade is better converged for the TEM than for the ITG case, is beyond the scope of the present paper. But, in any case, this parenthetical remark leaves us the important conclusion that both ITG and TEM microturbulence in W7-X are intrinsically three-dimensional, as demonstrated in Barnes, Parra & Schekochihin (Reference Barnes, Parra and Schekochihin2011).
(a) Normalized bulk ion and electron heat flux spectra driven by the ITG turbulence (referred to the left-hand  $y$-axis) and the TEM turbulence (referred to the right-hand
 $y$-axis). (b) Electrostatic fluctuation spectrum for the ITG and TEM turbulence considered for the nonlinear impurity transport calculations. Note the selected resolution choices for the transport simulations considered
 $N_y=151$ and
 $N_y=256$ for the ITG (open black circles) and TEM (open red square), respectively. A third case is considered here, an ITG run with
 $N_y=256$ (open orange diamonds) for comparison. The dashed line indicated the power law
 $(k_y\rho _i)^{-7/3}$.

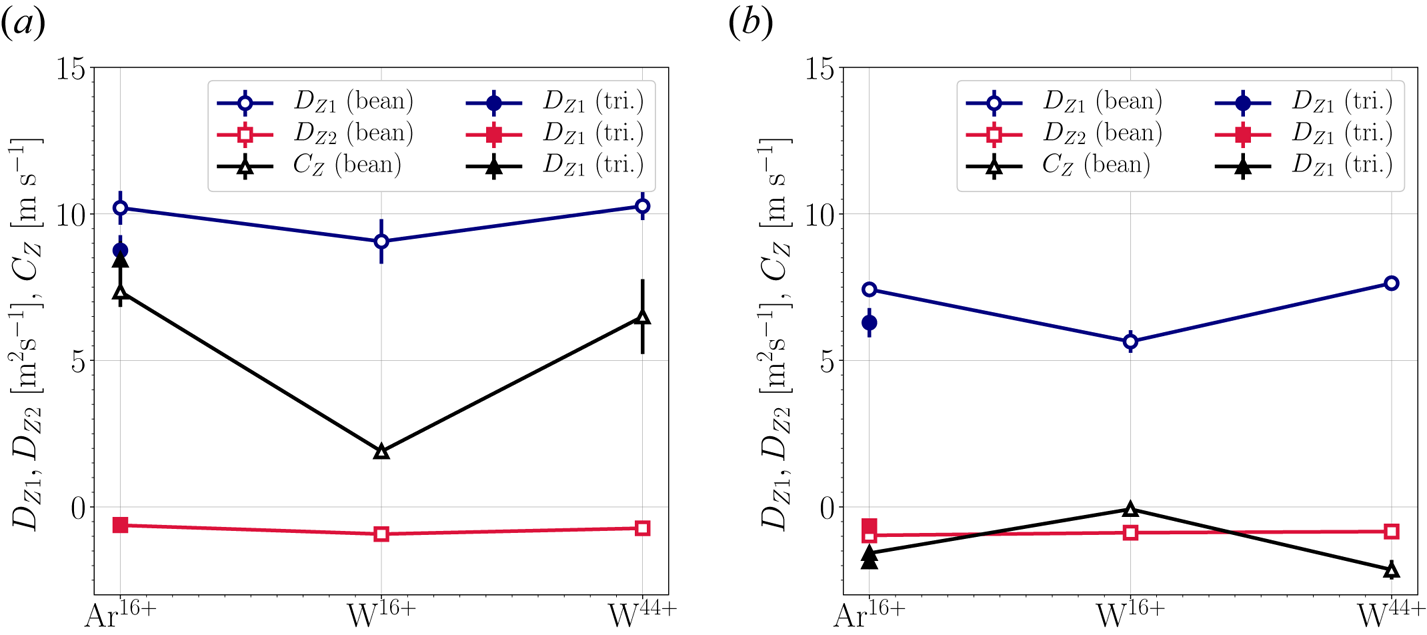
Returning to the question about the size of the transport coefficients of different impurities under the influence of different type of turbulence, figure 10 represents the ordinary diffusion coefficient, the thermodiffusion coefficient and the flux in the absence of impurity and density gradient of  $\textrm {Ar}^{16+}$,
 $\textrm {W}^{16+}$ and
 $\textrm {W}^{44+}$ embedded in ITG microturbulence, figure 10(a), and in TEM microturbulence, figure 10(b). Note that all calculations have been performed considering the bean flux tube and, for Ar
 $^{16+}$, the triangle flux tube as well. The reference electron density and ion temperature values considered are
 $n_e=10^{19}\ \textrm {m}^{-3}$ and
 $T_i=T_Z=1$ keV, respectively. Some features common to both cases are: (i) the dominance of the diffusion coefficient,
 $D_{Z1}$, above the other two coefficients, reaching values of around
 $10\ \textrm {m}^2\ \textrm {s}^{-1}$ and
 $6\text {--}7 \ \textrm {m}^2\ \textrm {s}^{-1}$ for ITG and TEM turbulence, respectively; (ii)
 $D_{Z2}$ is substantially smaller than
 $D_{Z1}$ and adds a pinch contribution (assuming peaked
 $T_Z$ profiles) to the radial transport of the three species under investigation; (iii) ordinary diffusion and thermodiffusion are practically independent on the mass and the charge state, however, the absolute value of
 $C_Z$ is reduced appreciably for
 $\textrm {W}^{16+}$, possibly related to its smaller charge to mass ratio compared with that for the other two impurities; (iv) in both cases, moving to the triangle flux tube yields, for
 $\textrm {Ar}^{16+}$, a reduction of
 $D_{Z1}$, although not particularly strong, a negligible modification of
 $D_{Z2}$ and a slight increase of the absolute value of
 $C_{Z}$. The only features that are clearly different for the ITG and the TEM cases are related to
 $C_Z$: (i) the positive sign of
 $C_Z$ adds a pinch contribution in the ITG case, while the negative sign of
 $C_Z$ for the TEM case contributes to expulse impurities (see expression (2.1)); (ii) the absolute value of
 $C_Z$ is noticeably larger for ITG than for TEM. Of all these features, it is worth mentioning that the large relative size of
 $D_{Z1}$ or the low size and sign of
 $D_{Z2}$ are qualitative characteristics advanced by the quasilinear analysis. On the other hand, the relative strength between the ITG- and TEM-driven
 $D_{Z1}$ as well as the sign and size of
 $C_Z$ for the TEM turbulence are not captured by the quasilinear simulations.
For the bean flux tube (open dots), diffusion coefficient,  $D_{Z1}$, thermodiffusion coefficient,
 $D_{Z2}$ and flux at vanishing
 $T'_Z$ and
 $n'_Z$,
 $C_Z$, for
 $\textrm {Ar}^{16+}$,
 $\textrm {W}^{16+}$ and
 $\textrm {W}^{44+}$ in the presence of ITG (a) and TEM (b) microturbulence. For comparison, the values of the transport coefficients of
 $\textrm {Ar}^{16+}$ obtained for the triangle flux tube are represented with filled dots. Reference density and temperature values of
 $n_e=10^{19}\ \textrm {m}^{-3}$ and
 $T_i=T_Z=1$ keV have been considered.

Finally, it is important to recall that the equilibrium impurity density gradient is determined by the value of the peaking factor, which is expressed as the ratio of the total convection velocity,  $V$, and the diffusion coefficient
 $D$. In terms of the three coefficients under discussion, the peaking factor reads as
 \begin{equation} \frac{V}{D}=-\frac{D_{Z2} \,\text{d}\ln T_Z/\text{d} r +C_Z}{D_{Z1}}. \end{equation}
In practical terms, the numerical demonstration of the large diffusion coefficient just shown yields the conclusion that microturbulence, of the ITG and TEM kind, should tend to form impurity density profiles close to flatness.Footnote 4 For instance, for the values shown in figure 10(a) the resulting peaking factor in equilibrium, although negative for ITG background conditions, would reach large absolute values only if the impurity temperature gradient were unrealistically strong. The peaking factor would be even weaker in the presence of TEM turbulence, since it exhibits a rather weak anti-pinch at vanishing  $T'_Z$ and
 $n'_Z$ together with a pinch contribution of comparable size driven by thermodiffusive processes, which would in the end lead to a peaking factor fairly close to zero. On the other hand, the fact that
 $C_Z$ results in an outward contribution to the flux opens the possibility that TEM drives hollow impurity density profiles, and motivates a deeper investigation of the properties of this pinch on the magnetic configuration space of W7-X.
2.3. Nonlinear turbulent transport of non-trace impurities
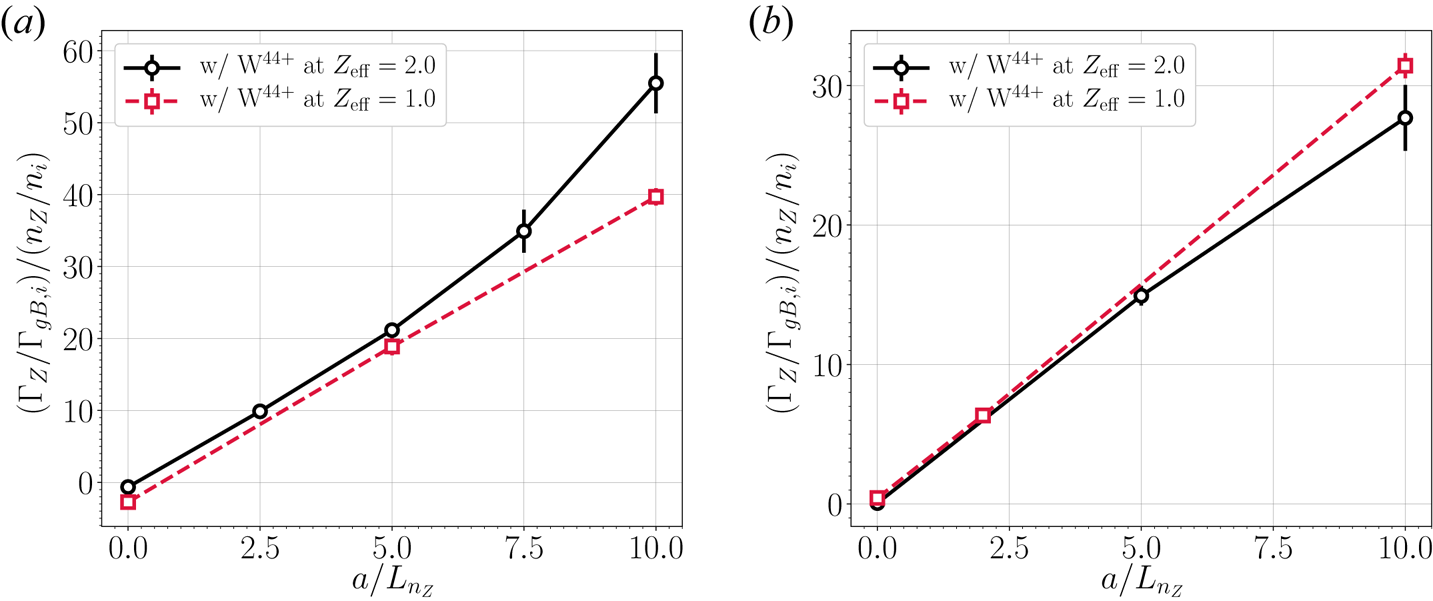
All the calculations up to this section have considered impurities at trace concentration, so that they responded to the background turbulence driven by the bulk species gradients without affecting that turbulence. In that situation, the flux of the impurities scales linearly with their density and temperature gradients, the impurity transport coefficients are constant as long as the background turbulence is not altered, and they can be obtained by employing expression (2.1). Nonetheless, in laboratory plasmas impurities are frequently present at non-trace concentration levels, and the assumption of impurity turbulent fluxes scaling proportionally to the impurity density and temperature gradients does not necessarily hold. For this reason, the present subsection touches on the question of how much the tendency of the impurity flux deviates from linear when the impurity concentration is no longer negligible. It is not the intention of the present section to provide a detailed study including several species and different background turbulence, as done in § 2.2 for the nonlinear analysis for trace impurities. The purpose is rather to shed some light that indicates to what degree the conclusions drawn in § 2.2 can be extrapolated for realistic impurity content. We have performed a series of simulations considering  $\textrm {W}^{44+}$ at a concentration such that the effective charge is
 $Z_{\text {eff}}=2$. Only the impurity density gradient has been scanned, keeping
 $a/L_{T_{Z}}=0$, as we have seen that density gradient drives the dominant contribution to the turbulent flux of impurities. The resulting normalized turbulent fluxes of W
 $^{44+}$ are represented in figure 11(a) for the ITG-driven background turbulence and in figure 11(b) for the TEM case. For the curves representing the flux of
 $\textrm {W}^{44+}$ at
 $Z_{\text {eff}}=2$, it can be observed that the deviation from the linear trend is only noticeable at rather large normalized density gradient values, larger than
 $a/L_{n_Z}\approx 5$. This deviation is more obvious for the ITG case than for the TEM, and each of them points to opposite effects: while the TEM-driven turbulent transport of tungsten tends to be weakened with respect to the linear behaviour, the ITG-driven flux is enhanced. Apart from that, the presence of non-trace tungsten introduces an offset with respect to the linear trend in the ITG case, that is not found for the TEM. In other words, the presence of tungsten at non-trace concentration is altering the value of the ITG-driven pinch in the absence of tungsten density and temperature gradients towards making it nearly zero, as can be noted looking at the two points represented for
 $a/L_{n_Z}=0$. In any case, a closing remark from these simulations is that, unless
 $Z_{\text {eff}}$ is much larger than
 $2$, the dependence of the impurity fluxes on the impurity density gradient seems close enough to linear so that the conclusions drawn in § 2.2 can be extrapolated to moderately realistic values of
 $Z_{\text {eff}}$.
Normalized radial particle flux of  $\textrm {W}^{44+}$ as a function of its normalized density gradient at trace concentration (open squares) and at a concentration that makes
 $Z_{\mathrm {eff}}=2.0$ (open circles), for ITG (a) and TEM (b) microturbulence.

3. Conclusions
In the present work, the transport of impurities driven by gyrokinetic microturbulence has been investigated for W7-X geometry. Quasilinear calculations and nonlinear collisionless simulations have been performed in the flux tube and electrostatic approximations with the recently developed code stella. The transport coefficients of several trace impurities in the presence of ITG, TEM and ETG unstable conditions have been analysed. The ETG, only considered in the quasilinear analysis, has shown substantially smaller impurity transport coefficients compared with the ITG and TEM cases. The conclusions drawn from the nonlinear results for ITG and TEM microturbulence indicate that, independent of the charge and the mass of the impurity, the turbulent transport is dominated by ordinary diffusion, and that thermodiffusion contributes very weakly to push the impurities radially inward. The estimated diffusion coefficient has been found to be in qualitative agreement with the experimental one reported for W7-X plasmas. The contribution driven in the absence of gradients,  $C_Z$, has been found to be a pinch in the presence of ITG microturbulence and an anti-pinch under the influence of the TEM conditions. These features, some of them qualitatively anticipated by the quasilinear calculations, translate into an optimistic picture of the transport of impurities in W7-X, where the large microturbulence driven diffusion would contribute to produce nearly flat equilibrium impurity density profiles, free of strong radial localization of impurities. The possible extrapolation of these conclusions to realistic non-trace concentration of impurities has been partially confirmed by simulations at
 $Z_{\text {eff}}=2$, that have demonstrated that the diffusion coefficient does not deviate substantially from a linear dependence on the impurity density gradient. Finally, immediate extensions of the present work shall include, on the one hand, calculations of the impurity flux employing W7-X experimental radial profiles and, on the other hand, the assessment of the impact that effects not included here, like the radial electric field shear or collisions, may have on our results.
Acknowledgements
This work has been carried out within the framework of the EUROfusion Consortium and has received funding from the Euratom research and training programme 2014–2018 and 2019–2020 under grant agreement no. 633053. The views and opinions expressed herein do not necessarily reflect those of the European Commission. This research was supported in part by grant PGC2018-095307-B-I00, Ministerio de Ciencia, Innovación y Universidades, Spain. The simulations were carried out in the clusters Marconi (Cineca, Italy) and Xula (Ciemat, Spain). J.M.G.R. is grateful to A. Bañón-Navarro for helpful discussions.
Editor Nuno Loureiro thanks the referees for their advice in evaluating this article.
Declaration of interests
The authors report no conflict of interest.