INTRODUCTION
Different ecological factors influence group formation patterns among different dolphin species. Resource protection, prey acquisition and predation risk are probably the most critical forces favouring group living, especially among delphinids (Connor, Reference Connor, Mann, Connor, Tyack and Whitehead2000). Dolphins live in complex social groups, inhabiting three-dimensional open-water habitats where food resources are unpredictable and patchily distributed (Norris & Dohl, Reference Norris, Dohl and Herman1980). When cooperatively searching and hunting for food, dolphins expand the search area and also collaborate to keep prey from escaping, which in turn reduces the energetic costs of foraging (Würsig & Würsig, Reference Würsig and Würsig1980; Würsig, Reference Würsig, Schusterman, Thomas and Wood1986). The intricate social relationships among individual dolphins do not imply, however, that groups are necessarily a permanent unit of a given size formed by the same animals. Groups vary widely in size and individuals may move freely to larger aggregations resulting in a fission–fusion society (Norris & Dohl, Reference Norris, Dohl and Herman1980; Connor et al., Reference Connor, Wells, Mann, Read, Mann, Connor, Tyack and Whitehead2000). Animals exhibiting this type of system enjoy great flexibility in responding to availability, distribution and different-sized resource patches (Terborgh & Janson, Reference Terborgh and Janson1986; Bearzi & Stanford, Reference Bearzi and Stanford2007). Group formation can be also highly influenced by predation pressure in the habitat (Karczmarski et al., Reference Karczmarski, Würsig, Gailey, Larson and Vanderlip2005). Under attack, dolphins may behave as schooling fish, where the collective formation confers reduced individual risk based on anti-predatory strategies which increase the environmental surveillance by different members of the group and may also confuse the predator (Norris & Schilt, Reference Norris and Schilt1988; Connor, Reference Connor, Mann, Connor, Tyack and Whitehead2000).
Guiana dolphins (Sotalia guianensis Van Beneden, 1864) live in an apparent fission–fusion society (Santos & Rosso, Reference Santos and Rosso2008a) and are reported to form groups throughout their known areas of distribution, with lone animals rarely observed. Group sizes vary widely among studies and populations, and the behavioural and environmental characteristics that influence group formation patterns are also highly variable (Geise et al., Reference Geise, Gomes and Cerqueira1999; Edwards & Schnell, Reference Edwards and Schnell2001; Flores & Bazzalo, Reference Flores and Bazzalo2004; Azevedo et al., Reference Azevedo, Viana, Oliveira and Van Sluys2005, Reference Azevedo, Oliveira, Vianna and Van Sluys2007; Daura-Jorge et al., Reference Daura-Jorge, Wedekin, Piacentini and Simões-Lopes2005; Flores & Fontoura, Reference Flores and Fontoura2006; Flach et al., Reference Flach, Flach and Chiarello2008).
Guiana dolphin mean group sizes usually range from two to 13 individuals (Di Beneditto et al., Reference Di Beneditto, Ramos and Lima2001; Edwards & Schnell, Reference Edwards and Schnell2001; Azevedo et al., Reference Azevedo, Viana, Oliveira and Van Sluys2005; Santos & Rosso, Reference Santos and Rosso2008b). However in south-eastern Brazil, mean sizes range from 29 to 32 individuals (Lodi, Reference Lodi2003; Daura-Jorge et al., Reference Daura-Jorge, Wedekin, Piacentini and Simões-Lopes2005; Flach et al., Reference Flach, Flach and Chiarello2008). And in south Brazil, Flores & Fontoura (Reference Flores and Fontoura2006) reported even larger group sizes, with most Guiana dolphin encounters ranging from 60 to 80 individuals.
In Sepetiba Bay, Rio de Janeiro, south-eastern Brazil Flach et al. (Reference Flach, Flach and Chiarello2008) recorded groups of one to 280 individuals; with a mean size of 30 individuals per group. In addition, seven per cent of their dolphin encounters consisted of large aggregations with more than 100 animals each. Considering the magnitude of large aggregations involving a substantial number of animals, its further investigation could provide valuable data on the behavioural and ecological characteristics of Guiana dolphins in Sepetiba Bay which might contribute to future conservation of this species in the region.
The objective of this study was to investigate the occurrence of Guiana dolphin aggregations regarding their seasonal, diel and spatial distributions; behavioural activities, age composition and the environmental parameters measured during their occurrence in Sepetiba Bay.
MATERIALS AND METHODS
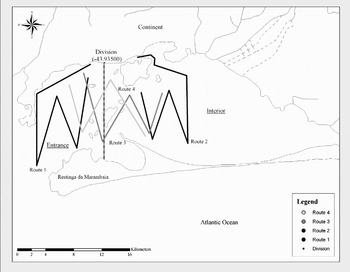
Sepetiba Bay, located in Rio de Janeiro, south-eastern Brazil (23°04′–22°54′ S/44°03′–43°34′ W), consists of an elongated semi-enclosed body of water with a surface area of approximately 520 square km. The largest west–east extension is 40 km and the largest north–south extension is 20 km (Copeland et al., Reference Copeland, Monteiro, Couch and Borthwick2003). The average depth is 8 m, but dredged canals with 20–30 m in depth are also present. The continent delimits the bay on its northern and eastern borders, a sand bar (Restinga da Marambaia) separates the bay from the Atlantic Ocean at the southern part, and the connection with the ocean is at the western portion of the bay (Flach et al., Reference Flach, Flach and Chiarello2008) (Figure 1).
Sepetiba Bay's geographical divisions and line transects used during the study, ArcGIS® version 9.

Boat surveys were conducted on a daily basis, according to sea conditions, covering most of the area of the bay (400 km2) and following four pre-established line transects randomly alternated on each survey day (Figure 1). A 7.5 m boat equipped with a 120 horse power onboard motor was used during the surveys with two observers at the bow and one pilot.
When Guiana dolphins were sighted, the boat was cautiously moved towards the location where the animals were first seen. The term sighting was defined as a dolphin encounter with either a group or an aggregation during the course of the survey and represents the sampling unit (modified from Flores & Fontoura, Reference Flores and Fontoura2006; Flach et al., Reference Flach, Flach and Chiarello2008). Groups were defined as dolphins observed in apparent association usually engaged in the same behaviour and moving in the same direction, within the observers' visual range. A sighting was considered an aggregation if it contained several groups gathered in an area usually engaged in the same behaviour but not necessarily moving in the same direction and totalling more than 100 animals (Flach et al., Reference Flach, Flach and Chiarello2008). During all dolphin sightings, time consisted of hour of day in which the animals were sighted; their position was registered using the Global Positioning System once the boat reached the point in which the animals were first seen; environmental parameters consisted of water depth (m), salinity (parts per thousand), temperature (Celsius), tide (in, high; out, low) and presence of sea birds at the sightings' location. For groups, the estimated sighting size (minimum, maximum and best number of animals counted), composition according to body size (adults, juveniles, calves and neonates) (Flores & Fontoura, Reference Flores and Fontoura2006), and behaviour (feeding/foraging, travelling, socializing, resting, mixed and unknown) (modified from Shane, Reference Shane, Leatherwood and Reeves1990; Flach et al., Reference Flach, Flach and Chiarello2008) were recorded using the scan group sampling method after five minutes of observation (Mann, Reference Mann, Mann, Connor, Tyack and Whitehead2000; Flach et al., Reference Flach, Flach and Chiarello2008). For an aggregation, the boat was piloted linearly across the aggregation to estimate best sighting size (sum of number of animals counted by two observers facing opposite directions at the bow), composition according to body size (adults, juveniles, calves and neonates) (Flores & Fontoura, Reference Flores and Fontoura2006), and behaviour performed by the most animals (feeding/foraging; travelling, socializing, resting, mixed and unknown)(modified from Shane, Reference Shane, Leatherwood and Reeves1990; Flach et al., Reference Flach, Flach and Chiarello2008).
All analyses were conducted using the Minitab® 15 Statistical Software. Some variables measured in the field derived binary variables used in the statistical analyses: (a) sighting category (according to the best number of animals counted): group or aggregation; (b) temporal distribution: season (winter: May–October or summer: November–April) and period of day (morning: 06:00–11:59 or afternoon: 12:00–17:00); (c) spatial distribution (sightings' geographical location: entrance of bay: west of –43.93500) or interior: east of –43.93500) (Figure 1); (d) sighting composition (presence or absence of neonates and calves); and (e) sea birds (presence or absence of birds).
The Chi-square cross-tabulation test (χ2) was performed to examine variation between binary variables: sighting category according to temporal distribution, spatial distribution, sighting composition, and presence of sea birds. The Chi-square cross-tabulation test (χ2) was also utilized to assess variation of sighting category according to behavioural activities and tide level. To specifically test for differences in behaviour between the two sighting categories, two proportions tests (Z) were used as behaviour is a non-binary variable. The Kruskal–Wallis test (H) was performed to investigate differences in water depth, temperature and salinity recorded during the occurrence of groups and aggregations, to examine differences in size for aggregations at the entrance and interior of the bay, and in size for aggregations registered at different periods of the day. A multivariate regression analysis was performed in order to investigate the existence of co-linearity between sighting category and spatial distribution, water salinity, depth and temperature.
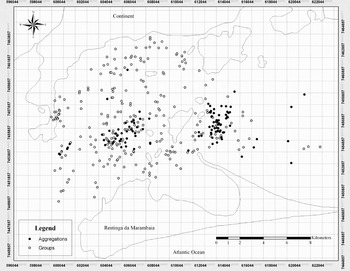
The GPS records of groups and aggregations were plotted in a map using the ESRI ArcGIS® version 9 (Figure 2). The map's coordinate system was converted from World Geodetic System (WGS'84—degrees) into Universal Transverse Mercator (UTM 23°S—metres) resulting in grids that determined one km2 cells. Two or more adjacent cells, each containing at least one dolphin sighting, constituted a cluster.
Groups and aggregations spatial distribution and configuration according to grid division in Sepetiba Bay, ArcGIS® version 9.

RESULTS
Between August 2005 and July 2007, 199 one-day boat surveys were performed in Sepetiba Bay. On average, eight survey days were performed per month, with dolphins encountered 90% of the survey days. A total of 376 dolphin sightings were recorded, ranging from one to 450 animals (mean = 73; ±93; median = 25). For the purposes of this study, dolphin encounters were classified as two sighting categories: groups or aggregations. Groups (N = 268; mean = 20; ±20; median = 12) ranged from one to 90 individuals, with most sightings (69%) having between two and 20 animals. Aggregations (N = 108; mean = 204; ±70; median = 190) ranged from 100 to 450 individuals, with most sightings (63%) containing up to 200 animals.
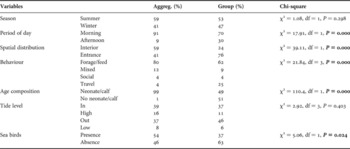
Guiana dolphin groups and aggregations were recorded year round; on average 11 groups and 4.5 aggregations were recorded per month during the two-year study period. Groups and aggregations did not show significant variation according to season (Table 1). On the other hand, a significant difference was found according to the period of the day in which the dolphin sighting was recorded, with a significantly greater proportion of aggregations than groups being observed during morning hours (Table 1).
Chi-square analyses (χ2) for aggregations (aggreg.) and groups by variables measured during the study. Bold font indicates significant values (P < 0.05).

A significant difference in the spatial distribution of groups and aggregations was found within Sepetiba Bay; most aggregations were recorded at the interior, while most groups were encountered at the entrance (Table 1; Figure 2). After visual inspection of the plotted GPS records of all dolphin sightings, it was possible to verify a different spatial configuration between records of groups and aggregations across the bay (Figure 2). Groups were widely distributed and aggregations, on the other hand, formed mainly two visually distinct clusters of distribution, one at the entrance and one at the interior of the bay. The entrance-cluster measured 13 km2 in area (13 cells) and had 37 aggregations recorded; the interior-cluster measured 12 km2 in area (12 cells) and had 54 records of aggregations. Therefore, 85% of aggregations were recorded within cluster areas and only 16 aggregations (15%) were recorded outside the cluster areas.
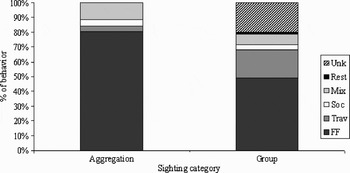
Resting and unknown behaviours were only recorded for groups (Figure 3) and were therefore removed from analyses involving sighting category. Overall, behavioural activity varied significantly according to sighting category (Table 1). Specifically, two proportions tests indicated significant differences between aggregations and groups, in foraging/feeding and travelling behaviours (Z = 3.31, P = 0.001 and Z = −5.34, P = 0.000, respectively). However, socializing and mixed behaviours did not show significant differences between groups and aggregations (Z = −0.11, P = 0.913 and Z = 0.66, P = 0.508, respectively).
Distribution of behavioural activities for Guiana dolphin aggregations and groups in Sepetiba Bay; FF, foraging/feeding; Trav, travelling; Soc, socializing; Mix, mixed; Rest, resting; Unk, unknown.

Dolphins of all age-classes were present in both groups and aggregations. However, aggregations showed significantly more presence of neonates and calves than did groups. Neonates and calves were verified in all but one aggregation, while their presence was observed in only half the groups (Table 1).
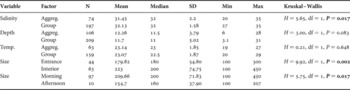
Environmental parameters measured during the dolphin sightings consisted of tide level, water temperature, depth, salinity and the presence of sea birds at the site of encounter. Sighting category was not found to vary significantly by tide level (Table 1), water temperature and depth (Table 2). The salinity in which the dolphin sightings were recorded, however, showed a significant influence, with aggregations occupying slightly lower salinity waters than did groups (Table 2). Nonetheless, a multivariate regression analysis showed that spatial distribution (sightings' geographical location) was the significant driver (coefficient = 0.351, P = 0.000) in the occurrence of aggregations instead of water salinity (coefficient = −0.032, P = 0.156), as well as temperature (coefficient = −0.012, P = 0.516) and depth (coefficient = 0.008, P = 0.340). The presence of sea birds was found to be significantly different by sighting category, with their presence more likely recorded during aggregations (Table 1).
Kruskal–Wallis analyses (H) and descriptive values of water salinity, depth and temperature (Temp.) measured for aggregations (aggreg.) and groups, of aggregations size at the entrance and interior of Sepetiba Bay, and of aggregations size during the morning and afternoon. Bold font indicates significant values (P < 0.05).

Min, minimum; Max, maximum.
Within aggregations, records at different geographical locations varied in size, with larger aggregations at the interior. In addition, aggregations registered during morning hours were significantly larger than aggregations recorded in the afternoon (Table 2).
DISCUSSION
Guiana dolphin aggregations in Sepetiba Bay consisted of a congregation of dolphins engaged mainly in foraging/feeding activities, and primarily located at the interior of the bay. Aggregations contained dolphins of all age-classes, but the presence of neonates and calves was considerably higher than in groups. Records of aggregations formed clusters of distribution at the interior and entrance of Sepetiba Bay and comprised 29% of all dolphin sightings during the study period.
Guiana dolphins in aggregations expressed considerably more foraging/feeding behaviours than in groups. The congregation of a large number of animals during hunting events might optimize individual foraging/feeding activities, where a greater number of animals might be optimal for herding schools of fish. Würsig & Würsig (Reference Würsig and Würsig1980) observed the recruitment of groups of dusky dolphins (Lagenorhynchus obscurus) to feeding areas from as far away as 8 km with the animals coalescing into larger aggregations of up to 300 individuals. Additionally, the larger the group, the longer the feeding activity lasted, as the animals would cooperatively keep fish from escaping.
If dolphins are aggregating in order to cooperatively hunt for fish, the distribution of prey species might determine the location in which aggregations occur in Sepetiba Bay. The remarkable presence of aggregations at the interior of Sepetiba Bay in addition to the fact that aggregations at the interior were significantly larger than at the entrance, might be correlated with the fish populations occurring in this area. A study of the fish community in Sepetiba Bay demonstrated that the entrance and interior of the bay have different fish composition; the richness of species at the interior is lower than at the entrance, but abundance of specimens is higher (Araújo et al., Reference Araújo, Cruz-Filho, Azevedo and Santos1998). In accordance, large schools of sardines (Sardinella brasiliensis: Clupeidae) are more likely encountered at the interior of the bay than at the entrance (Pessanha & Araújo, Reference Pessanha and Araújo2003; Silva & Araújo, Reference Silva and Araújo2003). Analysis on stomach contents of Guiana dolphins in Sepetiba Bay supports that Clupeidae fish (anchovies and sardines) constitute an important portion of the feeding habits of this population (Flach, unpublished data). In addition, Lodi & Hetzel (Reference Lodi and Hetzel1998) observed Guiana dolphin aggregations feeding upon large schools of sardines in Paraty Bay. Similarly, dusky dolphin aggregations in Argentina were registered cooperatively feeding upon large schools of southern anchovies (Engraulis anchoita, Clupeidae) (Würsig & Würsig, Reference Würsig and Würsig1980). Therefore, Guiana dolphin aggregations in Sepetiba Bay might be congregating at the interior in order to prey upon locally abundant prey items, along with larger aggregations and greater optimization of individual feeding opportunities.
The records of Guiana dolphin aggregations in Sepetiba Bay formed cluster areas both at the entrance and interior of the bay (Figure 2). In addition to prey distribution, the concentration of aggregations in specific regions might be related to the topography of the area which includes islands, rocks and dredged channels with different water depths. Hunting animals may utilize irregularities in topography and relief to help in capturing prey items consequently reducing the energetic costs of foraging. Bottlenose dolphins (Tursiops truncatus) in Moray Firth, Scotland were observed at narrow points which possibly acted as bottlenecks, with deep waters, rapid changes in bottom relief, and strong tidal currents (Wilson et al., Reference Wilson, Thompson and Hammond1997). Guiana dolphin aggregations clustered in specific areas of Sepetiba Bay could therefore reflect the utilization of such barriers in facilitating prey capture.
The observation of no seasonality in the occurrence of aggregations might be also related to prey availability, suggesting a year-round accessibility to different prey items. Likewise, for most areas of distribution of Guiana dolphin, seasonal variations in group size could not be detected (Edwards & Schnell, Reference Edwards and Schnell2001; Azevedo et al., Reference Azevedo, Viana, Oliveira and Van Sluys2005; Flores & Fontoura, Reference Flores and Fontoura2006; Flach et al., Reference Flach, Flach and Chiarello2008; Santos & Rosso, Reference Santos and Rosso2008b).
Not seasonality but period of day might indirectly influence the formation of Guiana dolphin aggregations in Sepetiba Bay. During this study, relatively more aggregations were recorded at morning hours than groups. A daily variation in the number of dolphins and their behaviour might be driven by peaks in abundance and displacement of prey species at different periods of the day. In Sepetiba Bay some fish species showed a diel change pattern, with higher abundances during daylight hours and peaks at sunset and sunrise (Pessanha et al., Reference Pessanha, Araújo, Azevedo and Gomes2003). Azevedo et al. (Reference Azevedo, Oliveira, Vianna and Van Sluys2007) observed diel variations in the behavioural patterns of Guiana dolphin in Guanabara Bay probably caused by fluctuations in the abundance and distribution of prey; with animals performing foraging/feeding activities during the morning with a second peak in late afternoon. The formation of foraging/feeding aggregations in Sepetiba Bay might be favoured by the availability and displacement of prey items during morning hours. Further indication for this hypothesis comes from the fact that aggregations in the morning were significantly larger than aggregations recorded in the afternoon. Nonetheless, it was not possible to confirm or refute the possibility of a second peak in the occurrence of aggregations at sunset as all boat surveys ended no later than 17:00.
The presence of neonates and calves was verified in all but one aggregation, while their presence was observed in only half the groups. In addition to feeding opportunities, large dolphin groups confer better individual protection and learning opportunities for younger animals (Karczmarski, Reference Karczmarski1999; Lodi, Reference Lodi2003). For Guiana dolphin groups in Paraty Bay, sightings with calves were significantly larger than groups without their presence (Lodi, Reference Lodi2003). In Guanabara Bay a similar trend was observed, with calves occurring in larger nursery groups usually twice the size of non-calf groups (Azevedo et al., Reference Azevedo, Viana, Oliveira and Van Sluys2005). In Sepetiba Bay, the remarkable presence of neonates and calves in aggregations suggests a greater exposure of these young individuals to learning opportunities regarding prey species and hunting strategies during the occurrence of those events.
Water salinity drove a significant variation in the records of groups and aggregations. However, this environmental parameter was negatively correlated with the sightings geographical location, and the fact that aggregations were associated to lower salinity values is probably due to the considerable presence of aggregations at the interior of the bay, which has the best preserved mangrove areas (Silva et al., Reference Silva, Araújo, Azevedo and Mendonça2003) and receives most of the freshwater inputs from the continent (Molisani et al., Reference Molisani, Marins, Machado, Paraquetti, Bidone and Lacerda2004). Salinity probably has little direct influence on the dolphins, it appears to influence the dolphins prey distribution instead (Edwards & Schnell, Reference Edwards and Schnell2001). The distribution of sardines (S. brasiliensis) was negatively correlated with salinity in Sepetiba Bay, therefore being more likely found at the interior than at the entrance of the bay (Pessanha & Araújo, Reference Pessanha and Araújo2003; Silva & Araújo, Reference Silva and Araújo2003).
Sea birds were observed more frequently during the occurrence of aggregations than groups. Usually three bird species would be present during a dolphin sighting, terns (Sterna sp.), frigates (Fregata magnificens) and boobies (Sula leucogaster) performing fishing, flying and/or resting activities. Also in Sepetiba Bay, Flach et al. (Reference Flach, Flach and Chiarello2008) recorded larger groups of feeding Guiana dolphins during interactions with sea birds, probably related to the feeding activity of the dolphins or vice versa. Würsig & Würsig (Reference Würsig and Würsig1980) suggested that sea birds flying over feeding dusky dolphins (L. obscurus) in Argentina served as a signal to other dolphins in locating the feeding site. However, the extent of aggregated dolphins and birds interacting as a recruiting signal remains to be further studied in Sepetiba Bay.
The Guiana dolphin population in Sepetiba Bay is the largest population of the species so far documented in the Brazilian coast (Flach et al., Reference Flach, Flach and Chiarello2008). Increasing human activity at the bay demands the implementation of conservation strategies. The two clusters of aggregations found by this study indicate potential areas where such strategies could be employed, thus protecting a major proportion of the population.
ACKNOWLEDGEMENTS
Bill Rossiter from the Cetacean Society International and the Agency for Graduate Concerns from Florida Atlantic University for the financial support during this study. Gary Schnell, Liliane Lodi and Paulo Flores for providing valuable papers. Jenny Litz and Facundo Barrera for the helpful suggestions on the improvement of this manuscript. Lucas Goulart, Renata Vieira and Bernardo Grieco for the help in the field work. Vale crew, Phillip Scott, Orlando Afonso and Patricia Amaral. Thank you all.