Introduction
Soybean [Glycine max (L.) Merr.] is the second most important crop worldwide used for animal feed and human foods. Soybean is cultivated globally, especially in the USA, Brazil, Argentina and China. According to Hymowitz (Reference Hymowitz, Johnson, White and Galloway2008), Southeast Asia is the geographical origin of the genus Glycine. The closest extant wild relative of domesticated soybean is Glycine soja, which is considered to be its undomesticated progenitor over 3000 years ago (Doebley et al., Reference Doebley, Gaut and Smith2006). G. max and G. soja possess valuable morphological, physiological and biochemical traits (Carter et al., Reference Carter, Hymowitz, Nelson and Werner2004a, Reference Carter, Nelson, Sneller, Cui, Boerma and Spechtb; Chan et al., Reference Chan, Qi, Li, Wong and Lam2012) which can be beneficial for crop improvement. Hybrids between accessions of the two species can successfully produce viable and fertile progeny (Singh and Hymowitz, Reference Singh and Hymowitz1989; Carter et al., Reference Carter, Hymowitz, Nelson and Werner2004a, Reference Carter, Nelson, Sneller, Cui, Boerma and Spechtb; Kuroda et al., Reference Kuroda, Kaga, Tomooka, Yano, Takada, Kato and Vaughan2013).
Many studies have reported metrics of genetic diversity, structure and quantitative trends among complex traits in soybean and its wild progenitor; however, these have limited genetic resources and marker data that were available (Brown-Guedira et al., Reference Brown-Guedira, Thomson, Nelson and Warburton2000; Guo et al., Reference Guo, Wang, Song, Zhou, Qiu, Huang and Wang2010). Previous studies have been performed upon soybean germplasm attempting to provide a better understanding of the soybean genome footprints (Song et al., Reference Song, Hyten, Jia, Quigley, Fickus, Nelson and Cregan2015; Zhou et al., Reference Zhou, Jiang, Wang, Gou, Lyu, Li, Yu, Shu, Zhao, Ma and Fang2015). Among these footprints, some investigations focused on the bottlenecks associated with domestications (Hyten et al., Reference Hyten, Song, Zhu, Choi, Nelson, Costa, Specht, Shoemaker and Cregan2006; Zhao et al., Reference Zhao, Zheng, He, Wu, Pan and Lam2015), and others on the diversity and possible applications for breeding (Bandillo et al., Reference Bandillo, Jarquin, Song, Nelson, Cregan, Specht and Lorenz2015; Jarquin et al., Reference Jarquin, Specht and Lorenz2016). Yet, there exists a gap the regards the simultaneous analysis of quantitative and population genomic parameters. The United States Department of Agriculture (USDA) Soybean germplasm collection was officially established in 1949 and served as an important resource for soybean researchers worldwide (Carter et al., Reference Carter, Nelson, Sneller, Cui, Boerma and Specht2004b). According to a report from Carter et al. (Reference Carter, Nelson, Sneller, Cui, Boerma and Specht2004b), the USDA soybean germplasm collection consisted of five sub-collections, including G. max, G. soja, perennial Glycine species, genetic stocks and domestic cultivars.
The genetic variation confined within the USDA germplasm collection relates to important traits for soybean improvement (Bandillo et al., Reference Bandillo, Jarquin, Song, Nelson, Cregan, Specht and Lorenz2015). Genome-wide associations on seed protein and oil conducted in approximately 12,000 soybean accessions were able to identify genomic regions with strong signals in chromosomes 15 and 20 (Bandillo et al., Reference Bandillo, Jarquin, Song, Nelson, Cregan, Specht and Lorenz2015) and population structure analysis on approximately 14,000 accessions reported the existence of subpopulations within the collection (Bandillo et al., Reference Bandillo, Jarquin, Song, Nelson, Cregan, Specht and Lorenz2015).
This study combines the entire USDA soybean germplasm collection with high-density marker data and passport data to greatly increase our understanding of the population and quantitative genomic properties of the domesticated germplasm and its wild relatives. To create a profile of the collection, we identified and characterized subpopulations, and estimated the heritability and genetic correlation among major agronomic traits at the whole-germplasm level. We report phylogenomic analyses for the entire USDA germplasm collection, comprising 19,652 accessions of G. max and G. soja genotyped with 42,509 SNP markers. Hierarchical cluster analysis showed that the USDA collection is divided into eight well-defined clusters inferred in a non-subjective manner. Our results will assist soybean breeders with a selection of accessions to use for genetic improvement.
Methods
Germplasm collections
We studied the 19,652 accessions from the USDA Soybean Germplasm Collection. Previous efforts to describe this germplasm are provided by Bandillo et al. (Reference Bandillo, Jarquin, Song, Nelson, Cregan, Specht and Lorenz2015) and Jarquin et al. (Reference Jarquin, Specht and Lorenz2016). Detailed information on any of the accessions is available through the USDA Germplasm Resources Information Network (GRIN) database (www.ars-grin.gov).
The USDA germplasm collection consists of various countries around the world, especially from East Asia (Song et al., Reference Song, Hyten, Jia, Quigley, Fickus, Nelson and Cregan2015). Some of the accessions in the USDA collection have resistance against various diseases and pests (Song et al., Reference Song, Hyten, Jia, Quigley, Fickus, Nelson and Cregan2015; Chang et al., Reference Chang, Lipka, Domier and Hartman2016) and also have unique genes for composition modification and yield (Zhang et al., Reference Zhang, Song, Cregan and Jiang2016). In spite of the overall benefits from genetic diversity, more research is needed to identify sources of useful alleles for crop improvement (Chan et al., Reference Chan, Qi, Li, Wong and Lam2012).
Genotypic data
Song et al. (Reference Song, Hyten, Jia, Quigley, Fickus, Nelson and Cregan2013) generated the genotypic data used for these analyses by genotyping each accession in the USDA Soybean Germplasm Collection with 42,509 SNPs arrayed on a SOYSNP50 K iSelect BeadChip. We accessed the data for all accessions in the G. soja and G. max collections from the SoyBase website (Grant et al., Reference Grant, Nelson, Cannon and Shoemaker2009) on 5 December 2014. We coded allelic genotype {AA, Aa, aa} for the imputation procedure as {0, 1, 2} (Stranden and Christensen, Reference Stranden and Christensen2011), where AA is homozygous towards the reference genome Williams82. Then we imputed missing loci using random forest regression (Stekhoven and Buhlmann, Reference Stekhoven and Buhlmann2012), one chromosome at a time.
Distance matrix and phylogenetic tree
There are many metrics for dissimilarity among genotypes (Reif et al., Reference Reif, Melchinger and Frisch2005); we assessed several combinations of linkage and dissimilarity (James et al., Reference James, Witten, Hastie and Tibshirani2013) unsupervised machine-learning strategy (Xavier et al., Reference Xavier, Muir, Craig and Rainey2016) to obtain the clearest distinction of clades. The bi-plot projection of genetic dissimilarity the germplasm was based on multidimensional scaling (Cox and Cox, Reference Cox and Cox2000), as implemented in the R function cmdscale.
The dissimilarities assessed included Nei's genetic distance, Edwards’ genetic distance, Euclidean distance, Manhattan distance, and Canberra distance, the genetic distances (Nei's and Edwards’) were utilized as implemented in the R package adagenet (Jombart and Ahmed, Reference Jombart and Ahmed2011) and the other methods (Euclidean, Manhattan and Canberra) are built-in from the R function dist.
The linkage methods evaluated for each dissimilarity to build phylogenetic trees were: Neighbour joining, weighted and unweighted pair group method with arithmetic mean (UPGMA and WPGMA), Ward D 1 and War D 2. Neighbour joining was used as implemented in the R package APE (Paradis et al., Reference Paradis, Claude and Strimmer2004), the other methods are available in the built-in R function clust.
The phylogenetic tree from each combination of linkage and dissimilarity is available in the Supplementary material (File S1). Due to the best distinction among clades, we proceeded with the analyses using Nei's standard genetic distance (Nei, Reference Nei1972) as the measure of dissimilarity, and Ward's D 1 as the linkage or clustering method (Murtagh and Legendre, Reference Murtagh and Legendre2014). Nei's distance between two genotypes is estimated from molecular genotypes as
 $$d_{(i,j)} = \displaystyle{{ - \ln \left( {{\bi x}_i^{\rm {\prime}} {\bi x}_j} \right)} \over {\sqrt {{\bi x}_i^{\rm {\prime}} {\bi x}_j}}}, $$
where x represents a vector comprising the genotypic information and alleles {AA, Aa, aa} are coded as {[2, 0] [1, 1] [0, 2]}. To compute the genetic distance among populations, we used the Nei's standard genetic distance.
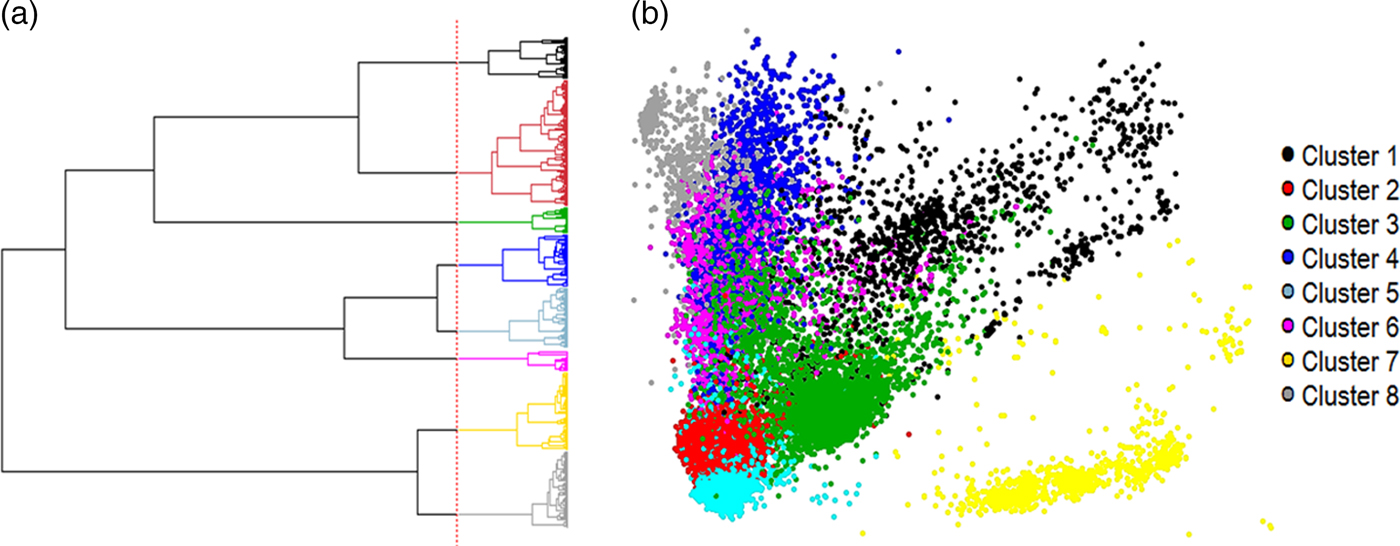
Agglomeration through Ward's D endeavours to cluster genotypes by maximizing between-group variance (Murtagh and Legendre, Reference Murtagh and Legendre2014). Thus, once it increases the changes of grouping genotypes with markers fixed for the same allele, it has interesting grouping properties from the genetic perspective; consequently, it favours a more accurate identification of subpopulations (Wright, Reference Wright1965). Ward's D 1 may display changes in topology when employed over Euclidean distances (Reif et al., Reference Reif, Melchinger and Frisch2005). The clustering was performed by cutting the phylogenetic tree at a height of 100, where clades presented clear distinction (Fig. 1a).
Clustering of USDA soybean germplasm collection based on Nei's standard genetic distance clustered with Ward's D 1. (a) Cladogram and (b) Multidimensional Scale.

Passport information
The passport information describing accession origins was provided by Dr Randall Nelson, research geneticist at USDA-ARS, and is available in the Supplementary material (File S2). Traits used for this analysis were domestication status (MAX), indicating whether an accession is G. max (MAX = 1) or G. soja (MAX = 0); weight of 100 seeds (SW), maturity group (MG), grain yield in grams per plant (YLD), plant height in centimetres (HT), lodging score 1–5 (LDG), percentage of seed oil content (OIL) and percentage of seed protein content (PRO).
Quantitative analysis of complex traits
We obtained heritability and genetic correlations from the covariance components estimated using the multivariate mixed linear model implemented in GISBBS3F90 (Misztal et al., Reference Misztal, Tsuruta, Strabel, Auvray, Druet and Lee2002). The multivariate model fits all traits at once, while the linear model for each trait can be described as
 $${\bi y}_k = 1{\bf \mu} _k + {\bf Z}_k {\bf u}_k + {\bf e}_k. $$
where for the kth trait, yk is the vector of phenotypes, μk is the intercept, Zkuk corresponds to the genetic term treated as a random effect, provided that Zk is the incidence matrix of genotypes, uk represents the regression coefficients known as breeding values, and ek is the vector of residuals. The variance of the multivariate model is described as
 $${\rm Var}\left( {\bf Y} \right) = \left( {{\bf A} \otimes {\bf \Sigma} _a + {\bf I} \otimes {\bf \Sigma} _e} \right).$$
where A is the genomic relationship matrix estimated from the molecular markers, Σa is the genetic covariance component matrix that comprises genetic variances  $\big( {\sigma _{a_i} ^2} \big)$ in the main diagonal and genetic covariances in the off-diagonal
 $(\sigma _{a_{ij}} )$, I is an identity matrix, and Σe is the residual covariance matrix with residual variances (
 $\sigma _{e_i} ^2 $) in the main diagonal and residual covariances in the off-diagonal
 $(\sigma _{e_{ij}} )$. Using the elements fromΣa, we estimated the genetic correlations as
 $$\rho _{a_{ij}} = \displaystyle{{\sigma _{a_{ij}}} \over {\sigma _{a_i} \sigma _{a_j}}}. $$
Subpopulation differentiation analysis
The genomic structure of the broad germplasm panel provides insight into the demography, domestication and adaptation of soybean (Holsinger and Weir, Reference Holsinger and Weir2009). It also identifies genomic regions which may possess little variation, or alternately, can be sources of exotic alleles. We used the F ST fixation index (Wright, Reference Wright1949) to assess differentiation among clusters, with the unbiased estimator of Weir and Cockerham (Reference Weir and Cockerham1984) implemented by Xavier et al. (Reference Xavier, Xu, Muir and Rainey2015), using the smoothing kernel strategy (Flori et al., Reference Flori, Fritz, Jaffrézic, Boussaha, Gut, Heath, Foulley and Gautier2009) to discriminate between signature selection and domestication from drift.
Linkage disequilibrium (LD)
Our analysis computed LD in terms of r 2 computed from pairs of SNPs, phasing molecular markers using the Expectation–Maximization algorithm (Slatkin and Excoffier, Reference Slatkin and Excoffier1996). The computation was performed by the function LD implemented in the R package NAM (Xavier et al., Reference Xavier, Xu, Muir and Rainey2015).
The estimated effective population size was calculated using an approximation (Sved et al., Reference Sved, Cameron and Gilchrist2013; Waples et al., Reference Waples, Antao and Luikart2014) based on the mean elements from the off-diagonal LD matrix  $(\hat r^2 )$, as
 $$\hat N_e \approx \displaystyle{1 \over {3\hat r^2}}. $$
Results
Clusters
Figure 1 presents the cladogram used to generate the eight clusters and the multidimensional scaling (MDS) representation obtained by best-fitting the k-dimensional representation (Mardia, Reference Mardia1978). The cladogram produced through Ward's D 1 agglomeration yielded clear clusters, although it may not be obvious that all lines are included in Fig. 1a. The MDS is directly comparable with the principal components biplot presented by Bandillo et al. (Reference Bandillo, Jarquin, Song, Nelson, Cregan, Specht and Lorenz2015), who used only a subset of this dataset. Our clustering analysis contrast with Jarquin et al. (Reference Jarquin, Specht and Lorenz2016), where nine subpopulations were inferred from centroid agglomeration from the principal components.
A representation of clusters in terms of the countries that made major contributions to the germplasm collection, along with the population-wise genetic distance, is provided in the Supplementary material (File S1).
Quantitative trends
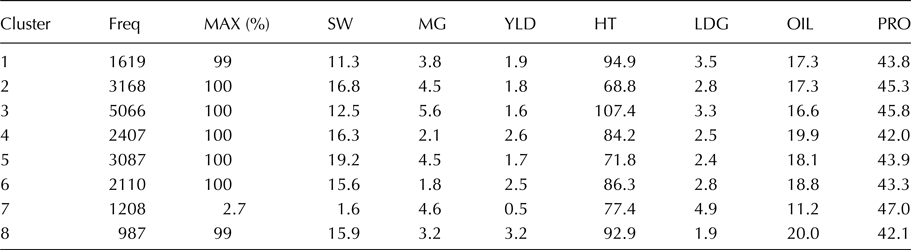
The subpopulation inferred here present distinct genetic and phenotypic characteristics. The number of individuals in each cluster, alongside the average value for each phenotype under evaluation, is summarized in Table 1. This information provides an insight into the genetic resources available in the collection for breeding applications, also highlighting phenotypic discrepancies among clusters.
Summary of cluster features

Number of individuals (Freq), Percentage of domesticated soybeans (MAX), Weight of 100 seeds (SW), Maturity group (MG), Grain yield in grams per plant (YLD), Plant height in centimetres (HT), Lodging score 1–5 (LDG), Percentage of seed oil content (OIL), Percentage of seed protein content (PRO).
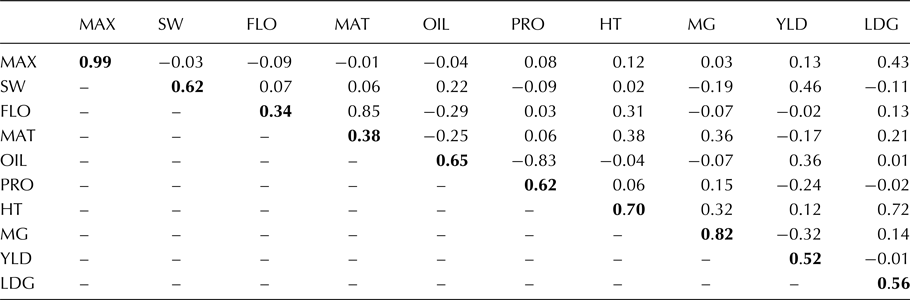
Most valuable traits, such as yield and seed composition, are complex due to their quantitative nature, meaning that they are controlled by many genes that each have small effects and that they are responsive to environmental stimuli. Table 2 shows the genetic associations among the agronomic traits. Quantitative genetic parameters contribute to the strategic use of novel germplasm in breeding programmes; for instance, programmes looking to increased seed weight could consider exploiting cluster 5.
Genetic correlations (off-diagonal) and heritability (main diagonal, bold) inferred from the USDA soybean germplasm collection.

Percentage of domesticated soybeans (MAX), Weight of 100 seeds (SW), Flowering date (FLO), Maturity date (MAT), Percentage of seed oil content (OIL), Percentage of seed protein content (PRO), Plant height in centimetres (HT), Maturity group (MG), Grain yield in grams per plant (YLD), Lodging score 1–5 (LDG).
Genetic parameters obtained from covariance components are measurements of the joint response of multiple traits to selection and drift, which are reflected on the heritabilities and genetic correlations (Xavier et al., Reference Xavier, Hall, Casteel, Muir and Rainey2017). The very nature of this interaction can be associated to the phenotypic plasticity associated with fitness, physiological constraints of each phenotype, and the pleiotropy due to shared pathways the affect multiple traits simultaneously (DeJong and VanNoordwijk, Reference DeJong and VanNoordwijk:1992; Zera and Harshman, Reference Zera and Harshman:2001). Despite the possibility of subpopulation to present slightly different quantitative genetic properties, Table 2 presents values estimated from the germplasm collection as a whole.
Eight genetic groups
Cluster analysis supports the existence of eight germplasm groups (Fig. 1). These clusters are likely to share specific phenotypic properties that characterize their breeding application or adaptation zone (Yamamichi and Innan, Reference Yamamichi and Innan2012). Some of the specific properties observed in each cluster are described below.
• Cluster 1: Displays the lowest seed weight and highest values of lodging among clusters of domesticated soybeans.
• Cluster 2: Mostly composed of Korean germplasm, presenting the lowest average plant height.
• Cluster 3: The largest group in the germplasm collection, it comprises the tropical and semi-tropical material. Highest average maturity group and plant height, also the lowest oil content among clusters of domesticated soybeans.
• Cluster 4: Mostly composed of germplasm from China and Russia. This cluster displays the lowest average seed protein content.
• Cluster 5: Displays the highest seed weight, which can be possibly associated with the food-grade soybean.
• Cluster 6: Includes Russian, North American and European material, with an average maturity group close to II.
• Cluster 7: Cluster of undomesticated germplasm, presenting the highest lodging scores and smallest seed weight.
• Cluster 8: Comprises US germplasm. It represents the highest yielding material and highest average for seed oil content, although the yield assessment was performed in US territory.
As we were able to find eight major clusters with shared features, it is also possible that each cluster holds subclusters. Previously, Shi et al. (Reference Shi, Chen, Zhang and Hou2010), clustered the food-grade soybeans (corresponding to our cluster 5) and concluded that this subpopulation could be further stratified into clusters with distinct types of food-grade soybeans. Another example involves the undomesticated material, the representation of germplasm by country presented in the Supplementary material (File S1) indicates little overlap of wild relatives (cluster 7) across countries, which supports the existence of subpopulations (Wen et al., Reference Wen, Ding, Zhao and Gai2009; Li et al., Reference Li, Li, Zhang, Yang, Chang, Gaut and Qiu2010, Reference Li, Zhao, Ma, Li, Yan, Li, Qi, Guo, Zhang, He and Chang2013).
Signatures of genomic differentiation
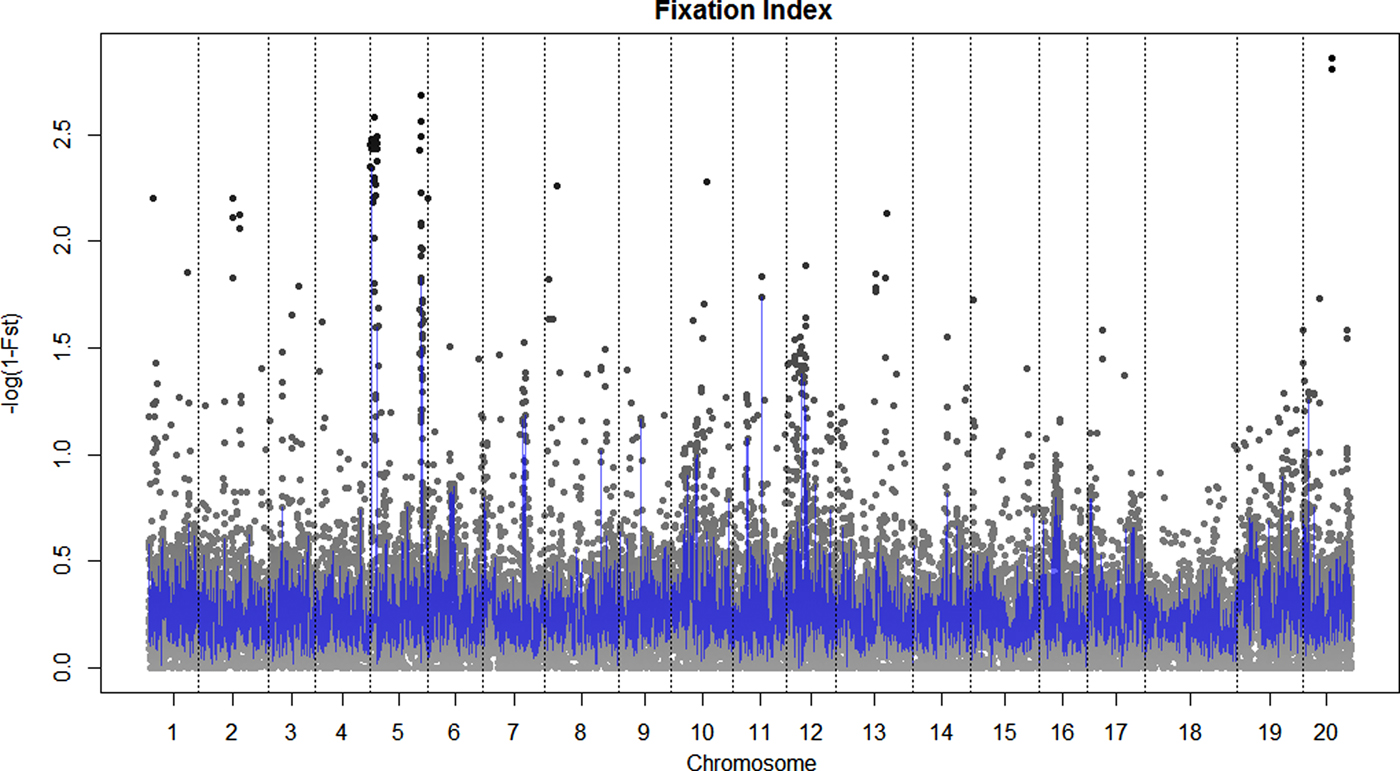
The average F ST among the eight clusters was 0.22 and the 95% quantile was 0.43, which is in agreement with results from Zhao et al. (Reference Zhao, Zheng, He, Wu, Pan and Lam2015). Figure 2 shows the F ST index with values presented in terms of –log(1−F ST). It is not obvious when the fixation index should be considered to be associated with a selection event and, therefore, F ST values are often compared within the SNP panel (Akey et al., Reference Akey, Zhang, Zhang, Jin and Shriver2002). In this study, we express the fixation index in terms of −log(1 − F ST) to provide a clearer representation of the genomic regions affected by selection-driven fixation, such that F ST = 0.9 (i.e. 99% quantile) would represent 1 in this scale.
Fixation index of the USDA soybean germplasm collection among eight clusters.

Several peaks across the genome indicate alleles close to within-cluster fixation (Wahlund effect), which are associated with the selection, genetic drift or population bottlenecks. The smoothing kernel (in blue) defines regions that characterize a selection event (Flori et al., Reference Flori, Fritz, Jaffrézic, Boussaha, Gut, Heath, Foulley and Gautier2009), thus distinguishing these peak from genetic drift. The results are presented by chromosome and with more detail in the Supplementary material (File S1). There are few genomic regions where the smoothed kernel values were above the 99% quantile, and these were likely associated with the causative differentiation of clusters. These regions occurred on chromosomes 5, 7, 8, 9, 11 and 12 (Fig. 2).
Smoothed F ST values higher than 1.45 (99.75% quantile, F ST 0.77) appeared in three regions of chromosome 5, and one region of chromosome 11. The corresponding SNP markers were Glyma05g10882839 (uncharacterized LOC100807579), Glyma05g4381619 (no matching BLAST), Glyma05g4852641 (no matching BLAST) and Glyma11g35294621 (Glyma11g33480.1, NADH dehydrogenase).
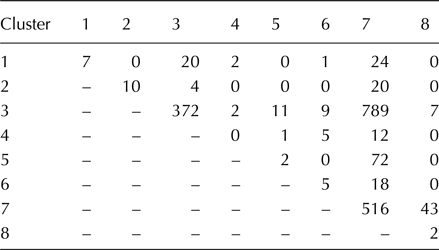
The peaks presented in Fig. 2 are likely associated with alleles that are exclusive to a given cluster or pair of clusters. Table 3 provides a summary of the exclusive alleles found for individual clusters. A total of 914 SNPs were exclusive to specific clusters. Most rare alleles occurred in clusters 3 and 7, whereas cluster 4 did not show any exclusive alleles.
Number of exclusive alleles and alleles shared between pairs of clusters

Linkage disequilibrium decay
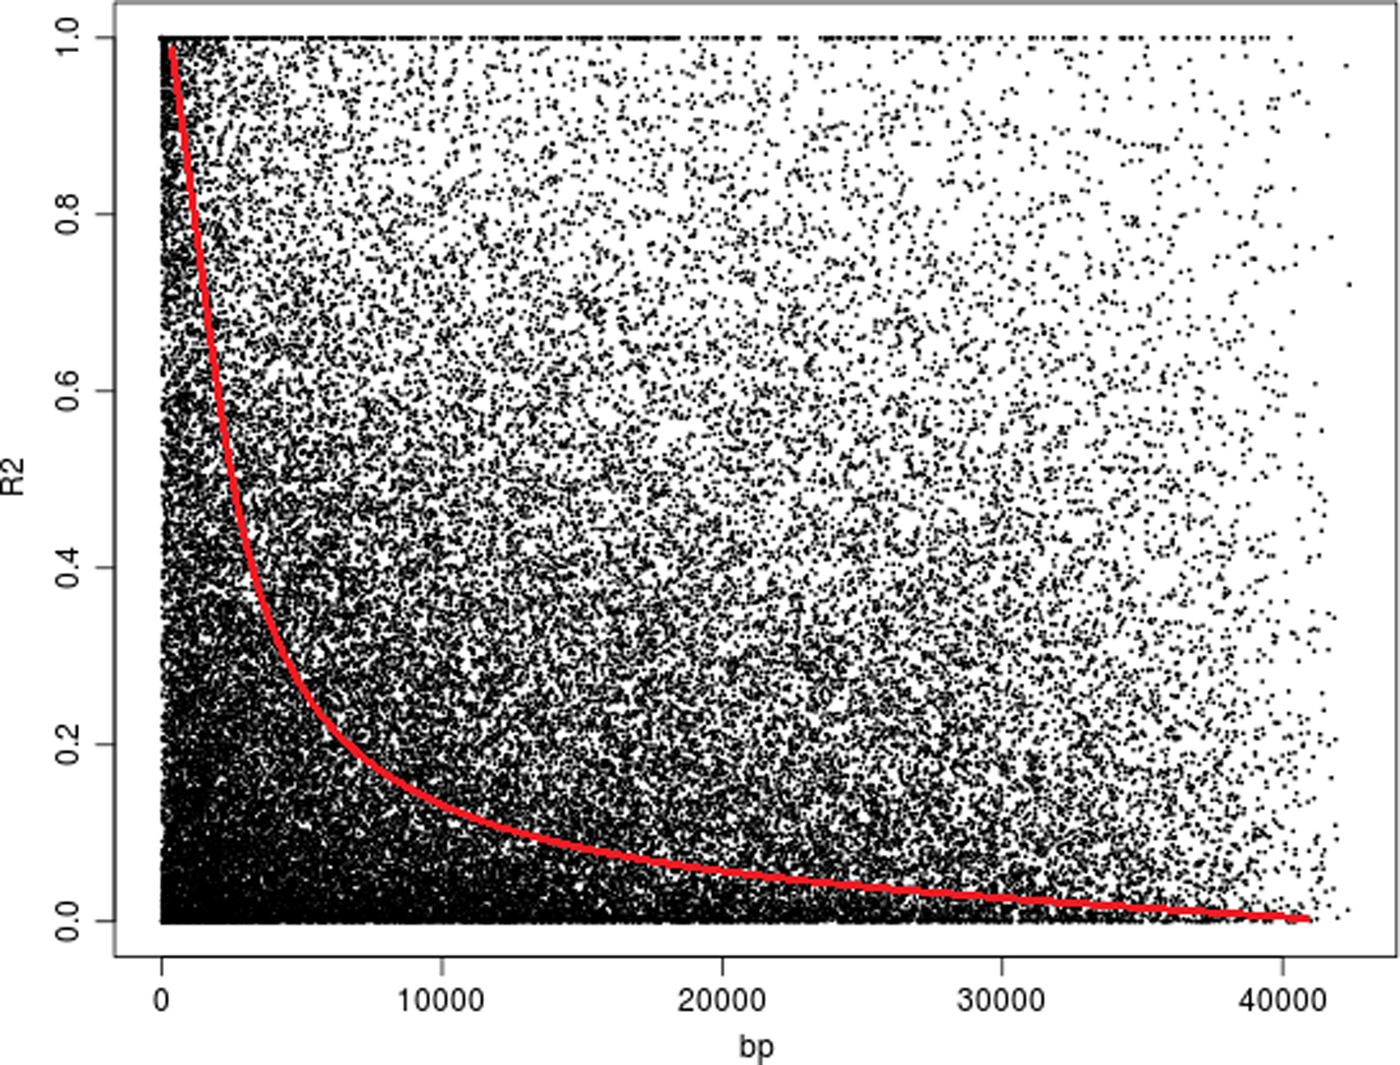
Figure 3 presents the LD decay. From the LD, we inferred the overall effective population to be 106.18 individuals, with 95% confidence intervals of {16.84, 195.52}. The effective population size was validated using an empirical approach based on F ST and made available on the Supplementary material (File S1, page 4).
Linkage Disequilibrium decay in the USDA soybean germplasm collection.

In spite of the large confidence intervals, which are likely associated with genome-duplication (Shoemaker et al., Reference Shoemaker, Schlueter and Doyle2006), and the ascertainment bias associated with the SNP array (Lachance and Tishkoff, Reference Lachance and Tishkoff2013), this result indicates that an idealized population of approximately 106 unrelated individuals would be enough to comprise all soybean diversity in the collection.
Discussion
Soybean has undergone many genetic bottlenecks that have narrowed its genetic basis reducing the genetic diversity (Hyten et al., Reference Hyten, Song, Zhu, Choi, Nelson, Costa, Specht, Shoemaker and Cregan2006; Tavaud-Pirra et al., Reference Tavaud-Pirra, Sartre, Nelson, Santon, Texier and Roumet2009; Guo et al., Reference Guo, Wang, Song, Zhou, Qiu, Huang and Wang2010). The study conducted by Hyten et al. (Reference Hyten, Song, Zhu, Choi, Nelson, Costa, Specht, Shoemaker and Cregan2006) involved sequencing of 102 genes from four different populations of soybean before and after the genetic bottlenecks. The study concluded how human-mediated events have weathered the genetic diversity in soybean (Hyten et al., Reference Hyten, Song, Zhu, Choi, Nelson, Costa, Specht, Shoemaker and Cregan2006). Similarly, recent advancement in high-throughput sequencing and availability of complete genomic sequence of soybean helped better understand an evolutionary event such as domestication and phenotypic diversification (Hyten et al., Reference Hyten, Song, Zhu, Choi, Nelson, Costa, Specht, Shoemaker and Cregan2006; Schmutz et al., Reference Schmutz, Cannon, Schlueter, Ma, Mitros, Nelson, Hyten, Song, Thelen, Cheng and Xu2010; Zhao et al., Reference Zhao, Zheng, He, Wu, Pan and Lam2015). Nucleotide fixation driven by selection has reduced the genetic diversity in cultivated soybean when compared with wild progenitors (Zhao et al., Reference Zhao, Zheng, He, Wu, Pan and Lam2015), and loss of diversity is mostly associated with domestication rather than genetic improvement (Zhao et al., Reference Zhao, Zheng, He, Wu, Pan and Lam2015).
New insights on haplotype diversity in wild and cultivated soybean provided evidence of evolutionary events affecting the population dynamics and helping soybean researchers in their pursuit of crop improvement (Zhao et al., Reference Zhao, Zheng, He, Wu, Pan and Lam2015). Due to limited diversity in soybean, breeders and researchers have been introgressing rare alleles from undomesticated material to expand the genetic base, thus preferred over other sources of genetic variabilities, such as mutation breeding (Ha et al., Reference Ha, Lee, Velusamy, Kim, Kim, Ahn, Kang and Kim2014) and transformation (Yamada et al., Reference Yamada, Takagi and Ishimoto2012). Introgression of exotic alleles was not limited to G. soja, also encompassing perennial Glycine species (Sherman-Broyles et al., Reference Sherman-Broyles, Bombarely, Powell, Doyle, Egan, Coate and Doyle2014), such as G. tomentella that has been recently exploited and found to be a valuable resource (Singh and Nelson, Reference Singh and Nelson2015).
Genetic variability
An effective population size of approximately 106 accessions reinforces the concept of a narrow genetic base for soybean reported in previous studies performed on a smaller scale (Zhu et al., Reference Zhu, Song, Hyten, Van Tassell, Matukumalli and Grimm2003; Li et al., Reference Li, Zhao, Ma, Li, Yan, Li, Qi, Guo, Zhang, He and Chang2013; Min et al., Reference Min, Run-zhi, Wan-ming and Wei-jun2013). From the breeding perspective, this restricted genetic variability imposes constraints on long-term genetic gains (Henryon et al., Reference Henryon, Berg and Sørensen2014).
Song et al. (Reference Song, Hyten, Jia, Quigley, Fickus, Nelson and Cregan2015) reported that the USDA soybean germplasm collection has redundant accessions, with approximately 30% of domesticated and 23% of undomesticad lines being nearly identical to other entries. Such similarity can be attributed to highly related lines (i.e. as near-isogenic lines), mutation-driven populations that differ in point-specific SNPs, or mislabelling resulting in duplicate accessions.
Three major bottlenecks may have restricted genetic diversity outside the centre of origin (Hyten et al., Reference Hyten, Song, Zhu, Choi, Nelson, Costa, Specht, Shoemaker and Cregan2006), comprising initial domestication, the introduction of few landraces into novel territories and local selective breeding. The high number of alleles exclusive between clusters 3 and 7 (Table 3) suggests that tropical and temperate domestication of soybeans may have occurred separately. Yet, much of the existing genetic diversity of soybeans still resides in germplasm that preceded the bottlenecks (He et al., Reference He, Wang, Volis, Li and Yi2012; Zhao et al., Reference Zhao, Zheng, He, Wu, Pan and Lam2015), including landraces and undomesticated material.
Surprisingly, the genetic correlation between grain yield and domestication is weak (Table 2), indicating that exotic alleles from wild relatives mostly do not affect seed production. QTL have been successfully introgressed from G. soja to G. max (Concibido et al., Reference Concibido, La Vallee, Mclaird, Pineda, Meyer, Hummel, Yang, Wu and Delannay2003; Wang, et al., Reference Wang, Graef, Procopiuk and Diers2004; Wang et al., Reference Wang, Li, Zhang, Chen, Zhang and Yu2010), although backcrosses are needed for a fully agronomically desirable phenotype (Ertl and Fehr, Reference Ertl and Fehr1985).
Differentiation
Many genomic regions are associated with the underlying genetic basis of differentiation between the eight major clusters (Fig. 2, Suppl. File S1 page 5), and many alleles occur exclusively in specific clusters or pairs of clusters (Table 3).
The domestication of soybean occurred distinctly multiple times, and such events have been detected in both nucleic and cytoplasmic DNA (Xu et al., Reference Xu, Abe, Gai and Shimamoto2002; Schmutz et al., Reference Schmutz, Cannon, Schlueter, Ma, Mitros, Nelson, Hyten, Song, Thelen, Cheng and Xu2010). Some function regions underwent fixation because soybeans were selected for specific purposes (Hou et al., Reference Hou, Chen, Alloatti, Li, Mozzoni, Zhang and Shi2009; Shi et al., Reference Shi, Chen, Zhang and Hou2010), while non-functional paralogue regions originated from genome duplications (Schmutz et al., Reference Schmutz, Cannon, Schlueter, Ma, Mitros, Nelson, Hyten, Song, Thelen, Cheng and Xu2010) were often fixed due to random genetic drift at separate points in time (Recker et al., Reference Recker, Burton, Cardinal and Miranda2013; Zhao et al., Reference Zhao, Zheng, He, Wu, Pan and Lam2015). This distinction of selection and drift is particularly informative with regard to the time of differentiation and genetic structure.
Association studies based fixation index aiming to reveal the genetic nature of soybean domestication (Narvel et al., Reference Narvel, Fehr, Chu, Grant and Shoemaker2000) can identify which genes, their function and location, characterize wild relatives, landrace strains and elite material (Hyten et al., Reference Hyten, Song, Zhu, Choi, Nelson, Costa, Specht, Shoemaker and Cregan2006; Wang et al., Reference Wang, Lu, Chen, Shu, Palmer, Xing, Li, Yang, Yu, Zhao and Gai2014; Song et al., Reference Song, Hyten, Jia, Quigley, Fickus, Nelson and Cregan2015). Alleles associated with domestication may have been lost in bottlenecks at random or may be linked to agronomic traits of importance (Zhao et al., Reference Zhao, Zheng, He, Wu, Pan and Lam2015). The development of experimental populations would be necessary to truly distinguish drift from domestication QTL (Recker et al., Reference Recker, Burton, Cardinal and Miranda2013).
An interesting association between grain yield and seed weight (0.46) is presented in Table 2, where seed weight also appears to be more heritable than grain yield (0.62 > 0.52). This result indicates that seed weight is a good candidate trait to be taken into account when incorporating novel sources of germplasm into breeding programmes. However, this trend has not been observed in experimental populations from elite germplasm (Xavier et al., Reference Xavier, Hall, Casteel, Muir and Rainey2017).
Quantitative control of traits
As expected, the estimates of heritability at the whole-germplasm level (Table 2) were high, reflecting a predominantly additive genetic control of the quantitative traits under evaluation. This phenomenon occurs due to the large genetic variance in comparison with the noise from phenotypic data, boosting the signal-to-noise ratio (Muir, Reference Muir2007). In addition, the magnitude of the genomic associations among traits, here represented by genetic correlations, also depends on the genetic signalling of individual traits, as represented by the heritability.
Estimates of covariance components affect the downstream estimation of breeding values (Searle, Reference Searle1961) and, subsequently, the efficacy of multi-trait selection indices (Hazel, Reference Hazel1943). The parameters presented in Table 2 provide insight into the general trend of correlated response to selection in soybeans. Although the abundance of genetic variation could inflate the coefficients, our estimates of heritability and genetic correlation from the germplasm collection agree with previous reports from elite panels, random mating populations and experimental populations (Johnson et al., Reference Johnson, Robinson and Comstock1955; Kwon and Torrie, Reference Kwon and Torrie1964; Ecochard and Ravelomanantsoa, Reference Ecochard and Ravelomanantsoa1982; Arshad et al., Reference Arshad, Ali and Ghafoor2006; Recker et al., Reference Recker, Burton, Cardinal and Miranda2014).
Consideration of maturity
Some traits show fairly stable genetic control. For instance, the strong negative genetic correlation between protein and oil (−0.83) was similar to previous studies, which reported −0.75 (Recker et al., Reference Recker, Burton, Cardinal and Miranda2014) and −0.66 (Kwon and Torrie, Reference Kwon and Torrie1964). The association between traits is can also be population specific. The association between flowering date and maturity date (0.85) in the germplasm was much stronger than in the random mating population (0.44) presented by Recker et al. (Reference Recker, Burton, Cardinal and Miranda2014) or the elite panel (0.34) presented by Arshad et al. (Reference Arshad, Ali and Ghafoor2006), but was consistent with the wide-maturity bi-parental population (0.87) presented by Ecochard and Ravelomanantsoa (Reference Ecochard and Ravelomanantsoa1982). This discrepancy in the genetic correlation between flowering and maturity among the various populations is directly related to the genetic variability of each panel. Populations ranging across multiple maturity groups are more likely to display larger genetic correlations for traits that control the reproductive cycle.
The maturity groups of soybean are defined by few major genes (Molnar et al., Reference Molnar, Rai, Charette and Cober2003; Samanfar et al., Reference Samanfar, Molnar, Charette, Schoenrock, Dehne, Golshani, Belzile and Cober2017), which affects the heritability estimate (0.85). Nevertheless, we did not observe the same level of additive genetic control for maturity date (0.38). Besides the underlying genetic control of maturity that defines ‘what grows where’, the trait maturity date also relies on the planting date and environmental factors defined by the location in which the accessions were evaluated, factors such as temperature and photoperiod (Tasma et al., Reference Tasma, Lorenzen, Green and Shoemaker2001; Xu et al., Reference Xu, Xu, Liu, Kong, Tsubokura, Watanabe, Xia, Harada, Kanazawa, Yamada and Abe2013). These factors make the flowering and maturity date traits not directly comparable across a wide range of maturity groups in situations when not all the germplasm collection is evaluated at the same growing site.
Conclusions
Using the passport data and genomic information available, we were able to summarize population parameters in the USDA soybean germplasm collection, finding the existence of eight clear subpopulations. F ST tracked regions that could explain the differentiation among clusters. The high levels of LD found to indicate that the effective population size of the germplasm collection is approximately 106 individuals. We also presented and discussed the quantitative merit of major traits.
This study provides a summary of various population and quantitative parameters. Such information is particularly valuable for the pre-breeding processes that seek to expand the genetic basis of breeding germplasm. Here we also provide phenotypes and genotypes (and clusters) in the supplementary material to facilitate breeders using the germplasm information. Maturity and seed weight appeared as two key traits when selecting material from the germplasm collection.
Future research could focus on the genomic regions or the candidate genes that have been identified as associated with important traits, such as yield, plant height, seed weight and lodging. Further studies could be performed in silico using the SoyNAM public dataset (Xavier et al., Reference Xavier, Jarquin, Howard, Ramasubramanian, Specht, Graef, Beavis, Diers, Song, Cregan and Nelson2018) to contrast or complement genetic investigations on the USDA germplasm collection. We believe that new studies should also seek robust phenotypic characterization of the valuable quantitative traits due to the tremendous amount of information that phenotypic diversity could provide for researchers to improve soybean.
Supplementary material
The supplementary material for this article can be found at https://doi.org/10.1017/S1479262118000102
Acknowledgements
We are grateful to Shogo Tsuruta for providing the software GIBBS3F90, which was able to support enough entries. We also thank Randall Nelson for providing the passport data.
Declarations
Authors’ contribution
AX wrote the manuscript with contributions from RT. AX conducted the statistical analyses. WMM and KMR provided the general objectives and an important insight into the analyses. All authors read and reviewed the manuscript.