1. Introduction
The natural rate of interest, which is the real interest rate at which economic activity and prices neither accelerate nor decelerate, is crucial because it serves as an important benchmark for central banks to set short-term interest rates.Footnote 1 However, the natural rate of interest cannot be directly observed; we need to estimate it using economic theories as a guide and make use of various econometric tools based on observable economic data. As a consequence, uncertainty regarding the estimation of natural rate of interest is inevitably high. Additionally, their determinants are still ambiguous, since the economic theories which should serve as guides also entail different views.Footnote 2 Given these circumstances, elaboration of the estimation of the natural rates of interest through various approaches and research regarding their determinants is still under investigation within central banks and academia.Footnote 3
This highlights the fact that most existing models for estimating the natural rates of interest assume closed-economy models and disregard global factors to some extent.Footnote 4 The reason seems to be the limited accumulation of research regarding the relationship between global factors and the natural rate of interest. However, the amount of literature indicating that the domestic economies and financial conditions are greatly affected by spillovers from foreign economies is currently increasing (Holston et al. Reference Holston, Laubach and Williams2017, Del Negro et al. Reference Del Negro, Giannone, Giannoni and Tambalotti2019, Kiley, Reference Kiley2019, Ferreira and Shousha, Reference Ferreira and Shousha2023, and Carvalho et al. Reference Carvalho, Ferrero, Mazin and Nechio2025). In fact, when we look at the long-term development of real interest rates in developed economies in Figure 1,Footnote 5 we can see a common declining trend, suggesting the existence of global factors which affect equally the natural rates of interest in various economies. If the impact of global factors cannot be neglected, then it would be essential to take appropriate account of these factors when we try to grasp developments in the natural rate of interest, including a detailed analysis of its determinants.
Real interest rates.Note: This figure shows the long-term development of real interest rates in developed economies. Data are until the third quarter of 2023. The real interest rates are calculated by subtracting CPI (headline) year-on-year inflation from the short term interest rates. Source: HAVER; AWMD; ECB.

Figure 1. Long description
A line graph depicting the long-term development of real interest rates in developed economies from 1971 to 2023. The horizontal axis represents the years from 71 to 23, and the vertical axis represents the real interest rates in percent, ranging from -15 percent to 10 percent. The graph includes five data lines representing Japan, the US, the Euro Area, the UK, and Canada. Each line shows the trend of real interest rates over time. The red line represents Japan, the blue line represents the US, the dashed black line represents the Euro Area, the green line represents the UK, and the purple line represents Canada. The trends show fluctuations in real interest rates for each country over the specified period.
The contribution of the paper is to quantitatively examine the effect of global factors and the role of globalization on the long-term natural rate of interest. To be precise, by using the smooth-transition model (hereafter the ST model), we extend the model by Ferreira and Shousha (Reference Ferreira and Shousha2023), which incorporates global factors accounting for both global demand and supply of safe assets and global spillovers from the country- or region-specific real factors such as productivity and demographics. This approach allows us to analyze the development of the natural rate of interest while accounting for a continuous regime change in the influence of global factors driven by globalization. Specifically, our model assumes that the impact of global factors would increase nonlinearly as globalization progresses, in contrast to Carvalho et al. (Reference Carvalho, Ferrero, Mazin and Nechio2025), which assumes a linear increase. We verify that because the linkages of the trade and financial aspects from the late 1990s to the early 2000s combined significantly, the extent to which global factors affect the natural rate of interest increased, and we then decompose the natural rate of interest for each economy. This paper is the first to estimate the effect of the global factors on the natural rate of interest taking into account the regime change associated with globalization.
As a result, we found the following. First, it is revealed that as globalization progresses, the extent to which global factors affect the natural rate of interest rapidly increased around 2000. Second, according to the historical decomposition using the model in this paper, the common declining trend of the natural rate of interest can mostly be explained by global factors. Based on these findings, it is essential to take into account not only domestic real factors such as productivity and demographics but also global factors such as global demand and supply of safe assets and global spillovers from foreign real factors, considering their increasing roles, when we try to understand developments in the natural rate of interest.Footnote 6
Previous studies regarding the global factors that affect the natural rate of interest point out the importance of global demand and supply of safe assets. For example, Bernanke (Reference Bernanke2005), Williams (Reference Williams2016), Caballero et al. (Reference Caballero, Farhi and Gourinchas2015), Rachel and Smith (Reference Rachel and Smith2017), and Kiley (Reference Kiley2019) highlight the higher demand for safe assets from emerging economies since the 1990s, including discussion of the so-called global saving glut. Aligning with them, Del Negro et al. (Reference Del Negro, Giannone, Giannoni and Tambalotti2019), Gourinchas et al. (Reference Gourinchas, Rey and Sauzet2022), Carvalho et al. (Reference Carvalho, Ferrero, Mazin and Nechio2025), and Cesa-Bianchi et al. (Reference Cesa-Bianchi, Harrison and Sajedi2023) suggest the importance of taking into account the global demand and supply of safe assets on the premise of international arbitrage in the decomposition of the natural rate of interest.
In addition to these financial approaches, an increasing number of studies point out that accurately understanding trends in the natural rate of interest requires considering the impact of global spillovers from foreign real factors. For instance, Beyer and Milivojevic (Reference Beyer and Milivojevic2023) suggest that country- and region-specific real factors move between nations and regions through trade transactions and capital flows, which could enhance the convergence of the natural rate of interest. Under these circumstances, several studies emphasize the importance of considering global spillovers from foreign real factors when estimating the natural rate of interest (Fries et al. Reference Fries, Mésonnier, Mouabbi and Renne2018, Zhang et al. Reference Zhang, Martínez-García, Wynne and Grossman2021, and Ferreira and Shousha, Reference Ferreira and Shousha2023). Such real factors from abroad include potential growth rates (Wynne and Zhang, Reference Wynne and Zhang2018), productivity (Martínez-García, Reference Martínez-García2021), and demographic trends (Krueger and Ludwig, Reference Krueger and Ludwig2007, Gagnon et al. Reference Gagnon, Johannsen and López-Salido2016, and Bodnár and Nerlich, Reference Bodnár and Nerlich2022). In Carvalho et al. (Reference Carvalho, Ferrero, Mazin and Nechio2025), a strong assumption is made that foreign real short-term interest rates aggregate all the information about real factors to express the spillovers from real factors.Footnote 7 However, in reality, short-term interest rates often deviate from fundamentals, making it difficult to argue that they fully aggregate all the information about real factors. In this regard, this paper more directly captures the spillover effects from foreign real factors by using a weighted average of the real factors from other economies as explanatory variables.
In estimating these global factors, Ferreira and Shousha (Reference Ferreira and Shousha2023), which is most closely related to this paper in terms of selected variables, assumes that sensitivity to these factors remains constant over time and does not consider the possibility of regime change. In contrast, Carvalho et al. (Reference Carvalho, Ferrero, Mazin and Nechio2025) focus on how sensitivity to global factors changes with the progress of financial integration. However, while that paper assumes a priori that sensitivity changes with the degree of globalization in a linear way, this paper conducts a more detailed analysis using an ST model capable of capturing nonlinear regime changes.
The structure of this paper is as follows. In Section 2, the determinants of the natural rate of interest that have been discussed in previous studies are reviewed, with a focus on global factors. Section 3 explains the estimation model we use. Section 4 presents the estimation results. Section 5 examines the implications for future natural rates of interest. Section 6 provides a conclusion.
2. Summary of determinants of the natural rate of interest
In this section, we will explain the mechanisms through which global factors can influence the natural rate of interest and briefly summarize domestic factors, focusing on productivity and demographics, which are also considered in the model in this paper.
2.1 Global Factors
2.1.1 Global spillovers from foreign real factors
Country- and region-specific factors such as changes in productivity and demographics can have spillover effects on other economies through trade transactions and capital flows. For example, even if there are differences in productivity or the working-age population ratio, capital may move from economies with lower potential growth rates and real interest rates to those with higher rates, leading to a convergence in the natural rates of interest.Footnote 8 In this regard, Beyer and Milivojevic (Reference Beyer and Milivojevic2023) have shown that the higher the trade volume, the stronger the synchronization of the natural rates of interest will be among the 50 economies analyzed. Against this backdrop, there has been an increase in recent years in studies emphasizing the importance of considering global spillovers from foreign real factors when estimating natural rates of interest. For example, Fries et al. (Reference Fries, Mésonnier, Mouabbi and Renne2018), when estimating the natural rates of interest for France, Germany, Italy, and Spain, incorporate spillovers from foreign real factors through trade and productivity channels to account for the impact of external demand as a variable affecting domestic output gaps. Ferreira and Shousha (Reference Ferreira and Shousha2023), when estimating the natural rate of interest for the United States, show that the results taking into account global spillovers from foreign real factors, such as productivity and demographics, are on average 0.9% points lower than those from counterfactual models that do not consider these factors. The study concludes that global real factors, such as the decline in global productivity and the aging observed since the 2000s, have contributed to this downward pressure.
Potential growth rates, productivity, and demographics could be incorporated into the model as global real factors. Wynne and Zhang (Reference Wynne and Zhang2018) extend the model in Laubach and Williams (Reference Laubach and Williams2003) to a two-country model for the US and Japan, and suggest that not only the potential growth of a particular country but also the potential growth rates of other countries could affect the natural rate of interest. In particular, during the periods when Japanese potential growth was declining dramatically (1973–1975, 1991–1993, and 2008–2009), that lowered the natural rate of interest in the US at that time. On the other hand, the potential growth rate of the US, including the periods when it recovered from the global financial crisis, put upward pressure on the natural rate of interest in Japan. Martínez-García (Reference Martínez-García2021) argues for the importance of taking into account global spillovers from foreign real factors, after realizing that fluctuations in the US natural rate of interest estimated using an open-economy DSGE model can be explained by the effect of productivity shocks from abroad through trade transactions. The results of Zhang et al. (Reference Zhang, Martínez-García, Wynne and Grossman2021) suggest that productivity shocks from overseas can explain 13–60% of fluctuations in the domestic short-term natural rate of interest, giving further support for the importance of considering global spillovers from foreign real factors through trade transactions. For demographics, Krueger and Ludwig (Reference Krueger and Ludwig2007), Bodnár and Nerlich (Reference Bodnár and Nerlich2022), and Gagnon et al. (Reference Gagnon, Johannsen and López-Salido2016) point out that the downward pressure on the natural rate of interest from an aging population can be mitigated by the outflow of capital to economies with younger populations and higher potential growth rates. With these findings in mind, Carvalho et al. (Reference Carvalho, Ferrero, Mazin and Nechio2025) use a general equilibrium model and error correction model covering 19 OECD economies and argue that the natural rates of interest of more financially connected economies are more greatly affected by the demographics of other economies through international trade transactions and capital flows.
2.1.2 Global demand and supply of safe assets
In a simple model that assumes economic agents acquire direct utility from holding safe assets, the following holds in the steady state.Footnote 9
 \begin{equation} R = \left (1-\nu '\left (\theta ;\, \xi \right ) \right ) \frac {g}{\delta }. \end{equation}
Here,
 $R$
is the real interest rate at the steady state, and one can interpret this as the natural rate of interest in this paper’s context.
 $\nu '$
is the marginal utility which the agents can acquire from holding safe assets and depends on the amount of safe assets,
 $\theta$
, and the preference of the economic agents toward safe assets, represented by
 $\xi$
.
 $g$
, and
 $\delta$
are growth rate and discount factor, respectively. As this equation implies, when economic agents do not hold enough safe assets because of a lack of supply (for example, where
 $\nu '$
is apparently deviating from zero as a result of
 $\theta$
being low), the demand and supply of safe assets can affect
 $R$
.Footnote
10
Also, the preference of economic agents,
 $\xi$
, can be interpreted as a change in the preference regarding liquidity due to emerging economies being motivated to hold foreign assets and to changes in financial regulations. A rise (or decline) in these preferences would lower (raise)
 $R$
.
The demand and supply of safe assets can be a domestic-specific factor; however, previous studies suggest the importance of global demand and supply of safe assets (Gourinchas et al. Reference Gourinchas, Rey and Sauzet2022, Carvalho et al. Reference Carvalho, Ferrero, Mazin and Nechio2025, and Cesa-Bianchi et al. Reference Cesa-Bianchi, Harrison and Sajedi2023, etc). This is because the arbitrage of returns from financial assets is easier than that of real assets, and the speed is also much faster. The idea suggested in Del Negro et al. (Reference Del Negro, Giannone, Giannoni and Tambalotti2019) that the convenience yield determined from the demand and supply of safe assets can converge among economies under conditions where the relative purchasing power parity holds in the long term regarding the real foreign exchange rate.Footnote 11 Based on these previous studies, this paper uses the demand and supply of US Treasuries and the US convenience yield as the variables that capture the global demand and supply of safe assets.
As Bernanke (Reference Bernanke2005), Rachel and Smith (Reference Rachel and Smith2017), and Kiley (Reference Kiley2019) mention, since the late 1990s, after the Asian currency crisis, emerging economies in particular increased investment in US Treasuries as safe assets, so as to ensure liquidity, and as a result of this, the speed of the increase in convenience yield and the demand of safe assets accelerated. At the same time, as the price of crude oil followed a gradual rising trend, resource-rich developing economies especially saw an increase in saving, and therefore had sufficient capacity to invest in US Treasuries. In addition, since around 2000, emerging economies, mainly China, structurally increased demand for US Treasuries with the intention of holding foreign exchange reserves (Williams, Reference Williams2016 and Caballero et al. Reference Caballero, Farhi and Gourinchas2015). On the other hand, supply has been increasing way beyond demand, due for instance to large-scale fiscal stimulus. As a net, the effect of the increase in supply totally cancels out that of demand. This increase in the net supply of safe assets, interpreted based on (1), could potentially reduce the extent of the decline in
 $R$
through an increase in
 $\theta$
, assuming investors’ preferences remain constant. However, it is important to note that the strengthening of the motive to hold foreign exchange reserves mentioned above may work to push
 $R$
downward, if
 $\theta$
remains constant. On the other hand, an increase in convenience yield is thought to have a negative impact on the natural rate of interest. That is, an increase in the convenience yield indicates that investors are relatively risk-averse, corresponding to a situation where demand for treasuries is rising, bond prices are increasing, and bond yields are declining.
2.1.3 The degree of progress in globalization
Based on the explanations given in Section 2.1.2, the size of the effect of global factors on the natural rate of interest in each economy depends on the extent of the interconnectedness in goods and capital markets. Figure 2, which shows the integration in global capital markets since 1986, suggests that globalization proceeded rapidly from the late 1990s into the 2000s. The volume of world trade also increased at nearly the same time.
Global financial integration and world trade volume. Note: This figure shows the integration in global capital markets since 1986. Global financial integration is calculated taking the sum of external financial assets and external financial liabilities in percent of GDP held by Japan, the US, the euro area, the UK, and Canada, standardizing them to a value from zero to one, and taking the average. Data are until the fourth quarter of 2022 for global financial integration, and the world trade volume is until the fourth quarter of 2023. Source: HAVER; The Brookings Institution.

As for the background to the progress of globalization during this period, the relaxation of financial regulations is the prime factor. Looking at the trend of the financial regulation openness index in Figure 3, it is clear that after the strengthening of regulations due to the Asian currency crisis (1997–1998),Footnote 12 the trend of deregulation accelerated with the resolution of the crisis. For example, in Indonesia, in 1997, foreign enterprises were allowed to purchase nonbank financial intermediary stocks in the Indonesian capital market without any upper limit. In South Korea, in 1998, all regulations in the domestic capital market were abolished, and the upper limit on FDI in South Korean stocks was also completely removed that year. In Malaysia, the minimum holding period for the stock market was abolished in 1997, and there were also reductions in tax rates.
As can be seen in Figure 4, this period also saw an expansion in trade transactions, accompanied by qualitative changes such as the increase in trade agreements. From the late 1990s, there was growth in trade agreements focusing primarily on goods in Turkey, Europe, and Eastern and Southern Africa. By the early 2000s, these agreements had expanded to include services as well as goods.Footnote 13 China’s accession to the WTO in December of 2001 is often cited as a symbolic event that contributed to the further expansion of trade transactions and the progress of globalization (Chow, Reference Chow2003).
Financial openness index. Note: This figure shows the dynamics of the financial regulation openness index. The value is the average of 183 economies’ data in “The Chinn-Ito Financial Openness Index.” Data are until 2021; accessed November 2023. Source: Chinn and Ito (Reference Chinn and Ito2006).

Trade agreements. Note: This figure shows the annual and cumulative numbers of trade agreements. Data are until 2024 (specifically, 15th of January). The aggregated value of all trade agreements signed between nations and regions, including the Free Trade Agreement (FTA), Economic Partnership Agreement (EPA), Preferential Trade Agreements (PTA), and Customs Union (CU). Source: WTO.

It is therefore clear that globalization advanced rapidly in both trade transactions and financial markets from the late 1990s to the early 2000s. As a result, the influence of global factors on the natural rate of interest of various economies likely intensified. It is also worth noting that this wave of globalization not only strengthened the ties between advanced economies but also involved the participation in the global economy of emerging economies, which had previously been shielded by financial regulations. Compared with advanced economies, emerging economies often experienced greater volatility in their financial markets and had stronger motives for holding safe assets. As will be discussed later, this paper conducts estimation that takes into account the possibility of such regime changes.
2.2 Domestic factors
2.2.1 Productivity
Productivity has been on a downward trend in many countries, and this is often cited as a major cause of the decline in the natural rate of interest (Holston et al. Reference Holston, Laubach and Williams2017 and Rachel and Smith, Reference Rachel and Smith2017). The decline in productivity is thought to suppress the natural rate of interest through several channels. First, according to simple macroeconomic theory, the equilibrium interest rate is determined by productivity. When productivity declines, the marginal product of capital decreases, leading to fewer investment opportunities and a reduction in investment demand. As the opportunity cost of saving diminishes, lenders are inclined to set lower interest rates (Cesa-Bianchi et al. Reference Cesa-Bianchi, Harrison and Sajedi2023 and Mankiw, Reference Mankiw2022). Additionally, the decline in household income expectations increases precautionary saving motives, leading to a change in the savings-investment balance, which in turn pushes down the natural rate of interest (Ferreira and Shousha, Reference Ferreira and Shousha2023 and Cesa-Bianchi et al. Reference Cesa-Bianchi, Harrison and Sajedi2023).
2.2.2 Demographics
Although it is well known that demographics somehow affect the natural rate of interest, the variable used as a proxy for demographics depends on the literature, and the relationship between the two is not determined (Blanchard, Reference Blanchard2023). For example, it is pointed out in Sudo et al. (Reference Sudo, Okazaki and Takizuka2018) and Bodnár and Nerlich (Reference Bodnár and Nerlich2022) that the decrease in working-age population ratio due to aging affects marginal production of capital through an increase in the capital-labor ratio, while Bodnár and Nerlich (Reference Bodnár and Nerlich2022) mention the possibility that the decline in the working-age to population ratio means a decrease in the share of young population, who generally have a tendency to save more than the elderly population does, which in turn means that population aging possibly pushes up the natural rate of interest through the decline in the macro propensity to save.
Also, both the enhancement of longevity and longer life expectancy, which underpin the aging population, means households expect a longer life after retirement and gives them greater incentive to increase their precautionary savings. This eventually leads the natural rate of interest to decline (Carvalho et al. Reference Carvalho, Ferrero and Nechio2016 and Gagnon et al. Reference Gagnon, Johannsen and López-Salido2016). However, Goodhart and Pradhan (Reference Goodhart and Pradhan2020) point out the possibility that it can put upward pressure on the natural rate of interest because the longer life expectancy makes people think that they are able to work and get compensation for longer than before, which leads people to use their savings and increase consumption. As we have seen so far, there can be various channels through which demographics affect the natural rate of interest, and these effects have to be investigated through empirical analysis.
3. Empirical framework
3.1 Model specification
In this section, we describe the details of the estimation model. Our baseline model follows the framework of Ferreira and Shousha (Reference Ferreira and Shousha2023). Since our focus is on the long-term natural rate of interest, we concentrate on the trend component of their model, but we introduce an ST mechanism to analyze its evolution in greater depth.
First, consider the case without any regime change. The change in the natural rate of interest for country
 $j$
at quarter
 $t$
from the last quarter,
 $\Delta r^{*}_{j,t}$
, can be described as the linear sum of the change in each variable affecting the natural rate of interest and the factors specific to country
 $j$
excluding those variables,
 $\epsilon _{j,t}$
, as shown in the equation below.Footnote
14
 \begin{equation} \Delta r^{*}_{j,t} = \beta _{pt} \Delta pt_{j,t} + \beta _{ws} \Delta ws_{j,t} + \beta _{cy} \Delta cy_{t} + \beta _{sa} \Delta sa_{t} + \beta _{gs} g_{j,t-1} + \epsilon _{j,t}. \end{equation}
Here,
 $pt_{j,t}$
and
 $ws_{j,t}$
are country
 $j$
’s productivity and working-age population ratio, respectively, and they are the country-specific factors. On the other hand,
 $cy_{t}$
and
 $sa_{t}$
are global convenience yield and the net supply of safe assets, respectively, and they represent the global common factors.Footnote
15
The net supply of safe assets captures the effect on the natural rate of interest of the factors related to foreign reserves and the supply of treasuries through the international safe asset market. Convenience yield captures the effect on the natural rate of interest of the factors related to the demand and supply of treasuries which could not be fully captured by the net supply of safe assets – for example, the strength of investors looking for hedging risks – through the international arbitrage of interest rates.
 $g_{j,t-1}$
represents the spillover effect of the productivity and demographics of countries other than
 $j$
to country
 $j$
, and it is defined as the weighted average of the contribution of domestic real factors in other economies, as shown in the equation below.
 \begin{equation} g_{j,t-1} = \sum _{i \neq j} w^{j}_{i} ( \beta _{pt} \Delta pt_{i,t-1} + \beta _{ws} \Delta ws_{i,t-1} ) \end{equation}
In the equation above,
 $w^{j}_{i}$
is the trade weight of country
 $i$
from the perspective of country
 $j$
. Therefore, the natural rate of interest for country
 $j$
is assumed to be affected not only by changes in the domestic real factors of the country itself and changes in the global demand and supply of safe assets but also by changes in the real factors of other economies through trade transactions.
3.2 Smooth-transition extension
We extend the model (2) to the ST model. The ST model assumes that the regime will continuously change along with economic conditions, allowing the economic model to change continuously as the regime changes. Specifically, we assume that the effects of the global factors
 $\Delta cy_{t}$
,
 $\Delta sa_{t}$
, and
 $g_{j,t-1}$
change transitionally along with globalization.
 \begin{equation} \begin{split} \Delta r^{*}_{j,t} = \beta _{pt} \Delta pt_{j,t} + \beta _{ws} \Delta ws_{j,t} & + \beta _{cy,t} \Delta cy_{t} + \beta _{sa,t} \Delta sa_{t} + \beta _{gs,t} g_{j,t-1} + \epsilon _{j,t}. \\ \end{split} \end{equation}
For the number of regimes, we assume two regimes before and after globalization, based on the insights that Section 2 has given us. Let the coefficient of Regime 1 be
 $\beta _1$
, and the coefficient of Regime 2 be
 $\beta _2$
. Using the transition function
 $F_t=F(s_t)$
which takes the value between 0 and 1 and a function of the transition variable
 $s_t$
that captures the change in globalization, the coefficient
 $\beta _t$
of each time
 $t$
can be written as the weighted average of
 $\beta _1$
and
 $\beta _2$
as in the equation below.
 \begin{equation} \begin{split} \beta _{cy,t} & = (1 - F_t) \beta _{cy1} + F_t \beta _{cy2} \\ \beta _{sa,t} & = (1 - F_t) \beta _{sa1} + F_t \beta _{sa2} \\ \beta _{gs,t} & = (1 - F_t) \beta _{gs1} + F_t \beta _{gs2}. \\ \end{split} \end{equation}
For
 $F_t$
, which can be considered as the weight of Regime 2, this paper will use the logistic function.
 \begin{equation} F_t = \frac {1}{1 + \exp (\!-\! \gamma (s_{t} - c))} , \quad \gamma \gt 0. \end{equation}
As the transition variable
 $s_t$
, we use the lagged global financial integration index, defined as the sum of external financial assets and liabilities relative to GDP across major economies; that is,
 $s_t=\phi _{t-1}$
. This specification enables us to capture regime changes associated with the evolution of globalization. Our choice is motivated by the following two considerations. First, as discussed in Section 2.1.3, the degree of financial integration directly governs the speed of international interest rate arbitrage, which is the primary transmission channel through which global factors affect domestic natural rates of interest. Second, compared with alternative measures such as trade volume or a simple time trend, the financial integration index captures qualitative shifts in investor behavior – such as changes in preferences for safe assets following the Asian currency crisis – that may not be well reflected in trade-based measures alone. One concern is that financial integration may itself be endogenous to the natural rate of interest. However, since we use the lagged value
 $\phi _{t-1}$
and the index reflects accumulated stock positions rather than flow adjustments, we consider this concern to be limited in practice. We confirm in Section 4.3 that replacing
 $\phi _{t-1}$
with a linear time trend yields broadly similar results, supporting the robustness of our baseline choice.
Under this specification, as
 $s_t=\phi _{t-1}$
increases,
 $F_t$
will change from 0 to 1. When
 $s_t=\phi _{t-1}$
is small, then
 $F_t$
will take a value near 0, making each time-varying parameter
 $\beta _t$
take a value near
 $\beta _1$
. Hence, Regime 1 is the regime before the progress of globalization. On the other hand, as
 $s_t=\phi _{t-1}$
increases,
 $F_t$
gets closer to 1, and the value of
 $\beta _t$
will be close to
 $\beta _2$
, therefore, Regime 2 can be taken as the regime after the progress of globalization.
The evolution of
 $F_t$
, the weight on Regime 2, is governed by the parameters
 $c$
and
 $\gamma$
. To be precise,
 $c$
determines the threshold of the regime change, and if the transition variable is smaller than
 $c$
, then the weight of Regime 1 will be greater than 0.5, while if the transition variable is larger than
 $c$
, then the weight of Regime 2 will be greater than 0.5. The parameter
 $\gamma$
controls the speed of regime change. The larger the value of
 $\gamma$
, the faster the transition of the economic model will be, since the change from Regime 1 to Regime 2 when the transition variable exceeds the threshold is a drastic one.
The equations described above (3), (4), (5), and (6) are the estimation equations based on the ST model. The economies in focus are Japan, the US, the euro area, the UK, and Canada. We use pooled data for these economies and estimate simultaneously
 $\beta$
,
 $c$
, and
 $\gamma$
, using the maximum likelihood method.
 $\beta _{gs1}$
and
 $\beta _{gs2}$
are restricted to take values between 0 and 1, following Ferreira and Shousha (Reference Ferreira and Shousha2023).
3.3 Data
The estimation period is from the second quarter of 1985 to the first quarter of 2022 due to the availability of data for productivity, etc. The choice of 1985 as the starting point also helps to avoid potential regime changes associated with the Plaza Accord in 1985 and the Great Moderation around 1984, as documented by Kim and Nelson (Reference Kim and Nelson1999), Stock and Watson (Reference Stock and Watson2002), and others. Analyzing these regime shifts is beyond the scope of this paper. We use the values estimated in Ferreira and Shousha (Reference Ferreira and Shousha2023) for the natural rate of interest, by interpolating data to make them quarterly variables by a spline method. For productivity, we use year-on-year growth of GDP per working hour for each economy. Specifically, we use HP-filtered (
 $\lambda$
=2,500) trend values after interpolating data of GDP growth per working hour provided by the Long-Term Productivity Database (Bergeaud et al. Reference Bergeaud, Cette and Lecat2016). For data on demographics, we use yearly data provided by the United Nations’ “World Population Prospects 2022” and interpolate them to quarterly data by a spline method. The trade weights needed for calculating the global spillovers from foreign real factors are based on weights of effective exchange rates provided by BIS (broad-based, 2017–2019). As for the convenience yield, we use the median value of the spread computed as the difference between the effective yield on investment-grade (IG) corporate bonds and the yield on U.S. Treasuries with the same maturity (5-year pitch), obtained from HAVER, following much of the existing literature (Krishnamurthy and Vissing-Jorgensen, Reference Krishnamurthy and Vissing-Jorgensen2012, Del Negro et al. Reference Del Negro, Giannone, Giannoni and Tambalotti2017, Del Negro et al. Reference Del Negro, Giannone, Giannoni and Tambalotti2019, Ferreira and Shousha, Reference Ferreira and Shousha2023, etc.). For the missing values, we interpolate them with the spread of Moody’s AAA bond yield and the yield of 20-year maturity US Treasury. To obtain the trend, we use an HP filter with a smoothing parameter of 10,000.Footnote
16
For the net supply of safe assets, we use the ratio of the difference between the supply and demand of safe assets to world GDP. Following Ferreira and Shousha (Reference Ferreira and Shousha2023), we use only U.S. government bonds as our measure of safe assets. This choice is justified by the dominant role of the U.S. dollar in international finance; it remains the primary currency for trade invoicing and international debt issuance, and represents the largest share of global foreign exchange reserves. For the demand of safe assets, out of many possible alternatives, we narrow down the scope to the balance of foreign reserves.
4. Estimation results
4.1 Estimation results of baseline model
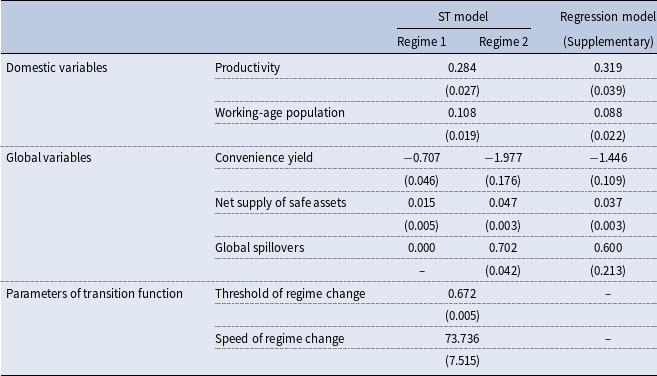
Table 1 shows the estimation results for the baseline model. First, the coefficient for productivity which captures domestic factors is positive, consistent with the discussion in Section 2. In other words, a decline or increase in productivity affects the natural rate of interest accordingly. Next, the sign of the working-age population ratio is also positive. This indicates that the progression of aging leads to a decline in the natural rate of interest.
Estimation results

Notes: This table shows the estimation results for the baseline parameters. Standard errors are in brackets. “ST model” is the result of Equation (4) and “Regression model” is the result of Equation (2). “Global spillovers” in “ST model” is restricted between 0 and 1 following Ferreira and Shousha (Reference Ferreira and Shousha2023) and the value for “Regime 1” is 0 as a result of this treatment. Therefore, the standard error for “Global spillovers” of “Regime 1” is not written.
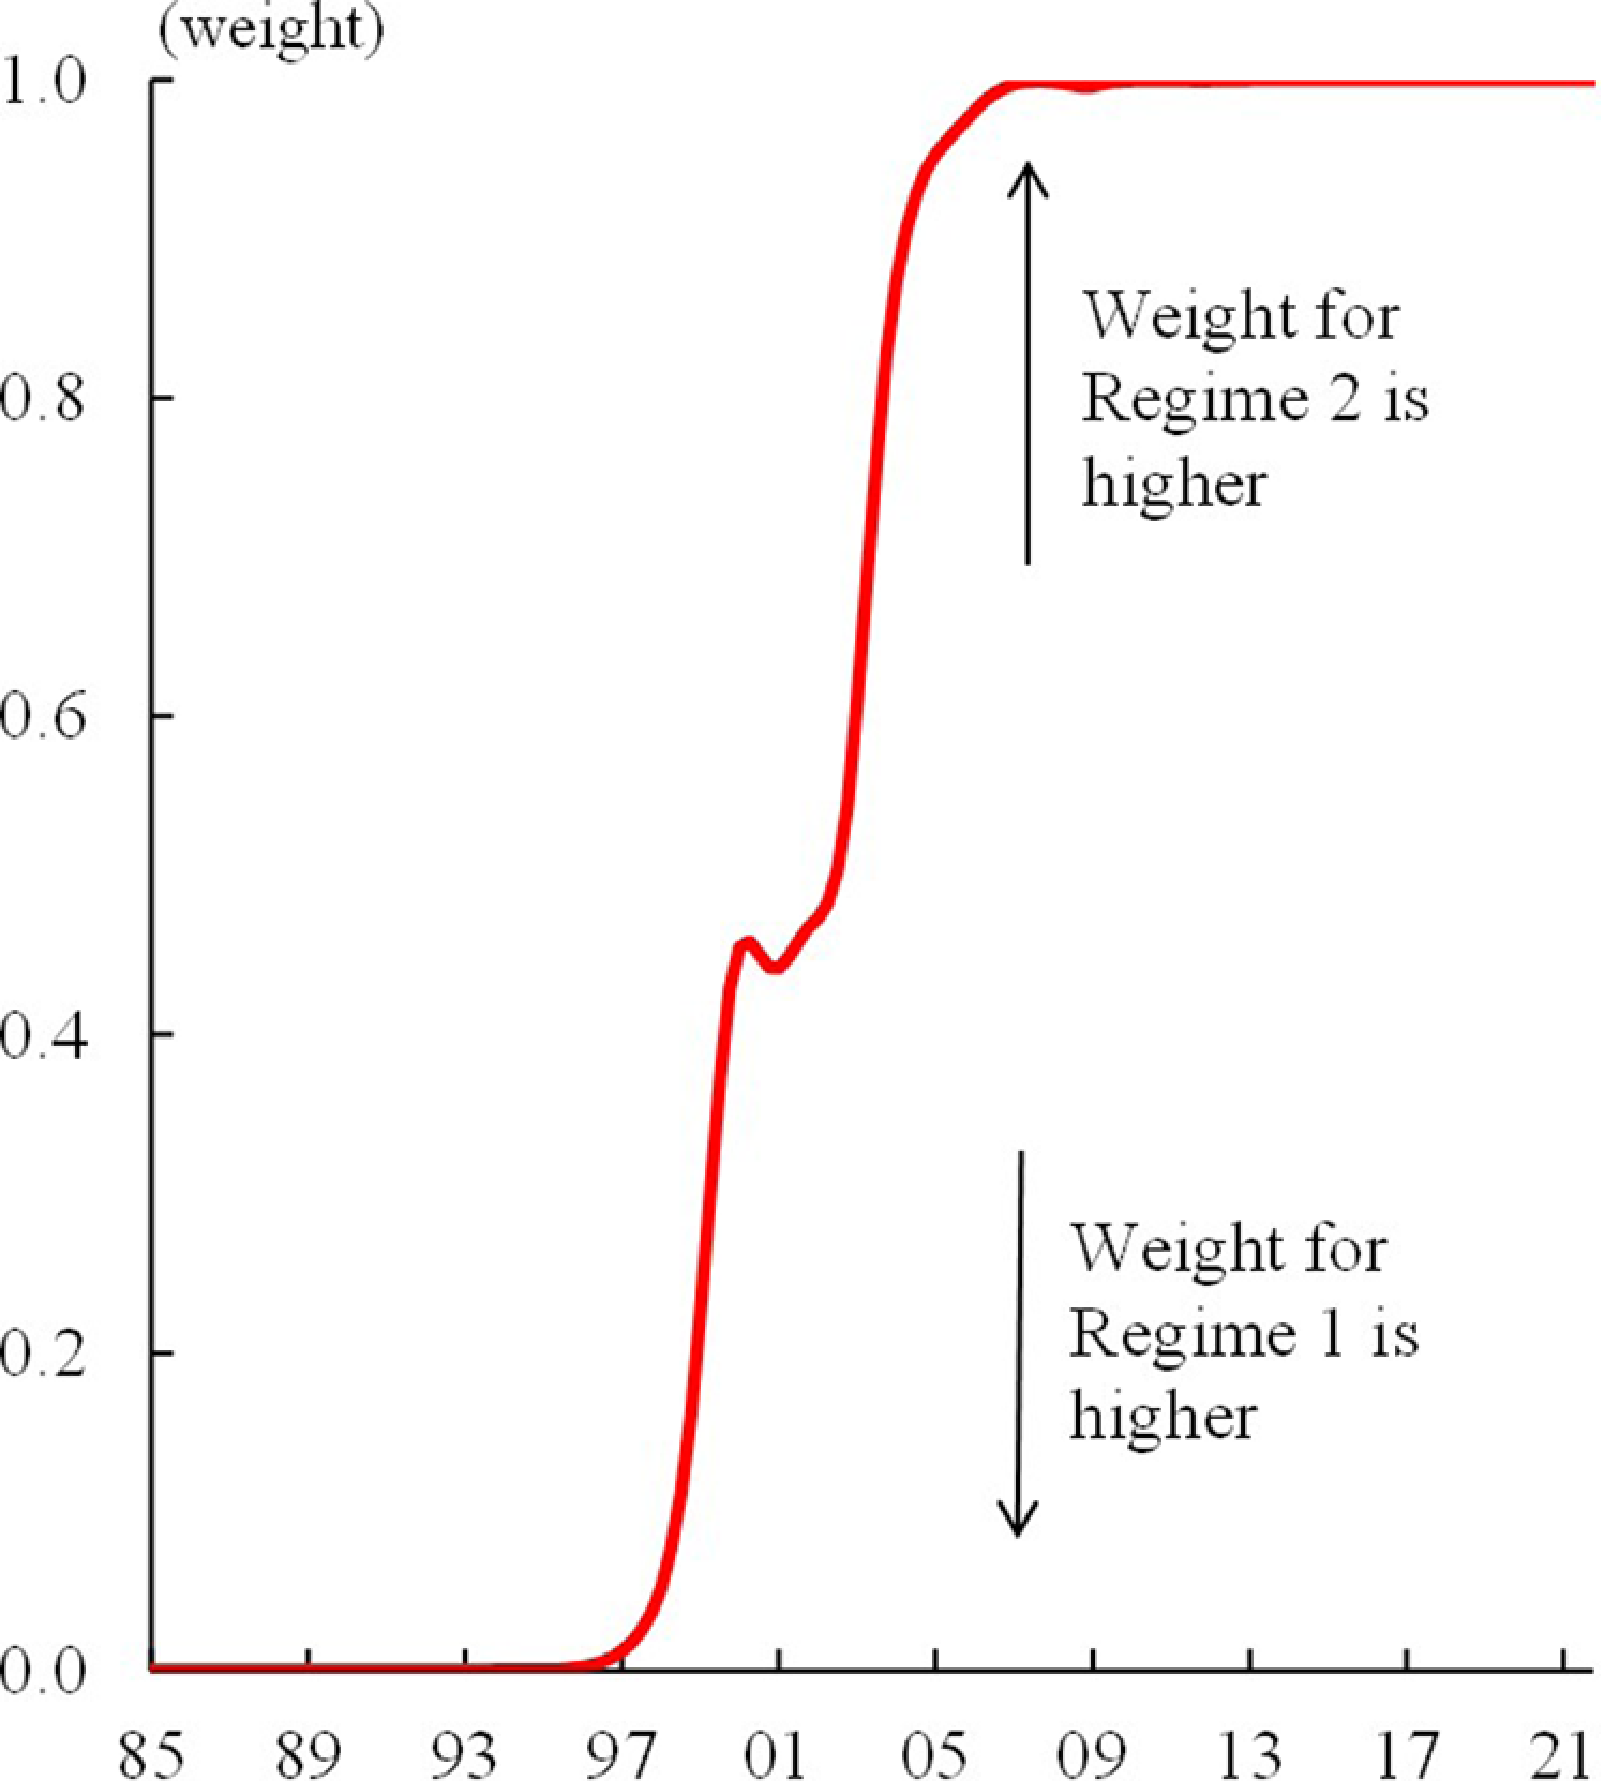
Transition function. Note: This figure shows the estimated transition function for the baseline model.

The coefficients on the global variables exhibit the expected signs. Moreover, the estimated coefficients in Regime 2 – corresponding to the period after globalization intensified – are larger in absolute value than those in Regime 1, which corresponds to the pre-globalization period, and those obtained from regression models that do not account for structural change.Footnote
17
Specifically, the coefficients for the convenience yield, which captures the strength of the impact of demand for safe assets, and for the net supply of safe assets have increased by about three times from Regime 1 to Regime 2. Similarly, while the global spillovers from foreign real factors are found to have no impact on the natural rate of interest in Regime 1, in Regime 2 the coefficient is around 0.7. Considering that a
 $\beta _{gs,t}$
of 1 would indicate full pass-through of foreign real factors, a coefficient of 0.7 is relatively large.
Now, looking at the parameters of the transition function,
 $c$
, which represents the threshold for regime change, is 0.672, and
 $\gamma$
, which represents the speed of regime change, is 73.736. This suggests that regime change occurred relatively rapidly around the time when the global financial integration index, the transition variable, was 0.672 (2001–2002). When confirming the time-series changes of the transition function based on these parameters in Figure 5, we can see that the regime was in Regime 1 until the late 1990s, shifted from Regime 1 to Regime 2 between the late 1990s and early 2000s, and has remained in Regime 2 since then. What is noteworthy is the speed of this structural change. Although the global financial integration index, the transition variable, rose at a fairly rapid pace, as shown in Figure 2, the structural change occurred even more quickly around the time when the global financial integration index passed the threshold. This nonlinear change suggests that some qualitative changes, such as shifts in investor preferences, occurred around the time the global financial integration index was near the threshold.
4.2 Accounting of the natural rate of interest
Before presenting the results, it is important to clarify the nature of this exercise. Following Ferreira and Shousha (Reference Ferreira and Shousha2023), the decomposition in this section is an accounting decomposition based on the explanatory variables in equation (4) – productivity, working-age population ratio, convenience yield, net supply of safe assets, and global spillovers – and not a structural shock decomposition. In other words, changes in the natural rate of interest are attributed to the observed movements in each explanatory variable, without identifying the underlying structural shocks that drive those variables. As a consequence, the contributions of individual variables should be interpreted as descriptive accounting rather than causal attribution, and potential interdependencies among the explanatory variables are not explicitly controlled for. Using the parameters in Table 1, we decompose the fluctuations in the cumulative change in the natural rates of interest in Japan, the US, and the euro area, as can be seen in the Figures in 6, 7, and 8.Footnote 18 Footnote 19 Here, we represent both (a) “Actual Decomposition” and (b) “Counterfactual: Constant Global Coefficients” which is counterfactually calculated assuming that the model remains in Regime 1 throughout the sample period, in order to confirm the effect of globalization on the fluctuation in the natural rate of interest.Footnote 20
Decomposition of the Natural Rate of Interest (Japan). Note: This figure shows the decomposition of fluctuations in the cumulative change in Japan’s natural rates of interest.

Figure 6. Long description
Panel A: The line graph titled ‘Actual Decomposition’ shows the cumulative change in Japan’s natural rate of interest from 1985 to 2020. The y-axis represents the cumulative change in percent, ranging from -4 to 1 percent. The x-axis represents the years from 1985 to 2020. The graph includes multiple colored areas and lines representing different factors: Productivity (blue), Working-age population (red), Convenience yield (white with diagonal lines), Net supply of safe assets (black), Global spillovers (gray), and Natural rate (solid red line). The natural rate line shows a significant decline from around 1990, reaching a low point around 2005, and then gradually increasing. Panel B: The line graph titled ‘Counterfactual: Constant Global Coefficients’ shows a similar decomposition under counterfactual conditions. The y-axis and x-axis are the same as in Panel A. The graph includes the same colored areas and lines representing the same factors. The natural rate line in this graph also shows a decline starting around 1990, reaching a low point around 2005, and then gradually increasing, but with different patterns compared to Panel A.
Decomposition of the Natural Rate of Interest (US). Note: This figure shows the decomposition of fluctuations in the cumulative change in the US natural rates of interest.

Decomposition of the Natural Rate of Interest (euro Area). Note: This figure shows the decomposition of fluctuations in the cumulative change in the euro area natural rates of interest.

There are two features in particular shared by each economy. First, according to the results from (a), it is implied that global factors such as convenience yield and global spillovers from foreign real factors pushed the natural rate of interest down to some extent. In this regard, Zhang et al. (Reference Zhang, Martínez-García, Wynne and Grossman2021) also suggest that, in addition to domestic factors, the effect from global factors cannot be ignored in terms of the fluctuation in the natural rate of interest, as this paper demonstrates.Footnote 21 For the natural rates of interest estimated without taking into account global factors, as in Laubach and Williams (Reference Laubach and Williams2003) and all subsequent studies, there are contributions that cannot be explained only by changes in the potential growth rate. This suggests that those contributions can be explained by global factors, to some, not insignificant, extent.
Second, by comparing (a) and (b), downward pressures were significantly affected by the regime change along with the progress of globalization. Specifically, without the coefficient change in global factors driven by globalization, it is suggested that the natural rate of interest was about 0.4 percentage points higher on average for the 35 years since 1985. When we look carefully at the differences in the degree of contribution, convenience yield is 0.2% points, global spillovers from foreign real factors is 0.5% points, and net supply of safe assets is
 $-0.3\%$
points. Based on these results, it is clear that we can understand the degree of the decline in the natural rate of interest and the reasons behind it more clearly if we appropriately incorporate regime change along with globalization.
Next, moving on to the features of each economy. First, in Japan, the cumulative decline is larger than the US and the euro area because of the downward pressure from domestic factors (
 $-1.8\%$
points cumulatively in 1985–2022). In particular, it is apparent that the aging population has lowered the natural rate of interest since the 2000s. This point was also suggested by Sudo et al. (Reference Sudo, Okazaki and Takizuka2018), who argue that demographics was one of the factors that pushed the natural rate of interest down after the 2000s.
For the US, the contribution of domestic factors is not so marked (
 $-0.4\%$
points). Productivity since the global financial crisis and the working-age population ratio since around 2016 have lowered the natural rate of interest, but they are marginal. On the other hand, the contribution from global factors, especially global spillovers from foreign real factors, contributed much more significantly compared with other economies.Footnote
22
This is probably because the US “imports” the effects of the decline in productivity and population aging from Japan and the euro area through the strong linkage in trade transactions, and these bring downward pressure onto the natural rate of interest. From the perspectives of Japan and the euro area, as the literature shows (such as Bodnár and Nerlich, Reference Bodnár and Nerlich2022 and Gagnon et al. Reference Gagnon, Johannsen and López-Salido2016), the decline in the natural rate of interest was mitigated somewhat through the following mechanism: the downward pressure from population aging was diminished through capital outflows to economies with a higher younger population ratio and higher potential growth rate.
For the euro area, although downward pressure from productivity among domestic factors has been prolonged (European Central Bank, 2021), the negative contribution from the working-age population ratio is relatively small. This is probably because the immigration inflow is mitigating the decline of the working-age population ratio (Freier et al. Reference Freier, Schroth and Lichtenauer2023). On the other hand, among global factors, the euro area “imports” the effect of productivity decline and population aging in the UK through the strong linkage in trade, and this is part of the global spillover from foreign real factors which pushes down the natural rate of interest.
4.3 Robustness checks
We conduct robustness checks of the baseline estimation considering the three following viewpoints and confirm that we can obtain mostly the same results as in the baseline estimation. First, to check the robustness of measurement of the demand and supply of safe assets, in Online Appendix 2, we re-estimate the model with the demand and supply of safe assets separately as explanatory variables and confirm that we can replicate the result.
Second, as we reviewed in Section 2, there are various alternative methods of measurement for demographics. In Online Appendix 3, we re-estimate the model with life expectancy instead of working-age population ratio and confirm the robustness of the effect of fluctuations in demographics on the natural rate of interest.
Third, we look into the uncertainty regarding the transition variable. In the baseline estimation, we used external financial assets and liabilities as a proxy variable for the degree of globalization, but there is no consensus as to how to measure globalization. Hence, in Online Appendix 4, we re-estimate the model using the time trend as a transition variable, based on the assumption that globalization progressed linearly with simply a time trend. We confirm the same implication as the baseline.Footnote 23
5. Implications for the outlook of the natural rate of interest
So far, we have analyzed the factors contributing to fluctuations in the natural rate of interest, focusing on the discussion regarding globalization. One of the advantages of this type of qualitative evaluation based on factor-reductionism is that, even if it is difficult to forecast developments in the natural rate of interest itself, when the factors that determine movements can be relatively easily identified, we can acquire some implications for forecasts of the natural rate of interest based on the outlook of its determinants. In the following, we estimate the upward/downward pressure of the working-age population ratio and the net supply of safe assets – since the forecasts for these are made by several organizations and highly likely to fluctuate – on the future natural rate of interest in Japan, the US, and the euro area, to gain implicit indications regarding the future direction of the natural rate of interest. Note that productivity and convenience yield are assumed to be constant from now on.
First, we estimate the working-age population ratio based on the figures forecast by the United Nations. According to Figure 9, which plots the forecast figures until 2030, the working-age population ratio is predicted to decline continuously for all economies. Due to this worldwide decline in the working-age population ratio (Carvalho et al. Reference Carvalho, Ferrero and Nechio2016), natural rates of interest will face downward pressure stemming from both domestic factors and global spillovers from foreign real factors.
If we look carefully at the features, the speed of the decline is slightly different among our three economies, even though it is said to be “slow moving” (Powell, Reference Powell2024). Compared with Japan, which has already seen a significant decline, and the US, which is experiencing a gradual decline, the euro area is forecast to decline at a relatively high speed.
Working-age population. Note: This figure shows the projections for the working-age population ratio up to 2030. The forecast is based on the World Population Prospects 2022 published by the United Nations. The working age is defined as 20 to 60 years old. Source: United Nations.

Net supply of safe assets. Note: This figure shows the projections for the supply of the US Treasury up to 2030. The forecast of supply is based on the outlook of the US public gross debt provided by the CBO, as of February 2024, as a percentage of world GDP using the weight of the US (the average from 2004 to 2022) compared with world GDP. Forecast of demand consists of two scenarios: in the upside demand scenario, demand will increase in line with the 1980-2019 trend; in the downside demand scenario, demand will decrease gradually until 2030, reaching the 1995 level. Source: CBO; IMF; HAVER.

As for the supply of safe assets, we estimate this based on the forecast for the US public debt balance by the Congressional Budget Office (CBO). According to Figure 10, the supply of the US Treasury is assumed to continue increasing until 2030, due to the increase in social security expenditure led by the aging population.Footnote 24
Lastly, as for demand for safe assets, since there is no forecast available, we assume two scenarios: an upside demand scenario – where demand will converge and increase along with the trend of 1980–2019, and a downside demand scenario – where demand will decrease gradually until 2030, reaching the 1995 level.Footnote 25 Please note that the net supply of safe assets will increase because of the increase in the supply of safe assets, in both of the two scenarios (Williams, Reference Williams2018a).
Based on the forecasts explained above, Figure 11 shows the estimation of how each variable, namely, working-age population ratio, global spillovers from foreign real factors,Footnote 26 and the net supply of safe assets, will cumulatively affect the natural rate of interest in the future for the period from the first quarter of 2022 to the fourth quarter of 2030.
Forecast upward and downward pressure on the natural rate of interest. Note: This figure shows the projected cumulative effects of the working-age population ratio, global spillovers from foreign real factors, and the net supply of safe assets on the natural rate of interest for the period from 2022:Q1 to 2030:Q4.

First, the decline in domestic working-age population ratios will put downward pressure on the natural rate of interest in all three economies. Comparing the size of the pressure, the euro area will see a bigger effect than Japan and the US, more than
 $-0.2\%$
points greater, reflecting the speed of future population aging.Footnote
27
Second, the decline in the working-age population ratio can work as an additional downward pressure because it will be contained in the global spillovers from foreign real factors. The downward pressure led by the global spillovers from foreign real factors will be greatest in the US, since the decline due to population aging in the euro area will spillover to the US through the strength of trade linkages.
Lastly, the net supply of safe assets will push the natural rate of interest upward since both the two scenarios assume supply will exceed demand. However, the size of the upward pressure will be different to some extent, depending on the demand scenario. For the downside demand scenario – the upside scenario for the net supply of safe assets – it will be cumulatively
 $+0.4\%$
points, whereas for the upside demand scenario – the downside scenario for the net supply of safe assets – it will be cumulatively just less than
 $+0.1\%$
points.
Based on the outlook provided above, the total cumulative pressures on future natural rates of interest – obtained as the sum of the effects shown in Figure 11 – are estimated to be nearly balanced in Japan and the US, while the pressures lean more toward the downside in the euro area (cumulatively
 $-0.2$
to
 $+0.1$
percentage points in Japan and the US, and
 $-0.3$
to
 $+0.0$
percentage points in the Euro area).
There are several points that should be noted regarding the estimates in this section. First, we account only for the variables that can be assumed with relatively probable forecasts, even though there are thought to be many other factors affecting the natural rate of interest. To look closely at the forecast for future natural rates of interest, uncertainties regarding long-term productivity for each economy (e.g. the penetration of AI and digital transformation) need to be taken into account. Additionally, as globalization progresses, the impact from convenience yield on the natural rate of interest is increasing, and consideration of further fluctuations in convenience yield is crucial in studying the natural rate of interest. If productivity and convenience yields fluctuate greatly, then the natural rate of interest may follow a dynamic movement deviating from the estimation result of this section.
6. Conclusion
This paper examines the effect of globalization on the natural rate of interest by introducing the concept of nonlinear regime change, which previous literature has not taken into account. Specifically, using the global financial integration index as a transition variable, we employ the ST model to estimate changes in the impact and sensitivity of global factors on the natural rate of interest. As a result, global factors including global spillover from foreign real factors, net supply of safe assets, and convenience yield have become nonlinearly more influential on the natural rate of interest since around 2000, and they have played a major role in driving the common decline trend seen worldwide. In addition, the results provided in this paper suggest three further issues: First, through stronger linkages in trade transactions and financial markets due to the progress of globalization, foreign real factors are more easily imported; second, international arbitrage in interest rates among financial markets is functioning; and third, the degree of global co-movement regarding the natural rate of interest has increased through these mechanisms.
Based on these results, the spillover mechanism of global real factors, and their increasing impact, should be taken into account when analyzing the natural rate of interest, by, for example, using an open-economy model rather than a closed-economy model. Particularly, when the estimation includes periods of significant globalization in trade and financial markets, as exemplified by China joining the WTO, there could be a risk of misunderstanding the correct paths unless we model the relationship between the natural rate of interest and global factors appropriately by incorporating regime change.
We conclude here with some further research ideas. Recently, several studies point out the possibility that the short-term natural rate of interest is rising, reflecting worldwide high inflation in the post-COVID era, speedy rate hikes with the intention of fighting inflation, economies remaining resilient despite the hikes, and the increase in investment in reshoring due to higher geopolitical risks (Baker et al. Reference Baker, Casey, Del Negro, Gleich and Nallamotu2023, Schnabel, Reference Schnabel2024, Benigno et al. Reference Benigno, Hofmann, Barrau and Sandri2024). Since we focus on the long-term natural rate of interest and this paper has few implications for this kind of discussion, it would be interesting to further investigate the relationship between geopolitical risks and the developments in the natural rate of interest. In addition, because of data limitations, our estimation period is until the first quarter of 2022. It might be another interesting topic to examine the effect on the natural rate of interest of the rate hike by the Federal Reserve in March 2022, and higher geopolitical risks triggered by Russia’s invasion of Ukraine in February 2022.
Additionally, uncertainties regarding the estimated value and the contributing factors are so great that they cannot be ignored, regardless of the countries being considered. It should be noted that differences in estimation methods, such as assumptions about economic structure and methods for measuring the degree of globalization, can produce a considerable range of estimation results. Besides, one reason the estimation in this paper starts from 1985 is to account for the Plaza Accord and the onset of the Great Moderation, both of which occurred around that time and represent major events in the context of international finance. If the regime changed around 1985, it is quite difficult to capture at the same time its nonlinear effect and the regime change that happened around 2000. Taking this into consideration and analyzing much longer time periods would be one way to further investigate what we have found in this paper. Moreover, in incorporating the global spillover from foreign real factors, this paper assumes that changes in real factors affect other economies, and we do not directly account for its level. However, if we consider that globalization leads to co-movement of economies and financial markets, then it would also be reasonable to assume that the levels of real factors will converge globally. It is also something we leave for future research.
Supplementary material
The supplementary material for this article can be found at https://doi.org/10.1017/S1365100526101138.