Introduction
Downy brome (Bromus tectorum L.) is a widely distributed winter annual grass weed across western North America (Morrow and Stahlman Reference Morrow and Stahlman1984). Genetic evidence suggests Bromus tectorum, which is native to Eurasia, was introduced to North America multiple times (Novak et al. Reference Novak, Mack and Soltis1993). Vigorous initial growth and early seed production compared with other annual grasses allows establishment in disturbed natural areas and agronomic fields. Bromus tectorum is generally in the early boot stage when winter wheat (Triticum aestivum L.) is tillering, heading 4 wk earlier than wheat (Thill et al. Reference Thill, Beck and Callihan1984). Because B. tectorum matures earlier than winter wheat, it often depletes soil moisture and nutrients when winter wheat is at a critical reproductive stage (Thill et al. Reference Thill, Beck and Callihan1984). Multiple studies have characterized variation in B. tectorum phenotype by observing natural populations and conducting common garden experiments and greenhouse studies (Ball et al. Reference Ball, Frost and Gitelman2004; Hulbert Reference Hulbert1955; Klemmedson and Smith Reference Klemmedson and Smith1964; Meyer et al. Reference Meyer, Nelson and Carlson2004; Rice and Mack Reference Rice and Mack1991a, Reference Rice and Mack1991b). Traits including plant size, shoot and root morphology, seed production, and seed dormancy have been reported as variable among individuals collected from the same source population and even among siblings (Hulbert Reference Hulbert1955; Rice and Mack Reference Rice and Mack1991a, Reference Rice and Mack1991b). Variation in B. tectorum phenology, however, has been reported as stable within populations and stable across different environments, and these variations in phenology are considered to be adaptively significant (Hulbert Reference Hulbert1955; Meyer et al. Reference Meyer, Nelson and Carlson2004; Rice and Mack Reference Rice and Mack1991a, Reference Rice and Mack1991b). Ball et al. (Reference Ball, Frost and Gitelman2004), Meyer et al. (Reference Meyer, Nelson and Carlson2004), and Rice and Mack (Reference Rice and Mack1991b) have attributed variation in B. tectorum phenology to variation in the vernalization requirements. Vernalization can be defined as “the acquisition or acceleration of the ability to flower by a chilling treatment” (Chouard Reference Chouard1960:193).
Hulbert (Reference Hulbert1955) described differences in phenology among B. tectorum collections from Europe and North America as “striking” in a common garden experiment. These phenological differences include the first appearance of panicles, the change to purple coloration, and the change to brown coloration (signaling senescence), and these traits were used to differentiate biotypes, because nonphenological traits were too variable (Hulbert Reference Hulbert1955). Rice and Mack (Reference Rice and Mack1991a) also observed phenotypic variation among siblings with respect to flowering time, which was attributed as evidence of plastic response to environmental influences. Flowering time was found to be highly stable among siblings and within populations but variable among populations. Rice and Mack (Reference Rice and Mack1991a) concluded that variation in flowering time was an environmentally stable trait reflecting local adaption among populations. In the same series of studies, Rice and Mack (Reference Rice and Mack1991b) reciprocally sowed B. tectorum seed from four seed sources in a common garden to observe whether phenotypic variation in life history traits would adapt to local climate. Seed number, seed weight, and plant weight did vary from year to year, which was attributed to local adaptation of traits in response to environment. Flowering time, however, was stable from year to year among plants from the same seed source (Rice and Mack Reference Rice and Mack1991b). Rice and Mack (Reference Rice and Mack1991b) concluded the stability observed within flowering time was evidence of strong genetic controls, compared with other traits.
In a series of experiments to model the cumulative growing degree days (GDD) required to produce mature seed, Ball et al. (Reference Ball, Frost and Gitelman2004) observed little variation in the timing of mature seed set from collections in Oregon and Washington. However, when seeds of B. tectorum were collected from across western North America, considerable variation in the GDD required to produce mature seed was reported. The wide variation in phenology across western North America could be attributed to climate affecting the rate of vernalization, biotype differences in vernalization requirements, or both (Ball et al. Reference Ball, Frost and Gitelman2004).
In an unrelated study, Meyer et al. (Reference Meyer, Nelson and Carlson2004) were able to experimentally demonstrate differences in vernalization requirements under greenhouse conditions. Meyer et al. (Reference Meyer, Nelson and Carlson2004) concluded that vernalization response and requirements are adaptively significant and that differences observed between seed sources reflect selection of founder individuals. Bromus tectorum was collected from two contrasting seed sources, one a cold desert environment and the other a warm desert environment. Individuals from each collection were vernalized for 0 to 14 wk, and flowering response was recorded. Little variation was observed for sibling plants collected from the same seed source; however, considerable variation was observed between seed sources. Plants collected from warm, dry desert regions required no vernalization period to flower, and no difference was observed when the length of vernalization was increased (Meyer et al. Reference Meyer, Nelson and Carlson2004). Plants collected from cold, high-altitude locations required vernalization to induce flowering, and the proportion of individuals flowering following the end of vernalization treatments increased with the length of vernalization.
Although no prior research has characterized the genes controlling vernalization in B. tectorum, a great deal is known about vernalization genetics in the cereals wheat and barley (Hordeum vulgare L.), the model species mouse-ear cress [Arabidopsis thaliana (L.) Heynh.], and B. distachyon. The genetic controls of flowering in A. thaliana involve five different pathways and dozens of genes (Srikanth and Schmid Reference Srikanth and Schmid2011). The process of flowering is a whole-plant response, and flowering signals ultimately need to be expressed throughout different plant tissues. In A. thaliana, the vernalization and ambient-temperature flowering pathways are expressed within the leaf tissues, while other flowering pathways are expressed in the meristem. The main gene responsible for the integration of multiple flowering pathways and long-distance signaling of flowering is Flowering Locus T (FT) (Srikanth and Schmid Reference Srikanth and Schmid2011).
A homolog of FT has been identified in the cool-season grasses (Yan et al. Reference Yan, Fu, Li, Blechl, Tranquilli, Bonafede, Sanchez, Valarik, Yasuda and Dubcovsky2006). The FT homolog FT-like 1 (FT1) integrates the vernalization and photoperiod pathway in the cereals and is responsible for long-distance signaling of flowering (Greenup et al. Reference Greenup, Peacock, Dennis and Trevaskis2009). In wheat and barley, vernalization is regulated by the genes Vernalization 1 (VRN1) and Vernalization 2 (VRN2), which together regulate FT1. In wheat, most natural variation in vernalization requirements can be attributed to variation within VRN1 resulting in variable expression (Chen and Dubcovsky Reference Chen and Dubcovsky2012). VRN1 mediates flowering through two mechanisms: (1) acceleration of the transition to reproductive growth at the shoot apex and (2) activation of the long-day response in the leaves (Greenup et al. Reference Greenup, Peacock, Dennis and Trevaskis2009).
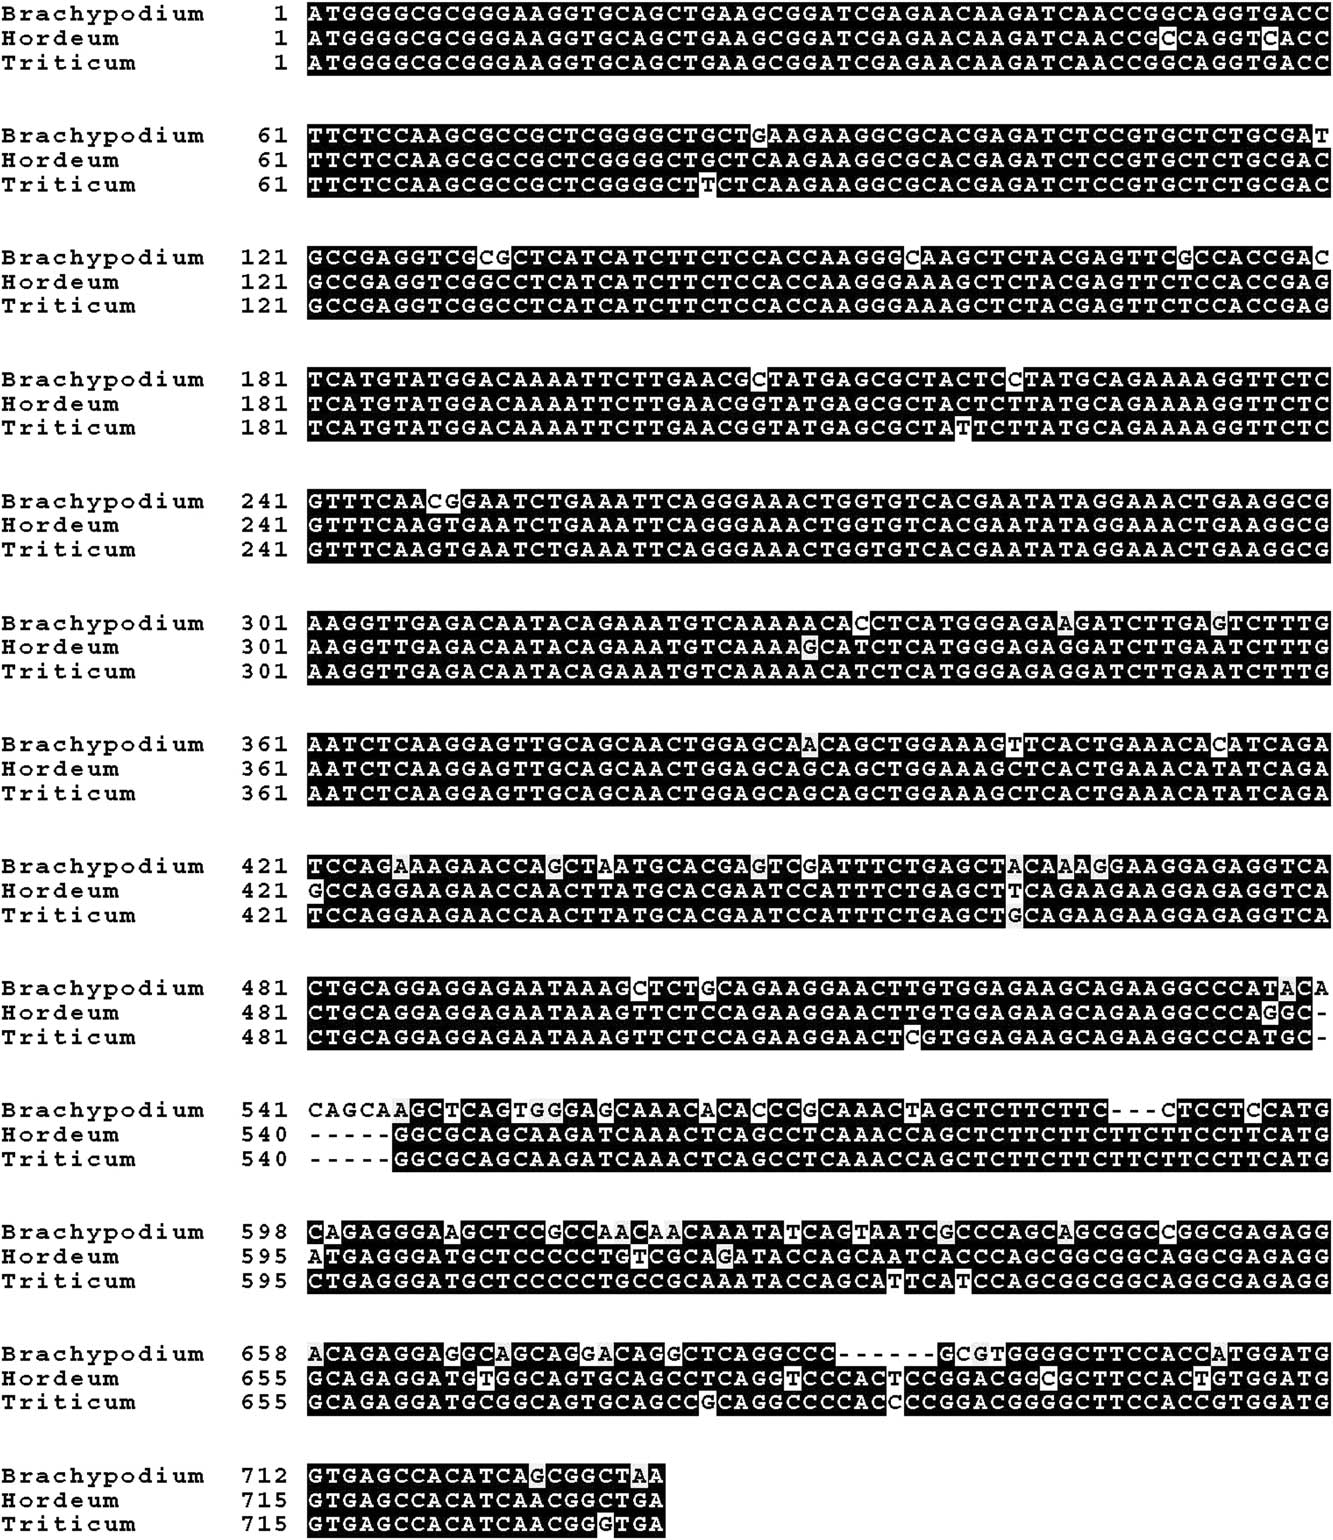
Inferences about the genetic controls of vernalization in B. tectorum at a molecular level may be made based on the relatedness of B. tectorum with wheat, barley, and B. distachyon. All four species are within the subfamily Pooideae. Wheat, barley, and B. tectorum additionally belong to the supertribe Triticodae (Soreng et al. Reference Soreng, Peterson, Romaschenko, Davidse, Zuloaga, Judziewicz, Filgueiras, Davis and Morrone2015). There is greater than 80% homology between the VRN1 gene sequences of wheat, barley, and B. distachyon (Figure 1). Bromus tectorum VRN1 genes are expected to be highly conserved, thus allowing for the development of primers from related species for gene discovery.
Alignment of VRN1 coding DNA sequence from Brachypodium distachyon (NM_001301390.1), barley (KT247898.1), and einkorn wheat (Triticum monococcum L.) (DQ146423.1). GenBank Sequence ID for each species is in parenthesis. Nucleotides shaded in black indicate that two of three sequences are identical; nucleotides shaded gray identify a synonymous substitution; nucleotides not shaded are unique to the sequence and may indicate a nonsynonymous substitution.

Variation in phenology of B. tectorum is a key factor in the success of the species as an ecological invader of natural areas and competitor within agronomic fields (Thill et al. Reference Thill, Beck and Callihan1984). Prior research has documented differing vernalization requirements of B. tectorum collected from different environments (Ball et al. Reference Ball, Frost and Gitelman2004; Meyer et al. Reference Meyer, Nelson and Carlson2004; Rice and Mack Reference Rice and Mack1991b); however, no previous work has documented variation in genetic controls of B. tectorum vernalization at the molecular level. As most variation in vernalization requirements of wheat and barley have been attributed to variation within VRN1 resulting in variable expression (Chen and Dubcovsky Reference Chen and Dubcovsky2012), quantifying the expression of a VRN1 homolog in B. tectorum is a key first step in understanding the genetic controls regulating B. tectorum phenology. A series of greenhouse experiments were conducted to: (1) characterize the vernalization requirements of B. tectorum accessions that had previously demonstrated differential developmental rates and (2) determine whether expression of VRN1 homologs correlates to different rates of development.
Materials and Methods
Plant Materials
A series of common garden experiments involving accessions of B. tectorum collected from within small grain production fields of Washington, Oregon, and Idaho were used to identify differences in time to flowering and the time required for mature seed production and to compare genetic diversity and population structure (Lawrence et al. Reference Lawrence, Hauvermale, Dhingra and Burke2017). The 85 accessions were collected using a systematic random-sampling design (Storfer et al. 2007) wherein a 10-km grid was laid over the small grain production region and a point was randomly assigned for sampling within each grid. In June of 2010 and 2011, each of the sampling locations was visited, and a single B. tectorum plant was collected—either a mature panicle or a live plant. Each accession was taken within a small grain field at least 10 m from the field border. Live plants were transplanted into a greenhouse at the Washington State University (WSU) Plant Growth Facility located in Pullman, WA, and allowed to grow until mature panicles could be collected. To limit the influence of maternal effects, all accessions were later grown from caryopsis through mature seed production, completing one complete life cycle in the same greenhouse. Accessions were planted in a common garden experiment initiated in the fall of 2012 and terminating in the summer of 2013 to characterize differences in time to flowering and mature seed set among the 85 accessions. Each accession was compared using full siblings as biological replicates.
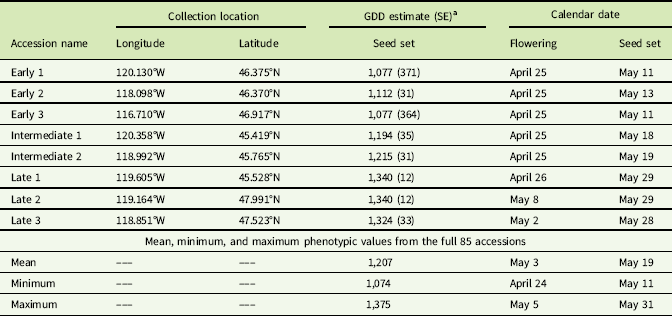
From the full 85 accessions used in the common garden, eight accessions were chosen for further greenhouse experiments. Three were characterized as early to develop, two as intermediate, and three as late to develop, and these eight accessions were used to quantify vernalization requirements and VRN1 expression (Table 1). Bromus tectorum accessions referenced in Table 1 as Early 1, Intermediate 1, Late 1, etc., will be referred to as E1, I1, L1, etc., respectively, throughout the manuscript. Seed used in vernalization experiments was sourced from the same maternal plants as seed used in the 2012 to 2013 common garden experiment.
Accession name, collection location, growing degree days (GDD) estimates, and calendar date of mature seed production, and calendar date of flowering from a 2013 common garden experiment, with mean, maximum, and minimum phenotypic data from all 85 accessions.

a Growing degree model being January 1 with a base temperature of 0 C. Estimates were made using a two-parameter log-logistic regression model.
Vernalization Experiment
Each accession was vernalized for 0, 2, 4, 6, or 8 wk at 3 C in a growth chamber, followed by 8 to 16 wk of observations to determine flowering. The entire duration of the experiment was 16 wk from the start of vernalization through the end of flowering. Plants that were not vernalized (0 wk) were monitored for flowering response for 16 wk. Plants vernalized for 4 and 8 wk were observed an additional 12 and 8 wk, respectively, for flowering response. The study was a completely randomized design with each treatment (vernalization treatment by accession) replicated five times. All biological replicates of the same accession were full siblings. The entire experiment was conducted twice in time and space.
Vernalization treatments were imposed at the 2- to 3-leaf stage. After vernalization, plants were moved to a greenhouse maintained at 24±2 C, with 12 h light d−1 at 400 µmol m−2 s−1. Day length was kept constant at all stages to control for the influence of photoperiod on flowering. Replicates were planted into 49-cm3 containers (RLC3, Stuewe & Sons, Tangent, OR) and filled with a peat-based growth media (LC1 Mix, Sun Gro Horticulture, Bellevue, WA). Seedlings were thinned to 1 seedling container−1 before vernalization.
RNA Extraction
While five biological replications were used to quantify flowering response in each treatment (accession by vernalization treatment), three biological replicates were used from each treatment for RNA extraction. Plant tissue was collected from each treatment 2 wk following the end of each vernalization treatment. This timing was chosen because it was favored in similar studies (Oliver et al. Reference Oliver, Finnegan, Dennis, Peacok and Trevaskis2009; Trevaskis et al. Reference Trevaskis, Hemming, Peacock and Dennis2006). RNA was extracted from leaf tissue according to the protocols developed by Martin et al. (Reference Martin, Liu and Nonogaki2005) and Ornate-Sanchez and Vicente-Carajosa (Reference Ornate-Sanchez and Vicente-Carajosa2008). RNA concentrations were quantified using a NanoDrop 1000 Spectrophotometer (Thermo Fisher Scientific, Wilmington, DE), normalized to a concentration of 250 ng µl−2, and reverse-transcribed to cDNA using iScriptTM Reverse Transcription Supermix (Bio-Rad, Hercules, CA).
VRN1 Expression
The B. distachyon gene Bradi1g08340 (Schwartz et al. Reference Schwartz, Doyle, Manzaneda, Rey, Mitchell-Olds and Amasino2010), 88% identical to barley VRN1 gene (HvBM5A), was used to develop primers to identify expression of a B. tectorum VRN1 homolog. Primers were developed using the first exon from Bradi1g08340 (primers 5′-CATGAGTCGGTGGCGAACT-3′ and 5′-CGGGAAGGTGCAGCTGAA-3′). Elongation factor 1-alpha (EF1α; primers 5′-GTCTGGCCATCCTTGGAGAT-3′ and 5′-CCATCGATATTGCCTTGTGG-3′) was selected as the housekeeping reference gene (Hong et al. Reference Hong, Seo, Yang, Xiang and Park2008). Reverse transcription polymerase chain reaction (RT-PCR) was used to compare cDNA amplicons between accessions across vernalization treatments.
Statistical Analysis
The glm command in R (v. 3.0.2; R Core Team 2013) was used to test for the significance of vernalization and B. tectorum accession on flowering response after 8 wk. Significant inter-actions between vernalization treatment and B. tectorum accession were described by regressing the flowering response of each accession by week of vernalization using the R package ‘drc’ (v. 2.3-96; Ritz and Streibig Reference Ritz and Streibig2005) and a two-parameter logistic regression model suitable for binomial response variables:
 $$f\left( x \right){\equals}{1 \over {1{\plus}{\rm exp}\{b\left[ {{\rm log}(x)} \right{\minus}e]}\}$$
where x is the length of vernalization exposure in wk, e is the wk of vernalization required to produce a 50% response, and b is the slope of the model at e.
Results and Discussion
Vernalization Experiment
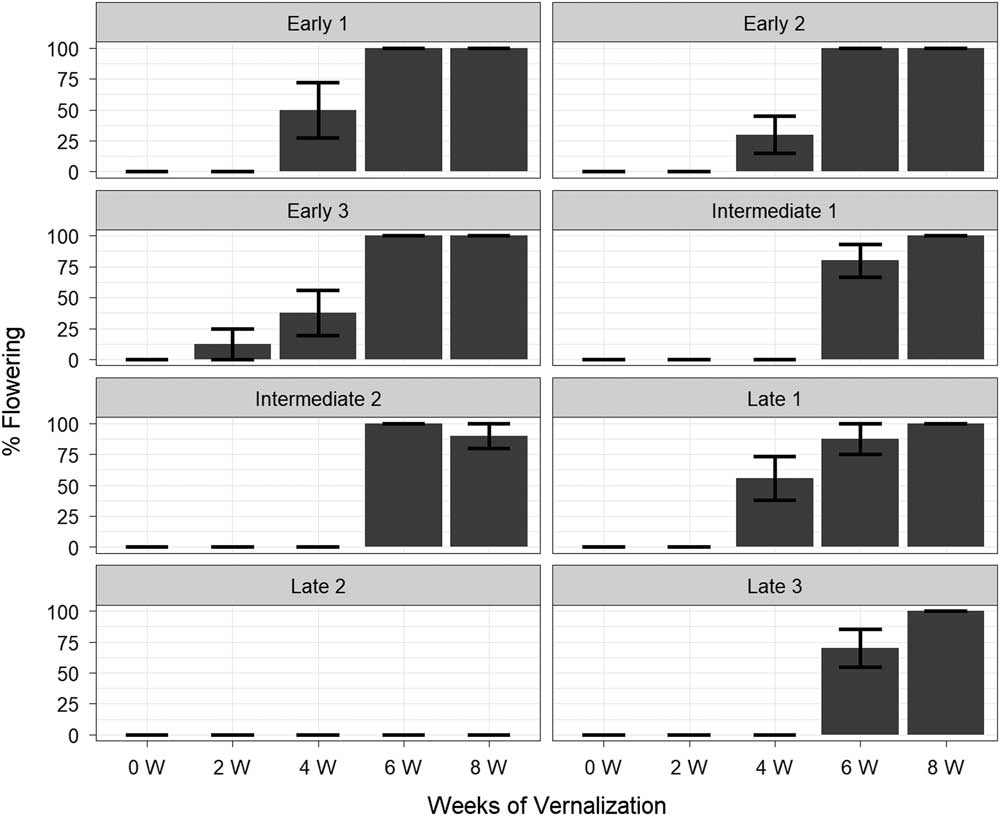
There was no difference in variance between the two study replicates, and results for both studies were combined. Plants that were not vernalized did not flower by the end of the experiment (Figure 2). Only a single replicate from the E3 accession flowered with 2 wk of vernalization. Flowering was observed in 30% to 55% of individuals from the early-flowering accessions and from the L1 accession after 4 wk of vernalization. However, with 6 wk of vernalization, the majority of plants from all accessions flowered. Accession L2 did not flower in response to any of the vernalization treatments, and so, to improve the variance of statistical procedures used to test the significance of flowering response, L2 was removed from further analysis.
Percent individuals flowering from each accession 16 wk after the beginning of vernalization treatments, error bars indicate the standard error of the mean (n = 10).

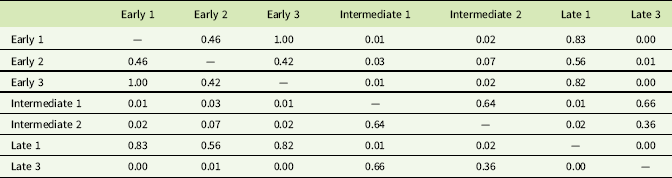
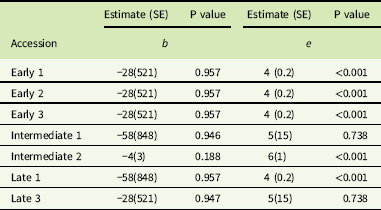
A pairwise comparison to test for the influence of vernalization treatments on each accession segregated the response of each accession into two groups (Table 2). The flowering responses to vernalization treatments of accessions E1, E2, E3, and L1 were similar to one another, as were the flowering responses of I1, I2, and L3. Accessions E1, E2, E3, and L1 were all statistically different from accessions I1, I2, and L3. Regression analysis confirmed the statistical differences identified from the glm procedures. Estimates for the number of weeks required to induce a 50% flowering response were identical for accessions E1, E2, E3, and L1. The estimates for 50% flowering from accessions I1 and L3 were identical and similar to the estimate for I2.
Matrix of pairwise P values indicating which accessions responded differently to vernalization treatments.

VRN1 Expression
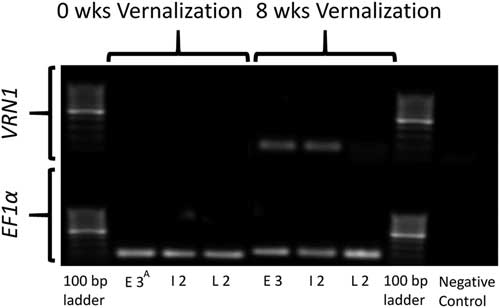
Only cDNA from accessions E3, I2, and L2 was evaluated for expression of VRN1. These three accessions represent the range of flowering response observed in the greenhouse experiment. Expression of the housekeeping control EF1α was observed in all replicates and vernalization treatments from accessions E3, I2, and L2. Expression of VRN1 was determined following 8 wk of vernalization in accessions E3 and I2 for all replicates (Figure 3). Our methods detected no expression of VRN1 in accession L2. This observation supports the hypothesis that VRN1 expression increases following vernalization, as accession L2 did not flower following treatment, and thus was not adequately vernalized. VRN1 expression was not detected in any accession exposed to other vernalization treatments less than 8 wk in length.
Expression of VRN1 in Bromus tectorum. Abbreviations: E3, early 3; I2, intermediate 2; L2, late 2.

Meyer et al. (Reference Meyer, Nelson and Carlson2004) conducted a similarly designed experiment to study the variation of flowering response to different vernalization treatments. Accessions were collected from populations representing two contrasting environments, a cold desert environment in Utah and a warm desert environment Nevada. Comparing the results of Meyer et al. (Reference Meyer, Nelson and Carlson2004) with the results of our experiment with accessions collected from the Pacific Northwest (PNW), individuals collected from Utah and Nevada flowered earlier after similar vernalization treatments. All accessions from the PNW required vernalization to flower, while 100% of individuals from the warm desert environment collected by Meyer et al. (Reference Meyer, Nelson and Carlson2004) flowered without any vernalization treatment.
Between 20% and 30% of individuals from the cold desert environment flowered within 16 wk from a 2-wk vernalization treatment, comparable to the response of accession E3 collected from the PNW. In Meyer et al. (Reference Meyer, Nelson and Carlson2004), greater than 80% of individuals from cold desert environments flowered from a 4-wk vernalization treatment within 10 wk, while only 22% of individuals collected from the PNW flowered within 12 wk after a 4-wk vernalization treatment. The different vernalization requirements of plants collected from the PNW and plants collected from Utah and Nevada likely is a reflection of different environments selecting against founder genotypes (Ramakrishnan et al. Reference Ramakrishnan, Meyer, Fairbanks and Coleman2006; Scott et al. Reference Scott, Meyer, Merrill and Anderson2010), with the climate of the PNW selecting for genotypes with more robust vernalization requirements compared with the desert climates of Utah and Nevada.
While most accessions exhibited a similar phenology in the greenhouse as was observed in the field, the pattern of flowering response observed with accession L1 differed between greenhouse and common garden experiments (Tables 1 and 3). Vernalization is controlled by more than just VRN1, so the role of other vernalization factors may need to be further explored in B. tectorum. Future research will need to investigate the role of day length and VRN2 expression to explain the flowering behavior of accession L1. In wheat and barley, ambient temperatures and day length influence the expression of FT1 and induce flowering. VRN2 suppresses FT1 in the presence of long days (Hemming et al. Reference Hemming, Peacock, Dennis and Trevaskis2008; Takahashi and Yasuda Reference Takahashi and Yasuda1971). VRN1 is activated with vernalization, and both VRN1 and vernalization upregulate FT1 and downregulate VRN2 (Hemming et al. Reference Hemming, Peacock, Dennis and Trevaskis2008, Trevaskis et al. Reference Trevaskis, Hemming, Peacock and Dennis2006).
Regression parameters estimating the weeks of vernalization required to induce flowering in 50% of individuals in each accession.Footnote a

a Model parameters: b, slope of the model at e; e, weeks required to induce flowering in 50% of individuals.
Despite flowering being observed in accession E3 after 4 wk of vernalization, RT-PCR did not detect any expression of VRN1 from the 4-wk treatment. In a study of vernalization and photoperiod requirements for B. distachyon, Ream et al. (Reference Ream, Woods, Schwartz, Sanabria, Mahoy, Walters, Kaeppler and Amasino2014) reported significant differences in the expression of VRN1 from saturating and subsaturating treatments. Subsaturating treatments did not differ significantly from nonvernalized plants with respect to VRN1 expression but did correlate with delayed flowering compared with fully vernalized individuals. The 4-wk vernalization treatment was likely subsaturating compared with 6- and 8-wk vernalization treatments for most accessions. In barley, HvVRN1 was similarly detectable after 7 or 9 wk of vernalization by gel-blot analysis, but difficult to observe after 1, 3, or 5 wk of vernalization (Trevaskis et al. Reference Trevaskis, Hemming, Peacock and Dennis2006). Additionally, accession L1 never flowered in greenhouse experiments, despite flowering in common garden experiments. Likely, the 8-wk vernalization treatment was an inadequate exposure to vernalizing temperatures for accession L1, and a longer cold period was needed to induce a flowering response.
While we were able to develop B. tectorum primers to capture VRN1 expression from the BdVRN1 coding DNA sequence, further work is needed to fully explain the role of B. tectorum VRN1 in governing phenology. The majority of variation in flowering time among cereal species can be attributed to variation in VRN1 expression (Chen and Dubcovsky Reference Chen and Dubcovsky2012). Spring varieties of wheat and barley with no vernalization requirement contain either a mutation in the VRN1 promoter or a deletion or insertion within the first intron of VRN1 (Cockram et al. Reference Cockram, Chiapparino, Taylor, Stamati, Donini, Laurie and O’Sullivan2007; Fu et al. Reference Fu, Szucs, Yan, Helguera, Skinner, Von Zitzewitz, Hayes and Dubcovsky2005; Szucs et al. Reference Szucs, Skinner, Karsai, Cuesta-Marcos, Haggard, Corey, Chen and Hayes2007; Yan et al. Reference Yan, Loukoianov, Tranquilli, Helguera, Fahima and Dubcovsky2003; Von Zitzewitz et al. Reference Von Zitzewitz, Szucs, Dubcovsky, Yan, Francia, Pecchioni, Casas, Chen, Hayes and Skinner2005). If B. tectorum flowering is regulated in a similar manner to cereal crop flowering, sequencing of the B. tectorum VRN1 homolog is the likely next step for identifying the molecular basis of variation in B. tectorum vernalization requirements. Future work that sequences the VRN1 homolog and expands upon the role of other genes may lead to molecular markers that could be used to identify early- and late-to-flower biotypes in the field. Such markers may be useful when considering management options, such as deciding on the timing of a herbicide application or in projecting B. tectorum phenology under future climates.
Previous research has suggested the relative differences in phenology observed among B. tectorum populations is likely due to variation in vernalization requirements (Ball et al. Reference Ball, Frost and Gitelman2004; Meyer et al. Reference Meyer, Nelson and Carlson2004; Rice and Mack Reference Rice and Mack1991b). The expression of a VRN1 homolog was only found in vernalized plants and is similar to what has been reported for B. distachyon (Ream et al. Reference Ream, Woods, Schwartz, Sanabria, Mahoy, Walters, Kaeppler and Amasino2014) and barley (Trevaskis et al. Reference Trevaskis, Hemming, Peacock and Dennis2006). To fully elucidate the flowering requirements of B. tectorum, the role of other flowering genes and the role of day length in regulating B. tectorum flowering still needs to be addressed.
Acknowledgments. The authors wish to thank Camille Steber of the USDA-ARS in Pullman, WA, for access to lab space and equipment used in RNA extraction. The authors also appreciate the contributions made by two anonymous reviewers and the associate editor in improving this article. This research was funded by a National Institute for Food and Agriculture competitive grant (award no. 2011-68002-30191). No conflicts of interest have been declared.