1. Introduction
Recently, there has been increasing interest in the dynamics of cavitation bubbles in three-dimensional (3-D) configurations. The rationale behind these studies was that, by better understanding the bubble dynamics in more complex and realistic geometries, it would be possible to gain more insight into the cavitation effects on nearby boundaries and to identify new applications of cavitation in the medical and commercial fields. Some of the earliest studies in this field have been restricted to numerical simulations of the collapse of buoyant bubbles near inclined and vertical rigid walls (Zhang et al. Reference Zhang, Yeo, Khoo and Wang2001; Wang Reference Wang2004; Jayaprakash, Hsiao & Chahine Reference Jayaprakash, Hsiao and Chahine2012; Zhang & Liu Reference Zhang and Liu2015) and to the interaction of a bubble situated near a rigid wall with an ultrasound wave propagating in a direction parallel to the wall (Wang & Manmi Reference Wang and Manmi2014). More recent studies have focused on the jetting behaviour of a bubble collapsing near two perpendicular rigid walls (Brujan et al. Reference Brujan, Noda, Ishigami, Ogasawara and Takahira2018; Tagawa & Peters Reference Tagawa and Peters2018), in acute- or obtuse-angled corners (Cui et al. Reference Cui, Chen, Wang, Zhou and Corbett2020; Wang et al. Reference Wang, Mahmud, Cui, Smith and Walmsley2020b), inside squared and triangular channels (Molefe & Peters Reference Molefe and Peters2019) and near the corner of a rigid wall and a free surface (Zhang et al. Reference Zhang, Zhang, Wang and Cui2017; Li et al. Reference Li, Zhang, Wang and Zhang2019). Other 3-D configurations that have been investigated include the case of a pair of buoyant bubbles oscillating in an unbounded liquid (Tian et al. Reference Tian, Zhang, Liu and Tao2021) and a pair of bubbles collapsing near a free surface (Wang et al. Reference Wang, Liu, Yuan, Jiang and Wang2020a; Liu et al. Reference Liu, Zhang, Cui, Wang and Li2021). These studies provide valuable insight into the interaction between cavitation bubbles and rigid structures. Nevertheless, additional investigations are needed to further understand the complicated dynamics of cavitation bubbles in more complex 3-D geometries than in the studies indicated above.
In this paper we investigate the dynamics of laser-induced cavitation bubbles in a rectangular channel. An important application of the present study is in the underwater laser-assisted machining of microchannels (Liao et al. Reference Liao2010, Reference Liao2013; Li, Qu & Guo Reference Li, Qu and Guo2011). The immersion of the machined material in water has enabled the fabrication of 3-D channels in a large variety of materials, with an increased machining efficiency and a smaller processing time. It was suggested that the growth and collapse of cavitation bubbles, triggered by the laser pulse, can assist the removal of molten material and debris during the lasing process, improving the cutting procedure (Ke, Hasselbrink & Hunt Reference Ke, Hasselbrink and Hunt2005; Mak, Lam & Choi Reference Mak, Lam and Choi2011; Garcia-Giron, Sola & Pena Reference Garcia-Giron, Sola and Pena2016; Wang et al. Reference Wang, Huang, Xu, Xing and Kang2019). Although clean and deep trenches can be made using this technique, an increased roughness of the channel walls, with cavernous and crater-like damage structures and deep holes occurring extensively over the sidewalls of the channel, was reported in several studies (Yan et al. Reference Yan, Li, Sezer, Wang, Whitehead, Ji, Bao and Jiang2011; Charee, Tangwarodomnukun & Dumkun Reference Charee, Tangwarodomnukun and Dumkum2015, Reference Charee, Tangwarodomnukun and Dumkum2016). Localized mixing of fluids in rectangular channels is another application where laser-induced cavitation bubbles play an important role in the mixing process (Hellman et al. Reference Hellman, Rau, Yoon, Bae, Palmer, Phillips, Allbrighton and Venugopolan2007). The present investigations are also relevant to the dynamics of laser-induced cavitation bubbles in slot geometries. The motion of a cavitation bubble outside of the slot (a rectangular channel) was investigated by Andrews, Fernandez Rivas & Peters (Reference Andrews, Fernandez Rivas and Peters2020). Here we extend their investigations to study the dynamics of the bubbles inside the slot as a potential mechanism of cavitation cleaning of a narrow space. The use of laser-induced cavitation bubbles to manipulate micro-objects or to assemble microstructures of various sizes and shapes may be an attractive perspective as well. The 3-D manipulation of concave structures, similar to that used in the present investigation, has recently been reported by Dai et al. (Reference Dai, Ge, Jiao and Liu2019), using laser-activated bubble micro-robots.
The dynamics of a bubble in a rectangular channel belongs to a particular configuration, namely a bubble situated in three pressure gradients. The bubble is subjected to two opposing pressure gradients perpendicular to the sidewalls of the channel and to a third pressure gradient, acting perpendicularly to the other two, induced by the endwall of the channel. A similar situation is encountered in the case of a buoyant bubble generated between two vertical parallel rigid walls (Choi & Chahine Reference Choi and Chahine2004). Here, the third pressure gradient is given by the buoyancy force generated by the pressure difference between the lower and upper bubble walls. The present results are also relevant to the case of two equal-sized bubbles, generated simultaneously, between two parallel rigid walls, and at equal distance from the walls, as the plane of symmetry between the two bubbles is acting as a rigid wall (except for a thin boundary layer in the case of a real rigid wall) (Hsiao et al. Reference Hsiao2013). Besides the opposing pressure gradients induced by the parallel walls, each individual bubble is subjected to a time-dependent pressure gradient, directed perpendicular to the plane of symmetry of the bubble pair, generated by the low-pressure region between the bubbles. Interestingly, a bubble collapsing in an acute-angled corner (Cui et al. Reference Cui, Chen, Wang, Zhou and Corbett2020; Wang et al. Reference Wang, Mahmud, Cui, Smith and Walmsley2020b) belongs to the same category, as we will show later. Decomposition of the pressure gradients, acting on the collapsing bubble, in two perpendicular directions leads to a similar configuration to that in a rectangular channel.
In a previous study (Brujan, Takahira & Ogasawara Reference Brujan, Takahira and Ogasawara2019), we have described the formation of a planar jet, a jet extended in a direction perpendicular to the sidewalls of the channel with an elongated triangular prism shape, directed towards the endwall of the channel. Here we report systematic experimental and numerical investigations on the jetting behaviour and migratory characteristics of a laser-induced cavitation bubble in a rectangular channel, for various combinations of the geometric and physical parameters of the system, and we document new observations. High-speed photography with 100 000 frames s−1 is used to visualize the temporal development of the bubble shape, the formation of liquid jets during bubble collapse and the occurrence of counterjet-like structures during bubble rebound. The experimental results also give information on the migratory characteristics of the bubble during its first two oscillation cycles. To better understand the jetting behaviour of the bubble, we used computational fluid dynamics software based on the finite element method to simulate the experimental results. The numerical simulations portray the pressure distribution and the velocity vectors in the liquid surrounding the bubble, and provide quantitative information on the direction and velocity of the liquid jets formed during bubble collapse. Finally, the results of our investigations are compared with previous experimental and numerical results obtained in similar configurations.
2. Methods
2.1. Experimental
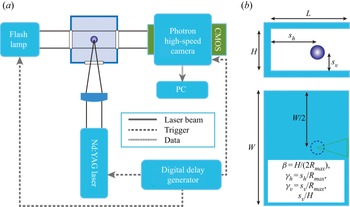
A schematic representation of the experimental set-up used for investigating the behaviour of a laser-produced cavitation bubble in a rectangular channel is shown in figure 1. The cavitation bubbles were generated in a glass cuvette, filled with distilled water, by using a Q-switched Nd:YAG laser (Spectra Physics Quanta Ray INDI). The wavelength of the laser light is 1064 nm and the energies of the laser pulses are up to 200 mJ with a duration of 6 ns. The laser beam is focused into the glass cuvette by a lens that is optimized to minimize spherical aberrations and produce a short plasma length at a sufficient distance from the walls of the cuvette. Stable cavitation bubbles, with a maximum radius of 1.2 mm, can be generated with this experimental set-up in the absence of the channel. The bubbles display an almost perfect spherical shape at their maximum volume, with a very small oblate deformation in an initial phase of the expansion. Variation in laser energy and laser pulse patterns for different pulses caused a fluctuation of less than ±10 % in the maximum bubble radius. The rectangular channel, with a maximum gap height H = 4 mm, length L = 15 mm and width W = 25 mm, is made of aluminium with a wall thickness of 10 mm. In all experiments, the laser was focused in the middle of the channel width.
Schematic diagram of the high-speed photography experimental set-up (a) and the parameters governing the behaviour of a laser-induced cavitation in a rectangular channel (b). Note that the view in (b) is along the laser beam axis in (a).

Various positions of the bubble with respect to the end- and sidewalls of the channel were obtained by mounting the channel on a xyz linear translation stage. The behaviour of the cavitation bubble generated at the laser focus was recorded with a high-speed image converter camera (Photron Fastcam SA 1.1, model 675K-M1), at a framing rate of 100 000 frames s−1 with an exposure time of 500 ns. The image was recorded using a complementary metal–oxide–semiconductor (CMOS) camera system with a 320 × 128 pixel array. The signal from the CMOS camera was then digitized with 12-bit resolution and passed to a computer. Illumination into the focal region of the laser is done by a flashlamp with 500 ms flash duration, which covered the most relevant part of the bubble behaviour. A digital delay generator was used to trigger the laser, the high-speed camera and the flashlamp.
2.2. Numerical
We used in-house computational fluid dynamics software based on the finite element method to gain more insight into the dynamics of laser-induced cavitation bubbles in a rectangular channel. The mathematical model assumes a constant gas content of the bubble, neglecting the vapour content, evaporation and condensation at the bubble interface, gas diffusion and heat conduction through the bubble wall, and surface tension. Under these assumptions, the fluid flow can be modelled with the following equations (Liu et al. Reference Liu, Zhang, Tian and Wang2019; Tian et al. Reference Tian, Zhang, Liu and Tao2021), with the multi-medium interface treated by the volume-of-fluid (VOF) method:
 \begin{equation}\left.
{\begin{array}{c@{}} {\dfrac{{\partial
{\alpha_i}}}{{\partial t}} ={-} \boldsymbol{\nabla
}\boldsymbol{\cdot }({\alpha_i}\boldsymbol{u}) +
{\lambda_i},}\\
{\dfrac{{\partial ({\alpha_i}{\rho_i})}}{{\partial t}} ={-}
\boldsymbol{\nabla }\boldsymbol{\cdot
}({\alpha_i}{\rho_i}\boldsymbol{u}),}\\
{\dfrac{{\partial (\bar{\rho }\boldsymbol{u})}}{{\partial t}} ={-} \nabla
(\bar{\rho }\boldsymbol{uu} + p\boldsymbol{\mathsf{I}}) + \bar{\mu
}{\kern 1pt} \boldsymbol{\nabla }(\boldsymbol{\nabla
}\boldsymbol{\cdot }\boldsymbol{u}),}\\
{\dfrac{{\partial ({\alpha_i}{\rho_i}{e_i})}}{{\partial t}} ={-}
\boldsymbol{\nabla }\boldsymbol{\cdot
}({\alpha_i}{\rho_i}{e_i}\boldsymbol{u}) - p{\lambda_i} +
{\alpha_i}{\rho_i}\varPhi .} \end{array}}
\right\}\end{equation}
In the above equations,  $\rho $,
 $\boldsymbol{u}$, p,
 $\mu $ and e are the fluid density, velocity, pressure, viscosity and specific internal energy, respectively,
 $\boldsymbol{\mathsf{I}}$ is the identity matrix,
 $\varPhi $ is the energy dissipation function describing the effects of viscous stresses, and
 $\alpha $ is the fluid volume fraction. The subscript represents the quantity of fluid component i and a bar above indicates the average quantity of the mixture. The effective divergence of the fluid component i is denoted by
 ${\lambda _i}$, which can be expressed as
 \begin{equation}{\lambda _i} = {\alpha _i}\frac{{\bar{K}}}{{{K_i}}}\boldsymbol{\nabla }\boldsymbol{\cdot }\boldsymbol{u},\end{equation}
where  $K = \rho {C^2}$ is the bulk modulus of the fluid and C is the sound speed.
The above equations are closed by the equation of state of the fluid, which is chosen as the Tammann equation (see, for example, Ivings, Causon & Toro Reference Ivings, Causon and Toro1998), which reads
 \begin{equation}p = \rho e(\gamma - 1) - {P_w}\gamma ,\end{equation}
where  $\gamma $ is the ratio of heat capacity, and
 ${P_w}$ is the reference pressure. In the present numerical simulations,
 $\gamma = 7.15$ and
 ${P_w} = 330.9\;\textrm{MPa}$ for the water surrounding the bubble, and
 $\gamma = 1.4$ and
 ${P_w} = 0$ for the internal gas. The Tammann equation of state can be applied to model a wide range of fluids even in the presence of strong shock waves (Ivings et al. Reference Ivings, Causon and Toro1998). It reduces to the well-known Tait equation for water if the flow is isentropic (Chen & Collins Reference Chen and Collins1971). Other pertinent numerical values used in the calculations are
 ${p_\infty } = {10^5}\;\textrm{N}\;{\textrm{m}^{ - 2}}$,
 ${\rho _l} = 1000\;\textrm{kg}\;{\textrm{m}^{ - 3}}$ for the liquid density, resulting in a sound speed in the liquid Cl = 1538 m s−1, and dynamic viscosity of the liquid
 ${\eta _l} = {10^{ - 3}}\;\textrm{Pa}\;\textrm{s}$. The dynamic viscosity of the gas inside the bubble is set to be zero.
The Eulerian finite element method with the operator split technique is adopted to solve the above equations. The non-convective terms of (2.1) are first split and discretized with the explicit finite element method, during which the mesh advances with the fluid material. Then, the residual terms are incorporated with a conservative mapping between the deformed and original meshes. These two procedures are regarded as the Lagrangian and the Eulerian phases, respectively. For 3-D simulation, the adaptive mesh refinement technique is introduced to balance the efficiency and accuracy. The method has been validated intensively with bubble dynamics experiments in previous publications (Liu et al. Reference Liu, Zhang, Tian and Wang2019; Tian et al. Reference Tian, Zhang, Liu and Tao2021), which also provide a detailed description of the numerical implementation.
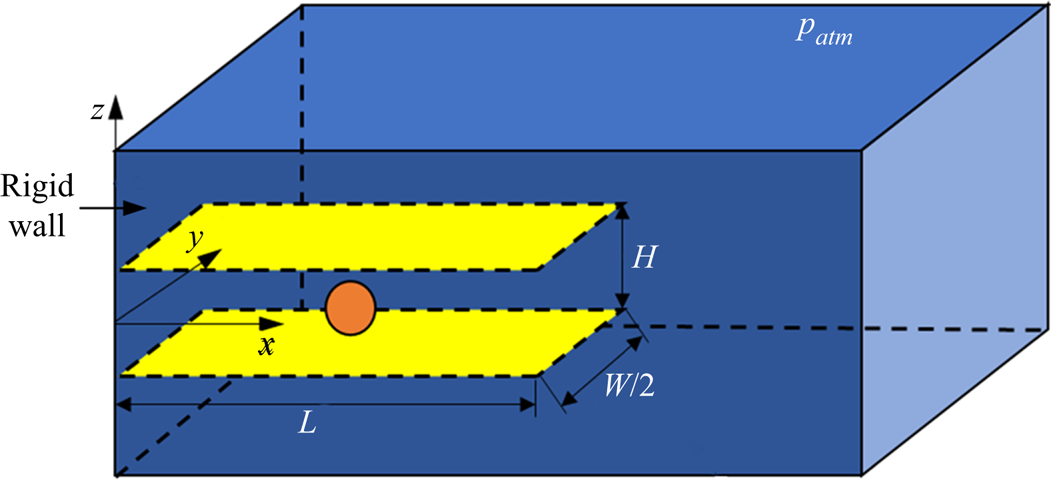
A coordinate system is established with its origin located at the centre of the endwall of the channel, axis x pointing into the fluid and axis z pointing upwards. Because the bubble is always generated at y = 0, the symmetry about y = 0 is taken advantage of to reduce the computational cost. The computational domain is taken as a block bounded by  $[0,2L] \times [0,W] \times [ - 2H,2H]$, as shown in figure 2. A constant pressure of
 ${p_{atm}}$ is imposed onto the upward-facing boundary of the computational domain to mimic the free surface. The front-facing boundary at the symmetry plane,
 $y = 0$, is set to be impenetrable. The other boundaries are the water tank walls, and their nodal velocities are set to be zero. The boundary conditions on the sidewalls of the channel are also simulated by enforcing the nodal velocity on them to be zero, as shown by the two light-yellow plates in figure 2. The computational domain is discretized into a staggered hexahedral mesh, and the mesh near the bubble surface is dynamically refined. The smallest and largest mesh sizes are taken as
 $H/256$ and
 $H/32$, respectively. The algorithm is advanced by explicit integration in time, and the following conditions are used to dynamically update the time step to ensure the stability of the algorithm:
 \begin{equation}\Delta t = \textrm{CFL}{[{\min (|\boldsymbol{\nabla }\boldsymbol{\cdot }\boldsymbol{u}{|^{ - 1}},{L_m}{{(c + |\boldsymbol{u}|)}^{ - 1}})} ]^{min}},\end{equation}
where  $\mathrm{\Delta }t$,
 ${L_m}$ and c are the time step, mesh size and sound speed, respectively. The term ‘min’ denotes the minimum value of all the meshes. The Courant–Friedrichs–Lewy number CFL is a scale factor and is fixed as 0.5 in the present investigations. The simulation is performed on a Linux platform (AMD EPYC ROME 2.35 GHz × 64) and it takes about 20 hours for each case.
Schematic representation of the model geometry used in the numerical simulations.

Mathematical modelling of the spatial distribution and temporal evolution of the energy deposition during optical breakdown is difficult, and the details depend strongly on the laser pulse energy and duration (Vogel, Busch & Parlitz Reference Vogel, Busch and Parlitz1996; Vogel et al. Reference Vogel, Nahen, Theisen and Noack1996). We therefore neglect the details of the breakdown process and start the simulations with a nucleus of radius R 0 and interior pressure p 0. In the calculations, p 0 is taken to be 100 times the static pressure of the surrounding liquid, the initial density of the internal gas is  ${\rho _{g,0}} = 10\;\textrm{kg}\;{\textrm{m}^{ - 3}}$ (resulting in a sound speed in the gas Cg ,0 = 1015 m s−1), the initial velocity of the nucleus wall is zero, and the initial radius, R 0, is adjusted to fit the experimentally observed bubble volume at its maximum expansion.
2.3. Significant parameters of the study
For the convenience of depicting the behaviour of the bubble in a rectangular channel, we use three non-dimensional parameters,  ${\gamma _h} = {s_h}/{R_{max}}$,
 ${\gamma _v} = {s_v}/{R_{max}}$ and
 $\beta = H/(2{R_{max}})$, where sh and sv are, respectively, the distance between the laser focus and the endwall and lower sidewall of the channel, Rmax is the maximum bubble radius and H is the channel height in a view looking with the pump laser beam (see figures 1 and 2). A fourth dimensionless parameter, sv/H, is introduced to indicate the position of the laser focus with respect to the sidewalls of the channel. Note that
 ${s_v}/H = {\gamma _v}/(2\beta )$. For β > 1, where the bubble at its maximum expansion is non-spherical, Rmax denotes the equivalent spherical radius, i.e. the radius of a spherical bubble with the same volume, and its value was converted from the elliptical bubble considering its vertical and horizontal radii, measured from the photographs, as
 ${R_{max}} = {(R_{hor}^2{R_{vert}})^{1/3}}$. For β < 1, where the maximum span of the bubble size is wider than the gap H between the two channel sidewalls, Rmax represents the maximum radius of a bubble produced without any nearby boundaries. For this particular case, we assumed that the maximum bubble volume, and hence the equivalent spherical radius of the bubble, is independent of the initial position of the bubble inside the channel for constant laser pulse energy.
The relative size of the bubble with respect to the channel height, β, was varied within the range 0.85 to 3.5 and the dimensional distance between the initial position of the bubble and the lower sidewall of the channel,  ${s_v}/H$, within the range 0.15 to 0.5. The largest value of the maximum bubble radius in the present investigations is Rmax = 1.1 mm so that, for such small bubbles, the effect of buoyancy is negligible.
3. Experimental results
In this section we examine the jetting behaviour of the bubble as a function of its relative size with respect to the distance between the sidewalls of the channel and the initial position of the bubble inside the channel. In all photographic records the endwall of the channel is situated on the left-hand side of the photographic frames, while the sidewalls can be seen at the upper and lower sides of the frames, respectively. Both the first and second oscillation cycle of the bubble are displayed on each photographic sequence. We do not always show high-speed photographic sequences for all values of the geometric and physical parameters of the system, but mainly illustrate the changes of jetting behaviour of the bubble on varying the significant parameters of this study. An overview of the jetting behaviour for the case where the bubble diameter is slightly smaller than the height of the channel is given later in the schematic representation of figure 11.
3.1. Bubbles generated at equal distance from the channel sidewalls  $({s_v}/H \approx 0.5)$

3.1.1. Bubble behaviour for β ≈ 0.85
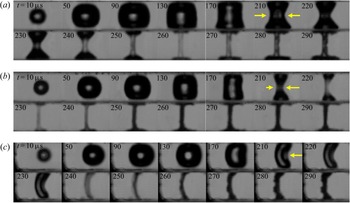
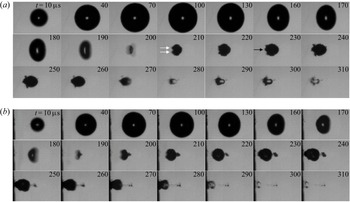
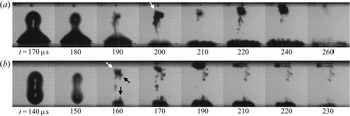
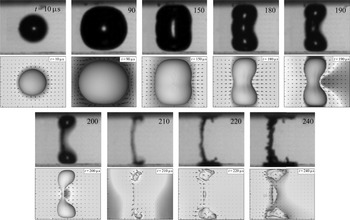
High-speed photographic sequences illustrating the temporal development of the bubble shape, for β ≈ 0.85, are shown in figure 3. When the bubble is generated far from the endwall of the channel ( ${\gamma _h} \approx 10.5$, figure 3a), it achieves an oblate shape in an early growth phase and starts to collapse from its sides (t = 170 μs). A symmetric annular jet develops in the early stage of the bubble collapse (clearly visible for t > 170 μs), leading to the formation of an hour glass shape of the bubble. Around the first collapse point (t = 260 μs), the bubble shape consists of two opaque lobes, in contact with the sidewalls of the channel, connected by a transparent tubular straight structure. For t > 260 μs, the bubble is in rebound and both the tubular structure and the bubble lobes increase in volume.
Dynamics of a cavitation bubble generated at equal distance from the sidewalls of a rectangular channel for β ≈ 0.85: (a) γh ≈ 10.5, sv/H = 0.5 ± 0.01 (γv ≈ 0.85); (b) γh ≈ 4, sv/H = 0.5 ± 0.01 (γv ≈ 0.85); and (c) γh ≈ 1.8, sv/H = 0.5 ± 0.01 (γv ≈ 0.5). The arrows inserted in the frames taken at t = 210 μs depict the direction and the relative strength of the annular flow. The inter-wall gap height is H = 1.7 mm and the maximum bubble radius is Rmax = 1 ± 0.1 mm, which was measured in an unbounded liquid. Frame width 2.85 mm.

A bubble generated closer to the endwall of the channel develops an asymmetric annular jet (figure 3b,  ${\gamma _h} \approx 4$). The bubble collapses faster from its side farthest from the endwall (see the bubble shape at t = 220 μs) and the structure connecting the upper and lower lobes is now slightly arcuate. A weak migration of the bubble towards the endwall of the channel can be observed in the rebound phase of the bubble. The asymmetry of the annular flow may suggest the formation of a liquid jet, directed towards the endwall of the channel, in a late collapse stage. However, no protrusion of the opposite bubble wall was observed during the second oscillation period of the bubble.
At an even smaller  ${\gamma _h}$ value (
 ${\gamma _h} \approx 1.8$, figure 3c), the annular jet is no longer formed. Instead, the bubble motion is accompanied by the formation of a planar jet directed towards the endwall of the channel. The jet penetrates the opposite bubble wall (t > 250 μs), which until then is almost motionless, and the bubble noticeably migrates in the direction of the planar jet, with its upper and lower extremities in contact with the sidewalls of the channel.
3.1.2. Bubble behaviour for β ≈ 1.1
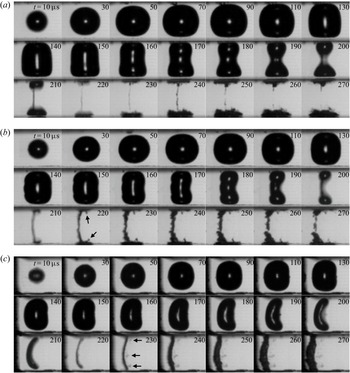
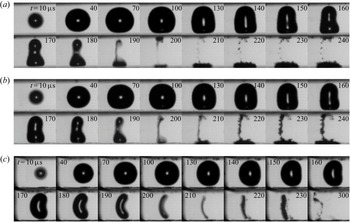
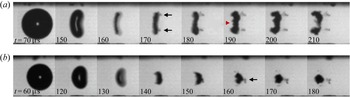
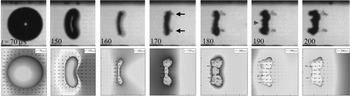
With a smaller β value (β ≈ 1.1, figure 4), several additional features of the bubble dynamics attract attention. First, at large  ${\gamma _h}$ values, we observed the formation of an asymmetric annular flow as a consequence of a faster collapse of the bubble side opposite to the endwall of the channel. At
 ${\gamma _h} = 11.58 \pm 0.35$ (figure 4a), the asymmetry of the flow field around the bubble is too weak to generate a pronounced planar jet that penetrates the opposite side of the vertical structure connecting the bubble lobes. There is, however, a weak liquid flow directed towards the endwall of the channel, as can be deduced from the slight bending of the connecting structure during bubble rebound (see, for example, the frame taken at t = 240 μs).
Dynamics of a cavitation bubble generated at equal distance from the sidewalls of a rectangular channel for β ≈ 1.1: (a) Rmax = 820 ± 24 μm, γh = 11.58 ± 0.35, sv/H = 0.49 ± 0.02 (γv = 1.02 ± 0.07), β = 1.04 ± 0.03; (b) Rmax = 790 ± 24 μm, γh = 5.06 ± 0.18, sv/H = 0.49 ± 0.02 (γv = 1.06 ± 0.07), β = 1.07 ± 0.03; and (c) Rmax = 720 ± 24 μm, γh = 1.39 ± 0.07, sv/H = 0.5 ± 0.02 (γv = 1.18 ± 0.07), β = 1.18 ± 0.04. The gap height between the two parallel rigid walls is H = 1.7 mm. Frame width 2.2 mm.

At a smaller  ${\gamma _h}$ value (
 ${\gamma _h} = 5.06 \pm 0.18$, figure 4b), the flow directed towards the endwall of the channel becomes stronger, leading to the formation of a pronounced planar jet that penetrates the opposite wall of the connecting structure (t = 220 μs). A distinguishable migration of the bubble towards the endwall of the channel is observed during the second oscillation period of the bubble.
At an even smaller  ${\gamma _h}$ value (
 ${\gamma _h} = 1.39 \pm 0.07$, figure 4c), the formation of a planar jet during bubble collapse is the main feature of the interaction (Brujan et al. Reference Brujan, Takahira and Ogasawara2019). The planar jet is so strong that it leads to a significant migration of the bubble towards the endwall of the channel even if the upper and lower extremities of the bubble are in contact with the sidewalls of the channel (see the frames corresponding to t > 240 μs). Notably, the planar jet does not extend over the entire height of the bubble, as two small lobes are clearly visible at the extremities of the bubble around its minimum volume (see the frame taken at t = 220 μs).
The most interesting feature of the bubble dynamics at this particular β value is the formation of several counterjet-like structures during bubble rebound. They were first found when the bubble collapses near a flat rigid wall (see, for example, Vogel, Lauterborn & Timm Reference Vogel, Lauterborn and Timm1989; Lindau & Lauterborn Reference Lindau and Lauterborn2003), and more recently in the case of a bubble collapsing in a right-angled corner (Brujan et al. Reference Brujan, Noda, Ishigami, Ogasawara and Takahira2018), as a structure that grows in the opposite direction to the liquid jet piercing the bubble. They become visible in a very early stage of the bubble rebound and persist for a long time. Two inclined counterjet-like structures (indicated by the black arrows in figure 4b at t = 220 μs), situated in close proximity to the upper and lower lobes of the bubble, respectively, are clearly seen at  ${\gamma _h} = 5.06 \pm 0.18$, for t > 210 μs. The inclination of the upper structure remains constant in time, but the lower structure seems to change its direction. Actually, this is just an artefact, as some microbubbles start to expand in close proximity to the lower structure (for t > 230 μs), giving the impression that it becomes inclined backwards. Three counterjet-like structures (indicated by the black arrows in figure 4c at t = 230 μs) are visible during the rebound phase of the bubble situated at
 ${\gamma _h} = 1.39 \pm 0.07$. All these structures appear to be almost parallel to the sidewalls of the channel and have a much weaker contrast. A weak inclined counterjet-like structure, emanating from the cavity situated close to the lower sidewall of the channel in the rebound phase, can also be seen at
 ${\gamma _h} = 11.58 \pm 0.35$ (figure 4a, t > 230 μs). Note that for β ≈ 0.85, where the bubble touches the sidewalls of the channel early in the collapse phase, the counterjet-like structures do not occur.
3.1.3. Bubble behaviour for β ≈ 2
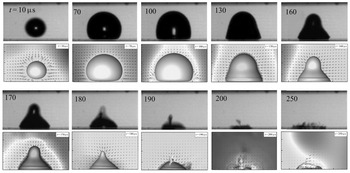
At this large β value, the influence of the sidewalls of the channel on the bubble dynamics becomes smaller. Two examples of the bubble behaviour at this large β value are shown in figure 5(a), for  ${\gamma _h} = 5.33 \pm 0.14$, and in figure 5(b), for
 ${\gamma _h} = 1.85 \pm 0.07$, respectively. In both cases, the influence of the sidewalls of the channel is not large enough to cause the bubble to flatten and transform into an oblate spheroid that would result in an annular jet. The dominant feature of the interaction is a flow directed towards the endwall of the channel, leading to the flattening of the bubble wall opposite to the endwall of the channel – clearly visible at t = 190 μs in figure 5(a) and at t = 180 μs in figure 5(b) – and to the formation of a liquid jet that pierces the bubble at its central part. The jet protrudes into the opposite bubble wall and, for
 ${\gamma _h} = 1.85$, it impacts onto the endwall of the channel (figure 5b, t > 250 μs) with a velocity of 16 ± 3 m s−1. The protrusion made by this jet is indicated by the black arrow at t = 230 μs in figure 5(a) and is also visible for t > 220 μs in figure 5(b). For
 ${\gamma _h} = 1.85$, a counterjet-like structure occurs in a direction opposite to the liquid jet (figure 5b, t > 190 μs). No such structure was observed for
 ${\gamma _h} > 4.5$. Interestingly, two additional protrusions, also directed towards the endwall of the channel – indicated by the white arrows in figure 5(a) at t = 210 μs, and also seen in figure 5(b) at t = 200 μs – occur in a very early stage of the bubble rebound. Later in the rebound phase, they are deviated in an oblique direction (figure 5a, t > 220 μs) or completely covered (figure 5b, t > 220 μs) by the central protrusion. The bubble motion is accompanied by a strong migration towards the endwall of the channel.
Dynamics of a cavitation bubble generated at equal distance from the sidewalls of a rectangular channel for β ≈ 2 (side view): (a) Rmax = 1070 ± 24 μm, γh = 5.33 ± 0.14, sv/H = 0.5 ± 0.01 (γv = 1.87 ± 0.06), β = 1.87 ± 0.06; and (b) Rmax = 920 ± 24 μm, γh = 1.85 ± 0.07, sv/H = 0.5 ± 0.01 (γv = 2.17 ± 0.07), β = 2.17 ± 0.06. The sidewalls of the channel are outside of the photographic frames. The gap height between the two parallel rigid walls is H = 4 mm. Frame width 3.4 mm.

3.2. Bubbles generated closer to the lower sidewall of the channel
Unfortunately, for very large laser pulse energies, necessary for generating cavitation bubbles with a maximum radius Rmax ≈ 1 mm (corresponding to β ≈ 0.85), it was not possible to focus the laser beam closer to one of the sidewalls of the channel using the present experimental set-up. Therefore, we restricted our investigations only to β > 1. We present several high-speed photographic sequences illustrating the behaviour of the bubble generated slightly away from the central part of the channel  $({s_v}/H \approx 0.44)$ and very close to the lower sidewall of the channel
 $({s_v}/H \approx 0.29)$. The results are displayed for two values of the parameter β, namely β ≈ 1.1 and β ≈ 2, respectively.
3.2.1. Bubble behaviour for β ≈ 1.1
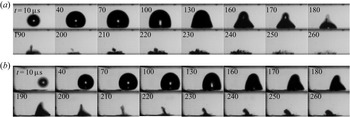
Figure 6 shows the jetting behaviour of the bubble for  ${s_v}/H \approx 0.44$. For large
 ${\gamma _h}$ values, the annular jet leads to the formation of unequal bubble lobes. At
 ${\gamma _h} = 9.04 \pm 0.31$ (figure 6a), the annular flow from the bubble sides results in bubble splitting, with the smaller part of the bubble migrating towards the upper sidewall of the channel. An inclined counterjet-like structure develops in close proximity to the upper cavity during its rebound (t > 200 μs). A planar jet towards the endwall of the channel also develops but it is too weak to protrude into the opposite side of the structure connecting the bubble lobes during the first collapse phase (t = 190 μs).
Dynamics of a cavitation bubble situated closer to the lower sidewall of a rectangular channel for sv/H ≈ 0.44 and β ≈ 1.1 (side view): (a) Rmax = 770 ± 24 μm, γh = 9.04 ± 0.31, sv/H = 0.44 ± 0.02 (γv = 0.97 ± 0.05), β = 1.1 ± 0.04; (b) Rmax = 740 ± 24 μm, γh = 5.55 ± 0.24, sv/H = 0.43 ± 0.02 (γv = 0.99 ± 0.05), β = 1.15 ± 0.04; and (c) Rmax = 700 ± 24 μm, γh = 2.17 ± 0.09, sv/H = 0.44 ± 0.02 (γv = 1.07 ± 0.05), β = 1.22 ± 0.04. The gap height between the two parallel rigid walls is H = 1.7 mm. Frame width 2.9 mm. Panel (c) is adapted from Brujan et al. (Reference Brujan, Takahira and Ogasawara2019).

In figure 6(b) the bubble is generated closer to the endwall of the channel, corresponding to  ${\gamma _h} = 5.55 \pm 0.24$. The intensity of the planar jet increases and the protrusion caused by this jet is already visible several microseconds before collapse (see the frame taken at t = 200 μs). The upper cavity migrates obliquely towards the nearby sidewall of the channel. The oblique displacement is clearly seen in the shadow of the bubble caused by the relatively long exposure time of the frame corresponding to t = 200 μs. In the rebound phase, counterjet-like structures can be seen emanating from both the upper and the lower lobes of the bubble.
When the bubble is generated even closer to the endwall of the channel ( ${\gamma _h} = 2.17 \pm 0.09$, figure 6c), the formation of a planar jet that is slightly inclined towards the lower sidewall is the main feature of the bubble dynamics. The planar jet penetrates the opposite wall of the rebounding bubble (t = 220 μs) and, again, two counterjet-like structures occur near the upper and the lower extremities of the bubble. In a late rebound stage, (t > 230 μs), as a consequence of the oblique bubble migration, the lower part of the bubble touches the nearby sidewall of the channel.
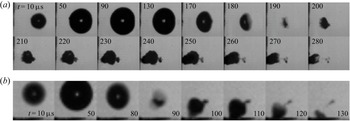
For  ${s_v}/H \approx 0.29$ (figure 7), the annular flow strength is not sufficient to cause splitting of the bubble. Nevertheless, the asymmetric annular flow still leads to a constriction at the bubble polar region on the far side opposite to the lower sidewall of the channel. For large
 ${\gamma _h}$ values (figure 7a,
 ${\gamma _h} = 8.73 \pm 0.28$), the constriction disappears during the rebound phase of the bubble. At small
 ${\gamma _h}$ values (figure 7b,
 ${\gamma _h} = 2.81 \pm 0.1$), it persists for a long time during bubble rebound, eventually inclining towards the endwall of the channel. For the latter case, the migration of the bubble along the lower sidewall towards the endwall of the channel, together with the faster collapse of the bubble side situated on the right-hand side of the constriction (see the frame taken at t = 190 μs), may suggest the formation of an inclined liquid jet during the final stage of bubble collapse. However, the opaqueness of the bubble prevents the visualization of this jet. We also note that counterjet-like structures are not generated during the rebound phase of the bubble, regardless of the value of the dimensionless distance between the bubble and the endwall of the channel,
 ${\gamma _h}$.
Dynamics of a cavitation bubble situated closer to the lower sidewall of a rectangular channel for sv/H ≈ 0.29 and β ≈ 1.05 (side view): (a) Rmax = 820 ± 24 μm, γh = 8.73 ± 0.28, sv/H = 0.28 ± 0.01 (γv = 0.58 ± 0.04), β = 1.04 ± 0.03; and (b) Rmax = 800 ± 24 μm, γh = 2.81 ± 0.1, sv/H = 0.3 ± 0.01 (γv = 0.64 ± 0.04), β = 1.06 ± 0.03. The gap height between the two parallel rigid walls is H = 1.7 mm. Frame width 2.9 mm.

3.2.2. Bubble behaviour for β ≈ 2
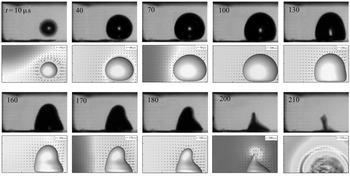
At this large β value, no annular jet occurs, and only an inclined liquid jet is formed during bubble collapse. When the bubble is generated close to the central part of the channel ( ${s_v}/H = 0.45 \pm 0.01$, figure 8a), a broad jet develops during bubble collapse. The jet is strong enough to penetrate the opposite bubble side (t = 200 μs) and to impact the endwall of the channel during bubble rebound (t > 250 μs) with a velocity of 15 ± 3 m s−1. The inclination of this jet is difficult to measure. The bubble inclination at its minimum volume (t = 190 μs) is 7° with respect to a vertical plane, suggesting that the jet is inclined at the same angle with respect to the lower sidewall of the channel. However, just before the impact onto the endwall of the channel (t = 230 μs), the corresponding inclination of the jet increases to about 25°. Note also the strong migration of the bubble towards the endwall of the channel and the occurrence of a counterjet-like structure in the rebound phase of the bubble.
Dynamics of a cavitation bubble situated closer to the lower sidewall of a rectangular channel for β ≈ 2 (side view). (a) For Rmax = 990 ± 24 μm, γh = 1.95 ± 0.06, sv/H = 0.45 ± 0.01 (γv = 1.82 ± 0.06) and β = 2.02 ± 0.05. The distance between the parallel rigid walls is H = 4 mm. Frame width 3.15 mm. (b) For Rmax = 390 ± 24 μm, γh = 1.95 ± 0.15, sv/H = 0.3 ± 0.01 (γv = 1.31 ± 0.12) and β = 2.18 ± 0.14. The gap height between the two parallel rigid walls is H = 1.7 mm. Frame width 0.98 mm.

A bubble generated close to the lower sidewall ( ${s_v}/H = 0.3 \pm 0.01$, figure 8b) develops a thinner jet during collapse and a counterjet-like structure during bubble rebound (t > 100 μs). The bubble migrates mostly towards the lower sidewall of the channel and the jet impacts the nearby wall during bubble rebound. As in the previous example, the liquid jet piercing the bubble and the structure growing in the opposite direction are not collinear. A similar observation has been made in the case of bubbles collapsing near two perpendicular rigid walls (Brujan et al. Reference Brujan, Noda, Ishigami, Ogasawara and Takahira2018), where it was found that the jet is continuously changing its direction during bubble collapse and rebound.
3.3. Jets and counterjet-like structures
The high-speed sequences illustrated in the previous sections show several counterjet-like structures occurring during bubble rebound. They have been mainly observed when the bubble is generated at, or very close to, the central portion of the channel. When the bubble develops an annular jet during collapse, these structures emanate from the upper and lower bubble lobes (see figures 4a,b and 6a,b). When the bubble is generated close to the endwall of the channel, three counterjet-like structures are initiated around the central part of the bubble and close to the upper and lower bubble parts (see figures 4c and 6c). No such structures were observed when the bubble is initiated very close to a sidewall of the channel (see figure 7).
Most of the current understanding on the behaviour of counterjet-like structures comes from the case where the bubble is generated near a flat rigid wall (Vogel et al. Reference Vogel, Lauterborn and Timm1989; Lindau & Lauterborn Reference Lindau and Lauterborn2003; Lechner et al. Reference Lechner, Koch, Lauterborn and Mettin2017). It was observed that such a structure occurs in a relatively small interval of the distance from the bubble to the rigid wall. When the initiation location of the bubble is in the proximity of the wall and the bubble comes into contact with the wall during expansion, no counterjet-like structure arises. No structure is found when the bubble is generated far from the rigid wall, typically at a distance larger than three times the maximum bubble radius. Although the mechanism by which the counterjet-like structure is formed is not clearly established, there is strong evidence that its formation is coupled with the impact of the re-entrant liquid jet on the opposite bubble side (Lindau & Lauterborn Reference Lindau and Lauterborn2003; Lechner et al. Reference Lechner, Koch, Lauterborn and Mettin2017; Brujan et al. Reference Brujan, Noda, Ishigami, Ogasawara and Takahira2018). The question we want to address here is whether the counterjet-like structures seen in the case of a bubble collapsing in a rectangular channel can be linked to the formation of liquid jets. Several examples of the bubble behaviour that will assist in evaluating the connection between jets and counterjet-like structures are illustrated in figures 9 and 10.
Representative examples for the occurrence of the jet and the counterjet-like structures for a bubble oscillating in a rectangular channel (side view): (a) Rmax = 760 ± 24 μm, γh = 8.54 ± 0.25, sv/H = 0.39 ± 0.01 (γv = 0.87 ± 0.05), β = 1.12 ± 0.03; and (b) Rmax = 670 ± 24 μm, γh = 12.53 ± 0.43, sv/H = 0.47 ± 0.01 (γv = 1.19 ± 0.05), β = 1.27 ± 0.04. The gap height between the two parallel rigid walls is H = 1.7 mm. Frame width 1.71 mm.

Dynamics of a cavitation bubble situated at equal distance from the sidewalls of a rectangular channel for γh ≈ 3.6 (side view): (a) Rmax = 650 ± 24 μm, γh = 3.75 ± 0.15, sv/H = 0.5 ± 0.01 (γv = 1.31 ± 0.07), β = 1.31 ± 0.05; and (b) Rmax = 550 ± 24 μm, γh = 3.47 ± 0.17, sv/H = 0.5 ± 0.01 (γv = 1.55 ± 0.07), β = 1.55 ± 0.06. The gap height between the two parallel rigid walls is H = 1.7 mm. Frame width 1.73 mm.

Figure 9 illustrates two representative examples of the jetting behaviour of a bubble when a strong annular jet develops during bubble collapse. In the first case, illustrated in figure 9(a), a slightly smaller bubble than the height of the channel (β = 1.12 ± 0.03) is generated closer to the lower sidewall of the channel  $({s_v}/H = 0.39 \pm 0.01)$, and relatively far from its endwall
 $({\gamma _h} = 8.54 \pm 0.25)$. Thus, even in an early stage of the collapse, the lower part of the bubble is in contact with the nearby sidewall of the channel. An almost symmetric annular jet is formed during bubble collapse, which finally separates the upper and lower bubble parts (t > 200 μs). The upper cavity develops an inclined jet during collapse, which protrudes into the opposite cavity side. The protrusion is clearly visible during the cavity rebound (indicated by the white arrow in the frame taken at t = 200 μs). At the same time, a jet develops during the collapse of the lower cavity. The opaqueness of the bubble prevents direct observation of this jet. However, the temporal development of the cavity shape suggests the formation of a jet that is flowing almost perpendicularly towards the lower sidewall of the channel (compare the frames taken at t = 190 μs and t = 200 μs). Although there is clear indication of jet formation inside each cavity, no counterjet-like structure develops. This is probably because the upper cavity is too far from, while the lower cavity is too close to, the corresponding nearby sidewall of the channel for this type of structure to occur. Note that for this particular case a planar jet, directed towards the endwall of the channel, also occurs during the final stage of the bubble collapse (see the frame taken at t = 190 μs).
In the second example, the bubble is generated closer to the central part of the channel and at a large distance from the endwall (figure 9b,  ${s_v}/H = 0.47 \pm 0.01$ and
 ${\gamma _h} = 12.53 \pm 0.43$). In contrast to the previous example, the upper part of the bubble is situated closer to the nearby sidewall of the channel while the lower bubble part is separated by a thin liquid layer from the nearby sidewall. The upper cavity develops a re-entrant inclined jet (indicated by the white arrow in the frame corresponding to t = 160 μs) and, since it is closer to the sidewall, a counterjet-like structure (indicated by the black arrow in the same frame), that is collinear with the liquid jet, emerges in the opposite direction to the re-entrant jet. The structure disintegrates in a later rebound phase and several microbubbles become visible for t > 210 μs. An inclined counterjet-like structure occurs in close proximity to the lower cavity as well (indicated by the downwards arrow in the frame taken at t = 160 μs), even though the protrusion caused by the re-entrant liquid jet on the opposite cavity side is not visible. The dynamical behaviour of the two cavities formed after bubble splitting must be similar and, thus, the formation of a liquid jet piercing the lower cavity is highly probable.
Figure 10 shows the jetting behaviour of a bubble generated at the central part of the channel  $({s_v}/H = 0.5 \pm 0.01)$ and approximately at the same non-dimensional distance from the endwall of the channel
 $({\gamma _h} \approx 3.6)$. During collapse, both bubbles develop a planar jet directed towards the channel endwall. The bubble dynamics in the rebound phase are, nevertheless, different. The larger bubble (figure 10a,
 $\beta = 1.31 \pm 0.05$,
 ${\gamma_h = 3.75 \pm 0.15}$) develops two counterjet-like structures (indicated by the black arrows in the frame taken a t = 170 μs) close to the upper and lower parts of the bubble. In an initial stage of their formation, both structures are slightly inclined with respect to the sidewalls of the channel, the upper one at about 10° and the lower one at about 7° (t = 170 μs). Two protrusions, emerging at the opposite side of the bubble, become clearly visible at t = 190 μs, and in the following frames they increase in size towards the endwall of the channel. Interestingly, each protrusion is almost collinear with the opposed counterjet-like structure. At t = 190 μs, a third protrusion occurs around the central part of the bubble, which is a consequence of the impact of the planar jet on the opposite bubble wall. However, no structure is seen in the opposite direction of this jet. The formation of counterjet-like structures close to the bubble extremities and at the central part of the bubble was also observed for the larger bubble illustrated in figure 4(c) when β = 1.18 ± 0.07. In this case, the bubble was generated closer to the endwall of the channel
 $({\gamma _h} = 1.39 \pm 0.07)$ and the impact velocity of the planar jet on the opposite bubble side is most likely strong enough to induce the occurrence of the central structure.
The smaller bubble, shown in figure 10(b) ( $\beta = 1.55 \pm 0.06$,
 ${\gamma _h} = 3.47 \pm 0.17$), develops two protrusions close to the bubble extremities as well (t > 140 μs). However, they are much shorter and thinner and no counterjet-like structures are visible on the opposite side of the bubble. A central structure (indicated by the black arrow at t = 160 μs) occurs in the rebound phase, which is a consequence of the impact of a central jet on the opposite wall of the bubble. This case is very similar to that illustrated in figure 5(b) for β = 2.17 ± 0.06 and
 ${\gamma _h} = 1.85 \pm 0.07$.
3.4. Overview of the jetting behaviour
3.4.1. Jetting behaviour for β ≈ 1.1
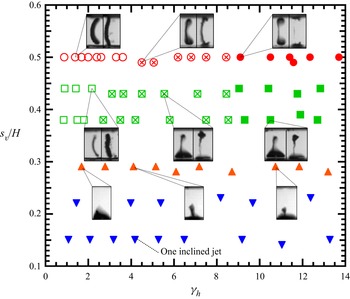
Figure 11 summarizes the jetting behaviour of the bubble for the case where the bubble is slightly smaller than the height of the channel (β ≈ 1.1). Several photographic frames depicting the bubble shape during collapse and rebound (for  ${s_v}/H > 0.38$), or just during collapse (for
 ${s_v}/H \approx 0.29$), corresponding to several particular initial positions of the bubble inside the channel, are also included in figure 11. This case is the most interesting, as the bubble dynamics has the richest structure. A bubble generated in the middle of the channel
 $({s_v}/H = 0.5)$ and far from the endwall
 $({\gamma _h} > 9)$ develops an asymmetric annular jet during collapse. Consequently, the bubble develops two lobes, which oscillate in direct contact with the sidewalls of the channel. Each lobe develops an inclined jet directed towards the nearby sidewall, as indicated by the occurrence of the counterjet-like structures. It should be noted here that, in the limit
 ${\gamma _h} \to \infty $, the annular flow becomes symmetric, and each lobe is pierced by a high-speed liquid jet moving perpendicularly towards the sidewalls of the channel (see, for example, Zeng, Gonzalez-Avila & Ohl Reference Zeng, Gonzalez-Avila and Ohl2020). A weak annular flow is also created, which is manifested mostly during bubble rebound. For
 ${\gamma _h} < 4$, the dominant dynamical feature is the formation of a planar jet towards the endwall of the channel. The planar jet does not extend over the entire height of the bubble, and the bubble forms two tiny lobes at its extremities. The occurrence of counterjet-like structures near the bubble extremities indicates that a liquid jet, that is almost parallel to the channel sidewalls, is formed inside each lobe. A counterjet-like structure emerges from the central part of the bubble, most likely as a consequence of the planar jet impact on the distal side of the bubble. In the intermediate region
 $(4 < {\gamma _h} < 9)$, both a planar jet, directed towards the endwall of the channel, and two inclined jets, flowing towards the channel sidewalls, are formed. The planar jet is strong enough to protrude into the opposite bubble wall, but the occurrence of a counterjet-like structure around the central part of the bubble was not observed.
Jetting behaviour of a laser-induced cavitation bubble in a rectangular channel for β ≈ 1.1. The shapes of the bubble, just before and after the first collapse, are also shown for some initial positions of the bubble inside the channel. Filled symbols: formation of an annular jet. Open symbols with a cross: formation of an annular jet and a planar jet directed towards the end of the channel that penetrates the distal side of the bubble. Open symbols: formation of a planar jet directed towards the end of the channel. Upward-pointing triangles: formation of an annular jet and an inclined jet directed towards the nearby sidewall of the channel. Downward-pointing triangles: formation of an inclined jet directed towards the nearby sidewall of the channel.

In the range  $0.3 < {s_v}/H < 0.48$, for
 ${\gamma _h} > 2.5$, the annular jet leads to bubble splitting and the formation of two unequal cavities, which migrate in opposite directions towards the sidewalls of the channel. Each cavity is pierced by an oblique jet and, at the upper limit of this interval, a counterjet-like structure emerges from the upper cavity. The formation of this structure is not very reproducible for
 ${s_v}/H \approx 0.43$, probably because the impact of the re-entrant liquid jet on the opposite cavity side is too weak. The formation of counterjet-like structures is thus a threshold phenomenon. This produces a certain irregularity of its formation for those
 ${s_v}/H$ values where the values of the impact velocity of the liquid jet are close to the threshold value. For
 ${s_v}/H < 0.4$, the counterjet-like structure emanating from the upper cavity was not observed. When the bubble is generated very close to the endwall of the channel
 $({\gamma _h} < 2.5)$, an inclined planar jet is formed in the final collapse stage, and the bubble develops two tiny lobes at its extremities. Counterjet-like structures emerge at the bubble extremities and around the central part of the bubble.
With further decrease of the distance between the bubble and the lower sidewall of the channel, the annular jet becomes weaker. At  ${s_v}/H \approx 0.29$, it leads to a necking of the bubble at its upper part, without splitting the bubble. At even smaller values
 $({s_v}/H < 0.23)$, the influence of the upper sidewall of the channel is negligibly small. Only an inclined jet is formed and the bubble migrates towards the endwall of the channel, as if it were generated near two perpendicular rigid walls (Brujan et al. Reference Brujan, Noda, Ishigami, Ogasawara and Takahira2018). In all these cases, no counterjet-like structure develops during bubble rebound.
3.4.2. Jetting behaviour for β ≈ 2
When the bubble is much smaller than the height of the channel, corresponding to β ≈ 2 (figure not included), the endwall of the channel has the largest influence on the jetting behaviour. At  ${s_v}/H = 0.5$, the dominant feature of the bubble dynamics is the formation of a liquid jet, at the middle part of the bubble, which moves perpendicularly towards the endwall of the channel. For
 ${\gamma _h} < 5$, a counterjet-like structure occurs in the opposite direction to this jet. We note, however, that, besides this main jet, two protrusions develop at the bubble extremities in an early stage of the bubble rebound (see figure 5) but they are destroyed, in a later rebound phase, by the main jet. For
 ${s_v}/H < 0.5$, the jet becomes inclined. An attempt was made to depict the jet inclination as a function of the initial position of the bubble inside the channel. The temporal resolution used in the present experiment (10 μs) is, however, too low to clearly visualize the jet inclination for such small bubbles.
3.5. Bubble migration
3.5.1. Bubbles generated at equal distance from the channel sidewalls $({s_v}/H \approx 0.5)$

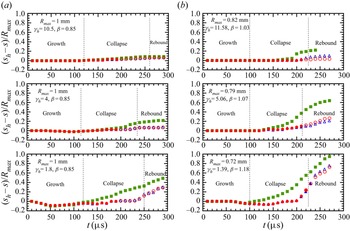
The motion of the central, upper and lower parts of the bubble towards the endwall of the channel as a function of time is illustrated in figure 12, corresponding to the photographic sequences shown in figures 3 and 4, respectively. The bubble displacement is quantified by the dimensionless distance,  $({s_h} - s)/{R_{max}}$, where s is the distance between the endwall of the channel and the middle of the corresponding bubble part (see the supplementary material, file 1). The open symbols indicate that the upper and lower parts of the bubble are in contact with the sidewalls of the channel. For β ≈ 0.85 (figure 12a), the bubble extremities touches the sidewalls of the channel in an early collapse stage. For the smaller bubble (β ≈ 1.1, figure 12b), a direct contact of the bubble with the sidewalls of the channel is observed only during the rebound phase. In both cases, the bubble extremities are almost motionless during most of the first oscillation period, irrespective of the initial position of the bubble inside the channel. It is only in the final collapse stage that the bubble extremities start to migrate significantly towards the endwall of the channel. The migration continues during the rebound phase even though the upper and lower bubble parts are in contact with the channel sidewalls. This situation is more clearly visible when the bubble is generated very close to the endwall of the channel, but it can also be noticed for the smaller bubble (β = 1.07 ± 0.03) at a larger
 ${\gamma _h}$ value
 $({\gamma _h} = 5.06 \pm 0.18)$ (see figure 12a, middle plot).
Motion of the upper (triangles), central (squares) and lower (circles) parts of a bubble, generated at sv/H = 0.5, towards the end of a rectangular channel for (a) β = 0.85 and (b) β ≈ 1.1 (corresponding to the photographic sequences shown in figures 3 and 4, respectively). The distance s was measured from the endwall of the channel up to the middle of the corresponding bubble part. The open symbols indicate that the upper and lower poles are in contact with the sidewalls of the channel. The experimental errors are smaller than the size of the symbols.

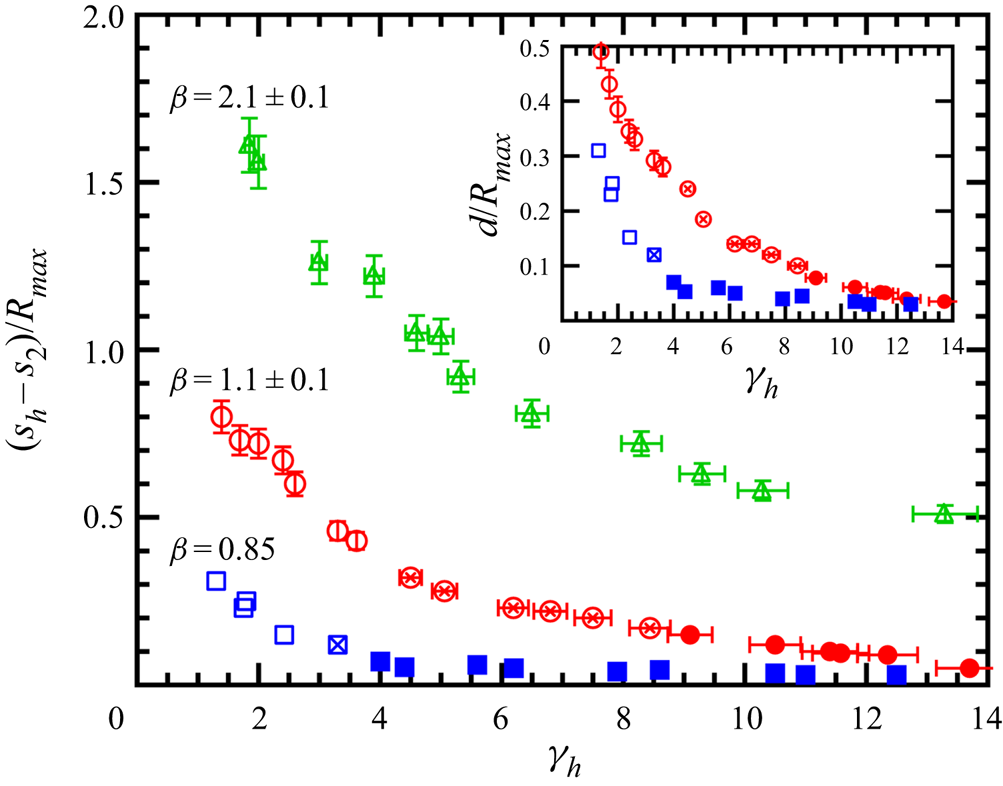
The influence of the relative size of the bubble with respect to the height of the channel, β, on the distance,  $({s_h} - {s_2})/{R_{max}}$, travelled by the bubble extremities towards the endwall of the channel during two oscillation periods is shown in figure 13. Here,
 ${s_2}$ is the distance between the endwall of the channel and the middle of the bubble extremities at the end of the second oscillation period of the bubble. The inset plot shows the normalized distance travelled by the bubble extremities in contact with the sidewalls of the channel, d/Rmax. The bubble migration increases with decreasing initial position of the bubble from the endwall of the channel. The largest migration occurs for β ≈ 2, where there is no contact between the bubble extremities and the channel sidewalls. For
 ${\gamma _h} = 1.85 \pm 0.07$, it amounts to 1480 ± 110 μm (as d/Rmax = 1.61 ± 0.08 and Rmax = 920 ± 24 μm, see figure 5b). For β ≈ 1.1 and β ≈ 0.85, a significant migration occurs when the planar jet becomes dominant, a major proportion of it being with the bubble extremities in contact with the sidewalls of the channel. For β = 1.18 ± 0.04 and
 ${\gamma _h} = 1.39 \pm 0.07$, the distance travelled by the bubble in contact with the channel sidewalls is 350 ± 35 μm (as d/Rmax = 0.49 ± 0.03 and
 ${R_{max}} = 720 \pm 24\;\mathrm{\mu }\textrm{m}$).
Normalized distance travelled by the bubble extremities towards the endwall of a rectangular channel, during two oscillation periods,  $({s_h}{-}{s_2})/{R_{max}}$, and three values of the β parameter. The inset shows the corresponding normalized distance, d/Rmax, travelled by the bubble in contact with the sidewalls of the channel. The bubbles are generated in the middle of the channel height (sv/H = 0.5). Filled symbols: formation of an annular jet. Open symbols with a cross: formation of an annular jet and a planar jet directed towards the endwall of the channel that penetrates the distal side of the bubble. Open symbols: formation of a planar jet directed towards the endwall of the channel. Where no error bars appear, the experimental error is smaller than the symbol itself.

3.5.2. Bubbles generated closer to the lower sidewall of the channel
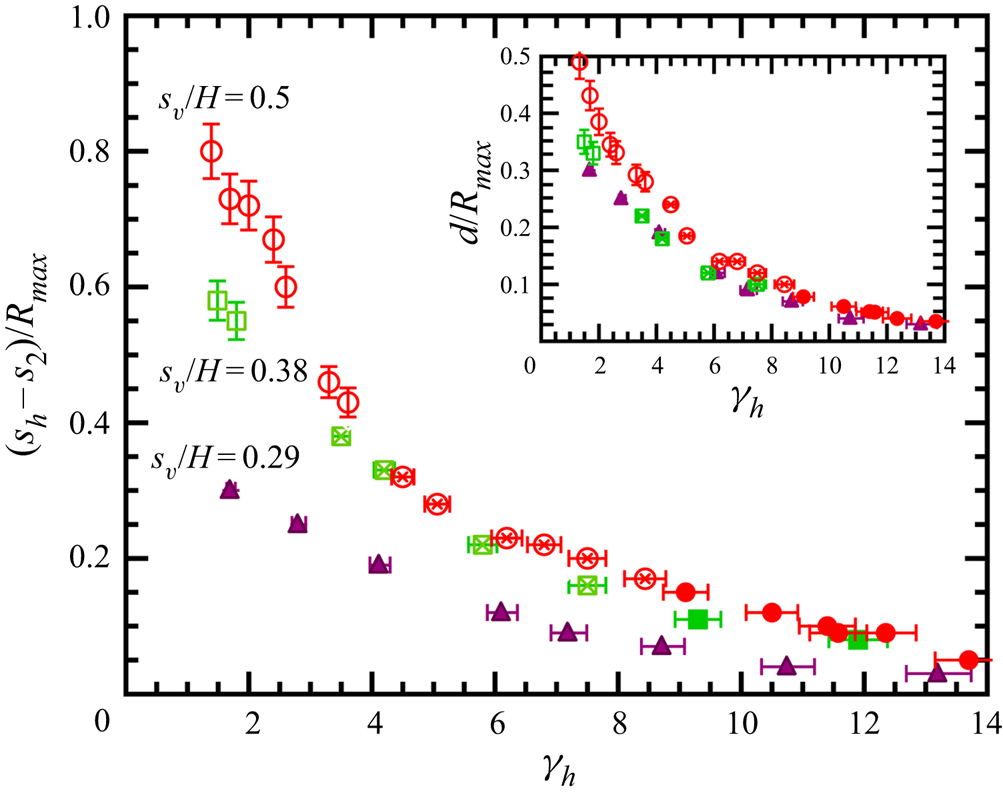
Figure 14 shows the influence of the initial position of the bubble inside the channel on the bubble migration for β ≈ 1.1. Only the displacement of the lower part of the bubble is shown in figure 14. In this choice we have been guided by the observation that, for small  ${s_v}/H$ values (such as
 ${s_v}/H \approx 0.29$, figure 7), the bubble interacts only with the lower sidewall of the channel. We note, however, that in the range
 $0.48 < {s_v}/H < 0.3$, for
 ${\gamma _h} > 2.5$, the annular jet leads to bubble splitting and the formation of two unequal cavities. The upper cavity migrates in an oblique direction towards the upper sidewall of the channel, but its displacement along this wall is smaller than that of the lower cavity on the opposite channel wall. An example is shown in figure 9(a)
 $({s_v/H = 0.39 \pm 0.01},\;{\gamma_h = 8.54 \pm 0.25})$, where the lower cavity moves about 20 μm along the nearby sidewall of the channel during the time interval covered by the photographic sequence (90 μs), while the upper cavity touches the channel sidewall only in the last frame of the photographic sequence (corresponding to t = 260 μs).
Normalized distance travelled by the lower extremity of the bubble towards the end of a rectangular channel, during two oscillation periods,  $({s_h}{-}{s_2})/{R_{max}}$, for various initial locations of the bubble in a rectangular channel, sv/H. The inset shows the corresponding normalized distance, d/Rmax, travelled by the bubble in contact with the lower sidewall of the channel. The normalized maximum bubble radius with respect to the channel height is β = 1.1 ± 0.1. Filled symbols: formation of an annular jet. Open symbols with a cross: formation of an annular jet and a jet directed towards the end of the channel that penetrates the distal side of the bubble. Open symbols: formation of a jet towards the end of the channel. Where no error bars appear, the experimental error is smaller than the symbol itself.

The displacement of the lower part of the bubble towards the endwall of the channel decreases with the initial distance between the bubble and lower sidewall. Significant differences are found for  ${\gamma _h} < 4$. Notably, for
 ${s_v}/H = 0.3 \pm 0.01$, the bubble displacement along the channel sidewall reaches very high values, with a maximum value of about 240 ± 24 μm (d/Rmax = 0.3 ± 0.02 and Rmax = 800 ± 24 μm) measured at
 ${\gamma_h = 1.71 \pm 0.07}$.
This section can be concluded by noting that, at β ≈ 2, the bubble touches the lower sidewall of the channel during its first two oscillation cycles only for  ${s_v}/H < 0.35$. However, the displacement of the bubble along the wall is small. For the case illustrated in figure 8(b), the bubble moves about 5 μm in contact with the wall. Even for smaller
 ${s_v}/H$ values, there is no significant increase in the bubble displacement towards the endwall of the channel. For example, for
 ${s_v}/H = 0.15 \pm 0.01$ and
 ${\gamma _h} = 2.1 \pm 0.07$ (figure not included), the bubble moves only 40 ± 4 μm in contact with the lower sidewall of the channel.
4. Numerical simulations
To better understand the jetting behaviour of the bubble, we present in this section some particular cases where the bubble dynamics cannot be easily discerned from experiments. We illustrate the temporal development of the bubble shape, the pressure distribution and the velocity vectors in the liquid surrounding the bubble during bubble oscillation. Subsequently, other interesting variables are obtained, such the direction and the velocity of the liquid jets formed during bubble collapse. The bubble is depicted in both 3-D view and, as in the experiment, in side view, and is transparent in order to visualize the formation of the liquid jet(s). The endwall of the channel is situated at x = 0 and the plane z = 0 is situated at equal distance from the channel sidewalls (see figure 2). The pressure distribution and the velocity vectors are illustrated for y = 0. A side-by-side comparison between experiment and simulation is shown in the Appendix.
As a general comment, we note that the present simulations overpredict the bubble volume during rebound. In the simulations the bubble contains only non-condensable gas, while in experiments it contains both non-condensable gas and vapour. The presence of the vapour inside the bubble and the non-equilibrium evaporation and condensation at the bubble interface lead to a reduction of the bubble volume during rebound, as shown by Fujikawa & Akamatsu (Reference Fujikawa and Akamatsu1980) in the case of spherical bubbles. A larger bubble volume in the rebound phase was also observed by Zeng et al. (Reference Zeng, Gonzalez-Avila, Dijkink, Koukouvinis, Gavaises and Ohl2018) for a gas bubble collapsing near a rigid wall, and later by Zeng et al. (Reference Zeng, Gonzalez-Avila and Ohl2020) in the case of a gas bubble collapsing between two parallel rigid walls. An increase of the polytropic exponent of the gas inside the bubble was performed to match the simulations with the experimental results. However, in the absence of a mathematical model that includes the effect of the non-equilibrium evaporation and condensation at the interface of a non-spherical bubble, we used a constant value of the polytropic index in the present simulations. Consequently, the bubble volume during rebound deviates from that observed in experiment. Nevertheless, the main dynamical features of the bubble oscillation are very well reproduced in the present simulations. Overall, the agreement between the numerical results and the experiments is reasonably good despite the fact that, in the simulations, the bubble is filled with only non-condensable gas and the amount of gas remains constant over time.
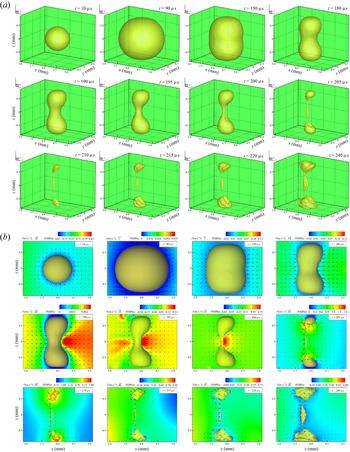
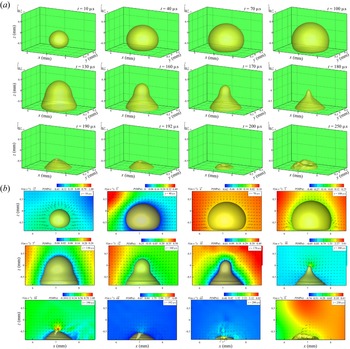
Figure 15 illustrates the bubble dynamics for β = 1.08,  ${\gamma _h} = 5.06$ and sv/H = 0.49, corresponding to the case shown in figure 4(b). This case is particularly interesting, as the photographic sequence suggests the formation of three jets during bubble collapse. As in the experiment, the bubble achieves an oblate shape around the maximum expansion (t = 90 μs) followed by the formation of an asymmetric annular flow (t > 180 μs). At the same time, the bubble flattens in the y direction. A high-pressure region develops at the bubble side opposite to the endwall of the channel that progressively transforms into an asymmetric torus ring of high pressure (t = 200 μs). At z = 0, the maximum pressure near the bubble side opposite to the endwall is 0.75 MPa and decreases to about 0.6 MPa near the bubble side facing the endwall. At t = 200 μs, the planar jet is already visible inside the bubble. The snapshots taken at t = 205 μs depict the occurrence of inclined jets inside each bubble lobe, which have impacted the opposite side of the lobes. Both jets have a wedge-like shape (clearly visible in figure 15a for t > 210 μs), with a base thickness (in the y direction) w = 30 μm, similar to that of the planar jet directed towards the endwall of the channel. The maximum velocity of the jet piercing the upper lobe is 68 m s−1, while the maximum velocity of the lower jet is 76 m s−1. Both values are obtained just before the jets impact the distal side of the lobes. A peak pressure develops near the impacted surface of each lobe. For the upper lobe, the value of the peak pressure is 1.8 MPa, while the corresponding value for the lower lobe is 1.3 MPa. At t = 210 μs, the bubble is near the minimum volume and starts to rebound. The simulation also indicates that the jets formed inside the bubble lobes change their inclination during rebound. In the snapshots obtained at t = 205 μs, the inclination of the upper jet is 60° while that of the lower lobe is 55°, in qualitative agreement to the experimental result (80° and 55°, respectively). The corresponding values at t = 240 μs are 39° for the upper jet and 36° for the lower jet. A similar change in the jet direction was observed in the case of a bubble collapsing near two perpendicular rigid walls (Brujan et al. Reference Brujan, Noda, Ishigami, Ogasawara and Takahira2018).
Bubble shape in 3-D view (a) and snapshots of the fluid (b) for Rmax = 790 μm, γh = 5.06, sv/H = 0.49 (γv = 1.06), β = 1.08, corresponding to the experimental result shown in figure 4(b). The initial parameters used in the numerical simulation are R 0 = 135 μm and p 0 = 107 N m−2.

Although the agreement between the simulation and the experiment is good, there are some discrepancies in the bubble behaviour at the late collapse stage. First, the simulation does not reproduce the arcuate shape of the structure connecting the upper and lower lobes of the bubble. Secondly, the experimental result shows a sudden elongation of the bubble towards the sidewalls of the channel around the minimum bubble volume (figure 4b, t = 210 μs). In the simulations, the bubble elongates much more slowly in the vertical direction and the bubble extremities touch the sidewalls of the channel about 30 μs after the bubble reaches its minimum volume (t = 240 μs). The reason for these discrepancies is unclear; they might be caused by the different bubble contents in the experiment (gas and vapour) and in the simulation (gas), leading to a slightly different behaviour of the bubble in a very late stage of the collapse.
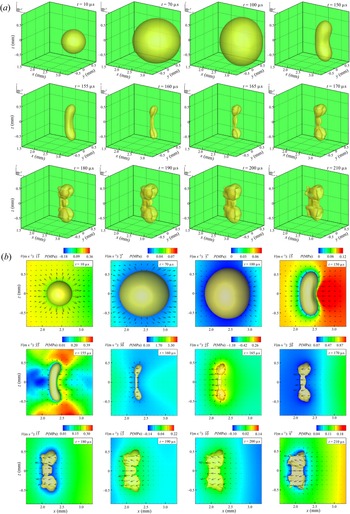
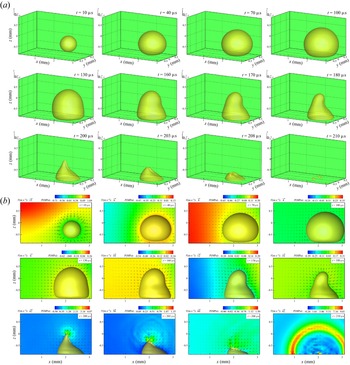
Figure 16, obtained for β = 1.31,  ${\gamma _h} = 3.75$ and sv/H = 0.5, simulates the experimental result shown in figure 10(a). The experiment shows that the annular flow is not developed during bubble collapse but counterjet-like structures are still formed in close proximity to the bubble extremities. Early in the collapse the bubble starts to migrate slowly towards the endwall of the channel. Then, its translational motion progressively accelerates during the collapse, driven by a high-pressure region that occurs in the liquid near the bubble side furthermost from the endwall of the channel (t = 150 μs). As the collapse proceeds, the bubble achieves a crescent shape (t = 155 μs) and a planar jet develops inside the bubble. At t = 160 μs, the planar jet impacts the distal side of the bubble and the bubble shape consists of two lobes connected by a structure that is pierced by the planar jet. Note that, at this time instant, the bubble shape is very well reproduced in the simulations. A slightly inclined jet is formed inside each lobe (t = 165 μs), which, later in the rebound phase, produces the protrusion seen in the experiment (figure 10a, t > 180 μs). As in the previous case, the bubble flattens in the y direction and both the upper and lower jets have a wedge-like shape with a thickness w = 45 μm. The extension velocity of the protrusions caused by these jets, mediated between t = 180 μs and t = 190 μs, is 12 m s−1, similar to the experimental result (16 ± 4 m s−1, mediated between frames 5 and 6 of figure 10a). At t = 165 μs, the inclination of these jets is 8°, consistent with the experimental observation for the inclination of the counterjet-like structures. The maximum velocity of the planar jet, determined at z = 0, is 55 m s−1 and decreases to 25 m s−1 after its impact onto the opposite side of the bubble, in good agreement with previous experimental observations (Brujan et al. Reference Brujan, Takahira and Ogasawara2019). On the other hand, the maximum velocity of the jets developed inside the lobes is 45 m s−1. Note that even the experimentally observed significant migration of the bubble during rebound is well captured by the simulation.
Bubble shape in 3-D view (a) and snapshots of the fluid (b) for Rmax = 650 μm, γh = 3.75, sv/H = 0.5 (γv = 1.31), β = 1.31, corresponding to the experimental result shown in figure 10(a). The initial parameters used in the numerical simulation are R 0 = 110 μm and p 0 = 107 N m−2.

Figures 17 and 18 illustrate the bubble dynamics for the cases shown in figures 7(a) and 7(b), respectively. The agreement between the experiment and the simulation is good initially. Note that, for the case illustrated in figure 17, the bubble shape at t = 180 μs is almost identical to the shadow of the bubble shown in figure 7(a) at the same instant of time. However, the present model does not capture accurately the behaviour of the bubble in a very late stage of the collapse. In the experiment, the bubble collapse is characterized by a relatively strong annular flow that leads to a circumferential pitching (as seen in figure 7a for t > 190 μs) or a constriction (figure 7b, t > 210 μs) around the upper part of the bubble. In the simulations, the asymmetric annular flow is well captured for most of the collapse phase but it is not as strong as observed in the experiment. In figure 17, the bubble achieves an almost conical shape in a late collapse stage (t = 180 μs) and an inclined, almost conical jet pierces the bubble flowing towards the lower sidewall of the channel (t > 190 μs) with a velocity of 108 m s−1. In the experiment, the jet velocity may be even larger. Following bubble splitting (figure 7a, t = 180 μs), the asymmetric annular flow is focused from a larger solid angle than in the case simulated in figure 17 at t = 180 μs. This would result in the formation of a thinner jet inside the lower cavity that may be further accelerated by the pressure wave emitted during the collapse of the smaller, upper cavity (see Brujan et al. (Reference Brujan, Nahen, Schmidt and Vogel2001) for a description of this mechanism for splitting bubbles near elastic walls). The jet flow is accompanied by the formation of a high-pressure region near the bubble surface where the jet is formed (figure 17b, t = 180 μs and t = 190 μs), with a maximum amplitude of about 4.5 MPa. For the case illustrated in figure 18, the asymmetric annular flow leads to the formation of a wedge-like jet, with a thickness w = 30 μm, along the upper part of the bubble opposite the endwall of the channel (t = 200 μs). Notably, the formation of this jet can also be inferred from the motion of the experimental bubble shape during the exposure time of the frame taken at t = 200 μs in figure 7(b). However, not later than 3 μs, the bubble apex collapses faster, forming a jet that flows almost perpendicularly towards the sidewall of the channel (t = 208 μs). At later collapse stage and during bubble rebound, the constriction seen in the experiment around the upper part of the bubble is not reproduced in the simulation. Nevertheless, the oscillation time of the bubble (around 210 μs in experiment) is well captured in the simulation (figure 18b, t = 210 μs). One possible explanation for the observed discrepancies is that, in the simulation, the events accompanying the optical breakdown are not taken into account. The pressure amplitude of the shock wave emitted during optical breakdown could be much larger than that simulated by the initial pressure increase inside a relatively large nucleus. For such small sv/H values, the shock wave emitted during optical breakdown is reflected back to the bubble by the nearby sidewall of the channel. This way, besides the opposing Bjerknes attractive forces from the channel sidewalls, the bubble is subjected to a larger, short-lived pressure gradient directed away from the lower sidewall than in the simulation. This pressure gradient may be sufficiently large to induce a slight increase of the intensity of the annular jet, which, in turns, leads to the experimentally observed circumferential pinching of the bubble.
Bubble shape in 3-D view (a) and snapshots of the fluid (b) for Rmax = 820 μm, γh = 8.73, sv/H = 0.28 (γv = 0.58), β = 1.04, corresponding to the experimental result shown in figure 7(a). The initial parameters used in the numerical simulation are R 0 = 140 μm and p 0 = 107 N m−2.

Bubble shape in 3-D view (a) and snapshots of the fluid (b) for Rmax = 800 μm, γh = 2.81, sv/H = 0.3 (γv = 0.64), β = 1.06, corresponding to the experimental result shown in figure 7(b). The initial parameters used in the numerical simulation are R 0 = 137 μm and p 0 = 107 N m−2.

It is worth noting here that using the jet velocity,  ${v_{jet}}$, and width, w, obtained in the numerical results shown in figures 15–18, the Weber number, defined as
 ${\rho _l}v_{jet}^2w{\sigma ^{ - 1}}$, where σ is the surface tension, is in the range 1.3 × 10³ to 5 × 10³. Such large values indicate that surface tension is not expected to play a major role in the jetting dynamics of the bubble, validating our initial assumption of neglecting surface tension in the simulations.
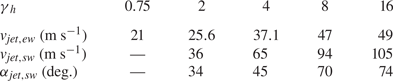
In order to better understand the complex jetting dynamics of bubbles slightly smaller than the height of the channel, tables 1 and 2 show the velocity of the jets developed during bubble collapse and their inclination as a function of the stand-off distance, γh. The results are presented for the case of bubbles generated in the central portion of the channel (sv/H = 0.5, table 1) and very close to the lower sidewall of the channel (sv/H = 0.29, table 2), respectively. For sv/H = 0.5, the velocity and inclination of the jets directed towards the sidewalls of the channel increase with the stand-off distance, γh. Interestingly, the particular case of a bubble collapsing between two parallel rigid walls is not recovered even at γh = 16 – see also figure 4(a) where the asymmetry of the annular jet is still visible at γh = 11.58 ± 0.35. The results obtained for the planar jet overpredict the experiments of Brujan et al. (Reference Brujan, Takahira and Ogasawara2019), who measured jet velocities of up to 27 m s−1 for γh = 7.5, compared to 47 m s−1 in the simulation. We note, however, that in the experiment the jet velocity was measured as the velocity of the bubble side opposite to the endwall of the channel, whereas, in the simulation, it represents the velocity of the jet front inside the bubble. For sv/H = 0.29 and γh = 0.16, both the velocity and inclination of the jet have smaller values, but this is due to the proximity of the bubble to the channel edge.
Velocity, vjet, and inclination, αjet, of the jets developed during the collapse of a bubble generated in the central portion of the channel (sv/H = 0.5), for β = 1.08, as a function of the normalized distance between the bubble and the channel endwall, γh. The subscripts ew and sw denote the jet directed towards the endwall (planar jet) and sidewalls of the channel, respectively. The inclination of the planar jet is αjet,ew = 0°.

Velocity, vjet, and inclination, αjet, of the jet directed towards the lower sidewall of the channel for sv/H = 0.29 and β = 1.05 as a function of the normalized distance between the bubble and the channel endwall, γh.

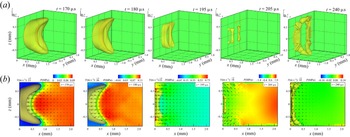
Notably, for γh = 0.75, there is no jetting towards the channel sidewalls. This behaviour is illustrated in figure 19 for sv/H = 0.5. A broad planar jet develops during collapse, which, in a late collapse stage, extends over the entire height of the bubble (t = 195 μs) and prevents the formation of the bubble lobes. Nevertheless, small pockets of gas are still trapped at the bubble extremities. They are expelled from the bubble during collapse, forming an array of microbubbles as seen at t = 205 μs. During rebound, the bubble and the microbubbles grow in size and the assembly takes the form of a crescent (t = 240 μs). This behaviour is extremely difficult to validate experimentally because of limitations in resolution for such small γh values. Nonetheless, the evolution of the bubble is in qualitative agreement with the experimental result reported by Brujan et al. (Reference Brujan, Takahira and Ogasawara2019) for γh = 0.55 ± 0.2, sv/H = 0.54 ± 0.03 and β = 1.19 ± 0.1, where a similar bubble behaviour has been observed.
Bubble shape in 3-D view (a) and snapshots of the fluid (b) for Rmax = 800 μm, γh = 0.75, sv/H = 0.29 (γv = 0.61), β = 1.05. The initial parameters used in the numerical simulation are R 0 = 137 μm and p 0 = 107 N m−2.

5. Comparison with similar configurations
In the absence of previous studies on the behaviour of bubbles in rectangular channels, we limit ourselves, in this section, to a comparison of our results with those of previous studies on bubble dynamics in similar configurations. A bubble oscillating in a rectangular channel is subjected to three pressure gradients, namely two opposed pressure gradients induced by the sidewalls of the channel and a third pressure gradient, induced by the endwall of the channel, that is perpendicular to the other two. Similar configurations to that described in this study include the case of a buoyant bubble situated between two vertical parallel rigid walls (Choi & Chahine Reference Choi and Chahine2004), a bubble oscillating in an acute-angled corner (Cui et al. Reference Cui, Chen, Wang, Zhou and Corbett2020; Wang et al. Reference Wang, Mahmud, Cui, Smith and Walmsley2020b) and the case of two synchronized bubbles collapsing between two parallel rigid walls (Hsiao et al. Reference Hsiao2013).
Choi & Chahine (Reference Choi and Chahine2004) observed the growth and collapse of a buoyant bubble generated in the middle between two vertical parallel rigid walls. Here, the third pressure gradient acting on the bubble surface is induced by the buoyant force acting in a direction parallel to the rigid walls. The distance between the parallel rigid walls is 50.8 mm and the maximum bubble radius, estimated from their photographic sequence, is about 24 mm, resulting in a value β ≈ 1.06. Since the bubble is relatively small, the influence of the pressure gradient induced by the buoyant force is small compared to that generated by the attractive Bjerknes force from each vertical wall. The bubble developed an asymmetric annular jet during collapse, leading to the formation of two lobes in contact with the vertical walls, and a planar jet, moving in the direction of the buoyant force, that was able to penetrate, albeit very little, the opposite side of the structure connecting the lobes. A liquid jet was formed in each lobe as well, but it is not clear from their photographic sequence if the jets are inclined with respect to the vertical walls. Altogether, their results resemble our findings for β ≈ 1.1 and intermediate  ${\gamma _h}$ values (see, for example, figure 4b).
The growth and collapse of a bubble situated in an acute-angled corner formed by two rigid walls was recently studied by Cui et al. (Reference Cui, Chen, Wang, Zhou and Corbett2020) and Wang et al. (Reference Wang, Mahmud, Cui, Smith and Walmsley2020b). Decomposition of the pressure gradients, acting perpendicularly on each wall of the corner, into their components in two perpendicular directions results in a configuration similar to that used in the present experiment. The bubble motion was investigated for two particular cases: a bubble generated at the bisector of the corner and a bubble generated very close to one of the corner walls. When a relatively large bubble (i.e. touching the corner walls at its maximum expansion) is generated at the bisector of the corner and at an intermediate distance from the corner vertex, it developed an asymmetric annular jet and a planar jet directed towards the vertex. In a late collapse stage, the annular jet led to the formation of two lobes that collapse in contact with the corner walls. No counterjet-like structures emerged from the bubble lobes during rebound. The temporal development of the bubble shape resembles that obtained in the present experiment for β ≈ 0.85 at intermediate  ${\gamma _h}$ values (see, for example, figure 3b). When, on the other hand, the distance between the initial position of the bubble and the corner vertex was decreased, the bubble behaviour became similar to that observed for small
 ${\gamma _h}$ values in the present experiment, namely the bubble develops only a strong planar jet directed towards the corner vertex that is able to penetrate the opposite bubble side. In both cases, the bubble motion is accompanied by a significant migration in the direction of the planar jet, with the bubble extremities in contact with the corner walls. Cui et al. (Reference Cui, Chen, Wang, Zhou and Corbett2020) also investigated the behaviour of a bubble situated very close to one of the corner walls. The distance between the initial position of the bubble and the nearby wall is about half the maximum bubble radius and the dimensionless bubble–vertex distance is 2.37. The bubble is relatively small so that, at its maximum expansion, the bubble does not touch the second wall of the corner (the dimensionless bubble–wall distance is 1.27). They observed the development of an annular jet during collapse, which is manifested as a constriction at the bubble part farthermost from the wall, the inclination of this constriction towards the vertex during bubble rebound, and a significant migration of the bubble along the wall, similar to the dynamics observed in the present study for
 ${\gamma _v} = 0.64$ and
 ${\gamma _h} = 2.81$ (figure 7b).
It is interesting to note here that a bubble generated near an obtuse-angled corner develops only an oblique jet towards the nearby wall of the corner, irrespective of the initial position of the bubble inside the corner (Cui et al. Reference Cui, Chen, Wang, Zhou and Corbett2020; Li et al. Reference Li, Cui, Zhang, Liu and Peng2020). For this particular situation, decomposition of the pressure gradients into their components results in a configuration in which the bubble is situated in two perpendicular pressure gradients. The bubble dynamics is, therefore, qualitatively similar to the dynamics of a bubble generated near two perpendicular rigid walls, as described by Brujan et al. (Reference Brujan, Noda, Ishigami, Ogasawara and Takahira2018) and Tagawa & Peters (Reference Tagawa and Peters2018), and only one inclined jet develops during bubble collapse.
A similar configuration to that used in the present investigations is also found in the case of two synchronized bubbles generated between two parallel rigid walls and situated at the same distance from the rigid walls. This is because the plane of symmetry between the two bubbles acts as a rigid wall, except for a boundary layer in the case of a rigid wall. Hsiao et al. (Reference Hsiao2013) numerically simulated the interaction of two cavitation bubbles generated in the middle of two parallel flat disks with a radius of 750 μm. In their numerical experiment, the distance between the disks is 25 μm, the bubbles were initially situated 40 μm apart and the maximum radius of the bubbles is 23 μm. With the present notation, this is equivalent to  ${\gamma _h} = 0.87\textrm{, }\beta = 0.54$, and sv/H = 0.5. They found that each bubble develops a single jet directed towards the other near the end of collapse, together with a significant migration in the direction of the jet, closely resembling the results of the present investigations for β ≈ 0.85 and very small
 ${\gamma _h}$ values (see, for example, figure 4b). The authors also simulated a case in which the bubbles are much smaller than the height of the channel (Rmax ≈ 2 μm, resulting in β ≈ 13 and
 ${\gamma _h} = 10$). The value of the β parameter used in their calculations is about four times larger than the maximum value used in our investigations (β = 3.5), so that a comparison with their simulations is not possible.
6. Conclusions
The jetting behaviour and the migratory characteristics of laser-induced cavitation bubbles in a rectangular channel have been investigated both experimentally and theoretically. The bubble behaviour was investigated by using high-speed photography at 100 000 frames s−1. To get a clearer picture of the jetting behaviour, numerical simulations were also conducted by using an Eulerian finite element method with a compressible liquid impact model, which provided the pressure contours and the velocity fields in the fluid field ambient to the bubble. The method enables simulation of jet impact at very late stages during collapse.
The jetting behaviour of the bubble varies between single jet formation and the formation of three liquid jets directed towards each wall of the channel. The dynamics of cavitation bubbles is particularly interesting when the maximum bubble diameter is slightly smaller than the channel height (β ≈ 1.1). When generated close to the central part of the channel and far from its endwall, the bubble develops two inclined jets directed towards the channel sidewalls. A bubble generated close to the channel endwall develops a planar jet flowing towards this wall. In the intermediate region, the bubble develops three jets during collapse, a relatively low-velocity planar jet directed towards the end of the channel and two inclined jets directed towards the channel sidewalls. The numerical simulations indicate that the maximum velocity of the jets flowing towards the sidewalls is as high as 100 m s−1. In contrast, a bubble generated close to one of the channel sidewalls develops a single inclined jet towards the nearby wall with a maximum velocity of about 110 m s−1. A bubble with maximum diameter of half the channel height (β ≈ 2), generated closer to a sidewall of the channel, develops a single inclined jet during collapse, as if the bubble were generated near two perpendicular rigid walls.
The largest displacement of the bubble in contact with the sidewalls of the channel is obtained when the bubble diameter is slightly smaller than the height of the channel. A bubble displacement of 350 μm was observed during the first two oscillation cycles of a bubble generated in the central part of the channel, as a consequence of a strong planar jet directed towards the endwall of the channel. Slightly smaller values of the bubble displacement were obtained in the case of bubbles whose maximum diameter is larger than the channel height (corresponding to β ≈ 0.85). Bubbles generated closer to a sidewall of the channel show a reduced migration along the nearby wall. For β ≈ 1.1, the bubble displacement along the channel sidewall still reaches high values, with a maximum value of 240 μm measured for bubbles produced close to the endwall of the channel. However, for β ≈ 2, the bubble migration along the nearby sidewall is considerably reduced. A maximum bubble displacement of about 40 μm was observed for bubbles generated in close proximity to the channel endwall.
An important message of the present work is that the dynamical behaviour of a bubble in the relatively complex configuration of a rectangular channel is composed of elements related to simpler geometric constellations like the bubble dynamics near a single rigid wall, oscillation between two parallel rigid walls and the dynamics near a rectangular corner. The relative strengths of the individual components ultimately determine the overall dynamics of the cavitation bubble.
The present results could be used to extract useful information about the cleaning potential of cavitation bubbles in narrow spaces, collateral effects induced by cavitation in laser-assisted machining of microchannels and localized mixing of fluids in rectangular channel. However, a more detailed understanding of bubble behaviour during the final collapse stage, including experimental and numerical studies on the emission of shock wave(s) during bubble collapse and shear stress around the bubble, is necessary to have a clearer picture of the bubble dynamics in a rectangular channel. On the other hand, the good agreement between the numerical simulations and the experiments gives confidence in the predictive capability of the simulations for more complex configurations. Nevertheless, inclusion of the non-equilibrium evaporation and condensation of the vapour inside the bubble in the mathematical formulation is essential for a more accurate modelling of the bubble motion during its final collapse stage and rebound.
Supplementary material
Supplementary material is available at https://doi.org/10.1017/jfm.2022.695.
Acknowledgements
We thank T. Noda and A. Ishigami for help with the experiment.
Funding
This work was supported by a grant from the Japan Society for the Promotion of Science (grant S-12169) and by the National Science Foundation of China (grant 51925904).
Declaration of interests
The authors report no conflict of interest.
Appendix. Side-by-side comparison of experiment and simulation
We provide, in this section, a comparion of the temporal development of the bubble shape between experiments and simulations (see figures 20–23). The simulations predict well both the bubble shapes and the oscillation time of the bubble.
Comparison of experiment (top) and simulation (bottom) for a bubble generated at equal distance from the sidewalls of a rectangular channel for β = 1.08. Experiment: Rmax = 790 ± 24 μm, γh = 5.06 ± 0.18, sv/H = 0.49 ± 0.02, and β = 1.07 ± 0.03. Simulation: Rmax = 790 μm, γh = 5.06, sv/H = 0.49, β = 1.08.

Comparison of experiment (top) and simulation (bottom) for a bubble generated at equal distance from the sidewalls of a rectangular channel for β = 1.31. Experiment: Rmax = 650 ± 24 μm, γh = 3.75 ± 0.15, sv/H = 0.5 ± 0.01, β = 1.31 ± 0.05. Simulation: Rmax = 650 μm, γh = 3.75, sv/H = 0.5, β = 1.31.

Comparison of experiment (top) and simulation (bottom) for a bubble generated closer to the lower sidewall of a rectangular channel for sv/H = 0.28 and β = 1.04. Experiment: Rmax = 820 ± 24 μm, γh = 8.73 ± 0.28, sv/H = 0.28 ± 0.01, β = 1.04 ± 0.03. Simulation: Rmax = 820 μm, γh = 8.73, sv/H = 0.28, β = 1.04.

Comparison of experiment (top) and simulation (bottom) for a bubble generated closer to the lower sidewall of a rectangular channel for sv/H = 0.3 and β = 1.06. Experiment: Rmax = 800 ± 24 μm, γh = 2.81 ± 0.1, sv/H = 0.3 ± 0.01, β = 1.06 ± 0.03. Simulation: Rmax = 800 μm, γh = 2.81, sv/H = 0.3, β = 1.06.