Introduction
There is increasing evidence that several life history traits of emperor penguins (Aptenodytes forsteri, Gray 1844) are highly susceptible to changes in sea ice conditions and distribution. First, with the exception of two breeding colonies established on land, for successful breeding emperor penguins need stable platforms of fast ice throughout much of the season and accessible open waters where they feed (Stonehouse Reference Stonehouse1953, Prévost Reference Prévost1961). Second, during the entire breeding period, emperors use exclusively areas of open water within the pack ice and polynyas to forage on sea ice associated prey species (Ancel et al. Reference Ancel, Kooyman, Ponganis, Gendner, Lignon, Mestre, Huin, Thorson, Robisson and Le Maho1992, Kirkwood & Robertson Reference Kirkwood and Robertson1997, Wienecke & Robertson Reference Wienecke and Robertson1997). Third, for moulting, emperor penguins travel to large bodies of pack ice in which they select ice floes lasting at least 30 days (Kooyman et al. Reference Kooyman, Hunke, Ackeley, van Dam and Robertson2000). Finally, interannual and long-term fluctuations in sea ice conditions are also known to affect laying dates (Barbraud & Weimerskirch Reference Barbraud and Weimerskirch2006), breeding success (Barbraud & Weimerskirch Reference Barbraud and Weimerskirch2001, Jenouvrier et al. Reference Jenouvrier, Barbraud and Weimerskirch2005, Massom et al. Reference Massom, Hill, Barbraud, Adams, Ancel, Emmerson and Pook2009), breeding probability (Jenouvrier et al. Reference Jenouvrier, Barbraud and Weimerskirch2005), as well as survival and population dynamics (Barbraud & Weimerskirch Reference Barbraud and Weimerskirch2001, Ainley et al. Reference Ainley, Clarke, Arrigo, Fraser, Kato, Barton and Wilson2005, Jenouvrier et al. Reference Jenouvrier, Caswell, Barbraud, Holland, Stroeve and Weimerskirch2009a).
Most studies on the demography and population dynamics of emperor penguins in relation to sea ice characteristics have been conducted at a single colony (Pointe Géologie, Terre Adélie). This colony suffered a ∼50% decrease in size during the mid-1970s caused by a short period of apparent low adult survival. This abrupt decline was followed by stability to 2000 and by a recent increase during the 2000s. Several hypotheses have been proposed to explain these dynamics, particularly the abrupt decline. Barbraud & Weimerskirch (Reference Barbraud and Weimerskirch2001) observed that the decline of the population and increase in apparent adult mortality coincided with a sudden decrease in winter sea ice extent during several consecutive years, occurring during a period of increased sea surface temperature. They proposed that changes in the ocean food web related to the sudden decrease in sea ice caused mass starvation. Based on knowledge of the effects of sea ice on the vital rates of this colony (Barbraud & Weimerskirch Reference Barbraud and Weimerskirch2001, Jenouvrier et al. Reference Jenouvrier, Barbraud and Weimerskirch2005), a stochastic population model was developed to estimate population growth rates which were in good agreement with observed data (Jenouvrier et al. Reference Jenouvrier, Caswell, Barbraud, Holland, Stroeve and Weimerskirch2009a). This major decline occurred during a possible regime shift in the Southern Ocean ecosystem that occurred abruptly around 1976. Based on an analysis of ice core data in East Antarctica, Masson-Delmotte et al. (2003) suggested a change in meridional atmospheric circulation during the mid 1970s, bringing more moisture from warm subtropical sources to the Antarctic coast, also reflected in the increase of the Antarctic Annular Oscillation Index which exceeded zero for the first time and to a warming of Pointe Géologie and Ross Island average winter temperatures to respectively -14°C and -23°C (Barbraud & Weimerskirch Reference Barbraud and Weimerskirch2001, Ainley et al. Reference Ainley, Clarke, Arrigo, Fraser, Kato, Barton and Wilson2005). This corresponded to significant changes in cyclic characteristics of sea ice extent and several demographic parameters of three Antarctic species at Pointe Géologie and especially the emperor penguin (Jenouvrier et al. Reference Jenouvrier, Barbraud and Weimerskirch2005), and to significant changes in several marine top predator populations (Reid & Croxall Reference Reid and Croxall2001, Weimerskirch et al. Reference Weimerskirch, Inchausti, Guinet and Barbraud2003, Ainley et al. Reference Ainley, Clarke, Arrigo, Fraser, Kato, Barton and Wilson2005).
More recently, Ainley et al. (Reference Ainley, Ballard, Ackley, Blight, Eastman, Emslie, Lescroël, Olmastroni, Townsend, Tynan, Wilson and Woehler2007) proposed that increased short-term predation of emperor penguins by local pods of Antarctic minke whale (Balaenoptera bonaerensis Burmeister) eating killer whales (Orcinus orca L. type A, Pitman & Ensor Reference Pitman and Ensor2003), consecutive to an important removal of their usual prey (Antarctic minke whale) that occurred in the area at the same time, could partly or entirely explain the decrease in adult survival at the Pointe Géologie colony. Ainley et al. (Reference Ainley, Ballard, Blight, Ackley, Lescroël, Olmastroni, Townsend, Tynan, Wilson and Woehler2010a) further suggested that the rebound in emperor penguin survival at Pointe Géologie was due to release from predation by the removal of an unprecedented ∼100 killer whales within three years in the area. Additionally, it has been proposed, but without supporting evidence, that human disturbance at the colony may be involved in the population changes (Jouventin et al. Reference Jouventin, Stahl, Weimerskirch and Mougin1984). Finally, based on a study on king penguins, Saraux et al. (Reference Saraux, Le Bohec, Durant, Viblanc, Gauthier-Clerc, Beaune, Park, Yoccoz, Stenseth and Le Maho2011) suggested that flipper banding may have affected the population dynamics of emperor penguins in Pointe Géologie, questioning the impact of environmental factors on the crash of the population. Therefore, additional factors other than sea ice contributing to the population decrease of the Pointe Géologie colony cannot be entirely ruled out (see Barbraud & Cotté Reference Barbraud and Cotté2008 and Ainley et al. Reference Ainley, Ballard, Blight, Ackley, Lescroël, Olmastroni, Townsend, Tynan, Wilson and Woehler2010a for the predation hypothesis), and long-term population trends are needed at other breeding localities to assess the vulnerability of the species to predicted sea ice changes.
Very few emperor penguin colonies have been monitored over several decades and among those, visits were usually done during the chick stage (e.g. Kooyman et al. Reference Kooyman, Ainley, Ballard and Ponganis2007). Because breeding success is highly variable between years in emperor penguins due to extreme inter annual variability of egg loss and chick mortality (Jouventin Reference Jouventin1975, Robertson Reference Robertson1992, Barbraud & Weimerskirch Reference Barbraud and Weimerskirch2001, Kooyman et al. Reference Kooyman, Ainley, Ballard and Ponganis2007), long-term population trends estimated from chick counts probably reflect variations in both breeding success and breeding population size. Although chick monitoring provides useful information, the contribution of breeding success variation to long-term trends in chick counts remains difficult to estimate because of its extremely high inter annual variability (from 0–80%).
Here we investigate long-term trends in numbers of breeding pairs made at two different colonies (Pointe Géologie and Haswell Island) where comparable counts of breeding males were accomplished. We were particularly interested to explore whether the decline of the Pointe Géologie breeding population could also be detected at other breeding localities.
Methods
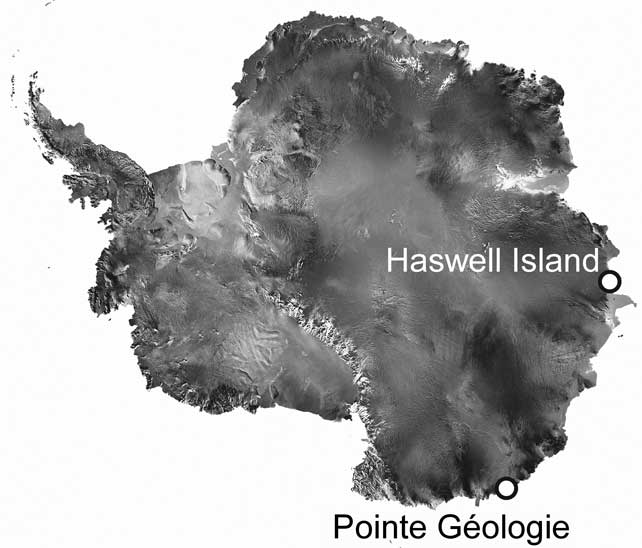
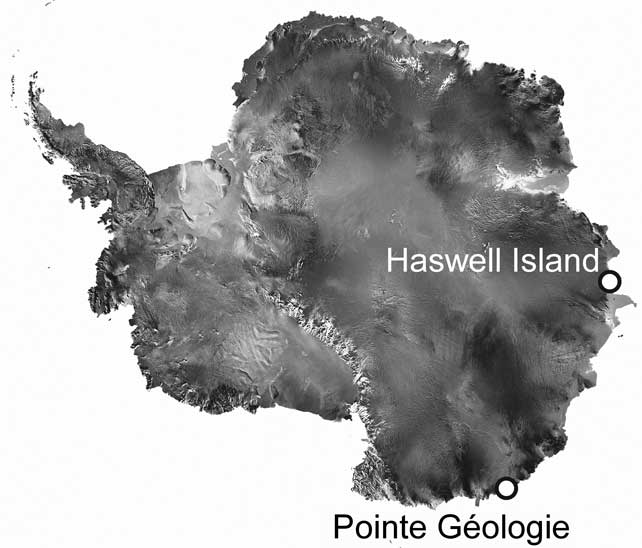
Data come from two breeding colonies (Fig. 1) for which counts were performed prior to the 1970s and repeated since - Pointe Géologie (66°40′S, 140°01′E), located near the French station of Dumont d'Urville, and Haswell Island (66°32′S, 93°07′E), located near the Russian station of Mirny. Although other colonies were surveyed during this time period, survey data consist of chick counts made during spring or early summer and were not used to estimate breeding population trends as explained earlier.
Map of Antarctica (http://terraweb.wr.usgs.gov/web-cgi/webvista.cgi) showing the location of the two studied colonies of emperor penguins.
Pointe Géologie. Data used are the same as those used by Barbraud & Weimerskirch (Reference Barbraud and Weimerskirch2001). The number of breeding pairs was estimated using two methods. First, a count-back was made of dead eggs (Nde) and dead chicks (Ndc) and a direct count of live chicks (Nc) just before their departure at sea. Dead chicks and dead eggs remain frozen on sea ice around the colony and are collected and counted daily during the entire breeding season. The results of the count-back were added to the number of fledged chicks counted in December just before fledging. The number of fledged chicks was estimated by direct counts and/or photograph counts. The number of breeding pairs was thus estimated as Nde + Ndc + Nc. Counts were made in 1952, 1956, 1958 and each year since 1962 except in 1973, from which the number of breeding pairs was calculated using this retrospective method. Second, the number of breeding pairs was also estimated from photographic counts of individuals in early May prior to laying from 1984–98, and of incubating males in mid-June from 2000–09. Individuals or incubating males could be viewed and photographed from a small neighbouring island overlooking the colony. A still camera was used systematically and males were counted on a computer screen.
Breeding success was estimated as the number of fledged chicks (Nc) divided by the number of breeding pairs. Hatching success was estimated as the number of breeding pairs minus the number of dead eggs (i.e. Ndc + Nc) divided by the number of breeding pairs. Fledging success was estimated as the number of fledged chicks divided by the number breeding pairs minus the number of dead eggs.
Haswell Island. Regular counts were performed during the breeding season depending on logistic possibilities, and started as soon as the fast ice was stable enough to reach the colony (end of March to early April), and ended at the onset of sea ice break up (December). All counts were made from an elevated place (top of iceberg or nearby island) and consisted of direct counts and/or photograph counts of both adults and chicks when applicable. From these counts we retained the maximum number of individuals counted in early May (1962, 1966, 1970, 2009) and of incubating males counted in mid-June (1958, 1994, 2003, 2006, 2008) for our analyses (Korotkevich Reference Korotkevich1959, Makushok Reference Makushok1959, Pryor Reference Pryor1964, Kamenev Reference Kamenev1977, Gavrilo & Mizin unpublished, and updated by unpublished data for 2008–09).
Since two types of counts were performed (early May and mid-June) not during the same years we estimated the number of breeding pairs from these counts in order to compare the population dynamics with the one observed at Pointe Géologie. To do this we used the Pointe Géologie data to perform regressions between the numbers of breeding pairs obtained using the count-back method and i) the mid-June count, and ii) the early May count. We then used these regression equations to estimate the number of breeding pairs at the Haswell Island colony from early May and mid-June counts.
Direct counts and/or photograph counts of chicks just before fledging (early December) were also available for a limited number of years with estimates of population size. We used these counts to estimate breeding success as for the Pointe Géologie colony.
For all colonies, population growth rates were estimated using the relationship:

where N 0 is the number of breeding pairs at the time when the first count was made, Nt the number at the end of the same period, e the base of the natural logarithm, t the number of years elapsed between 0 and t, and r the population growth rate.
Results
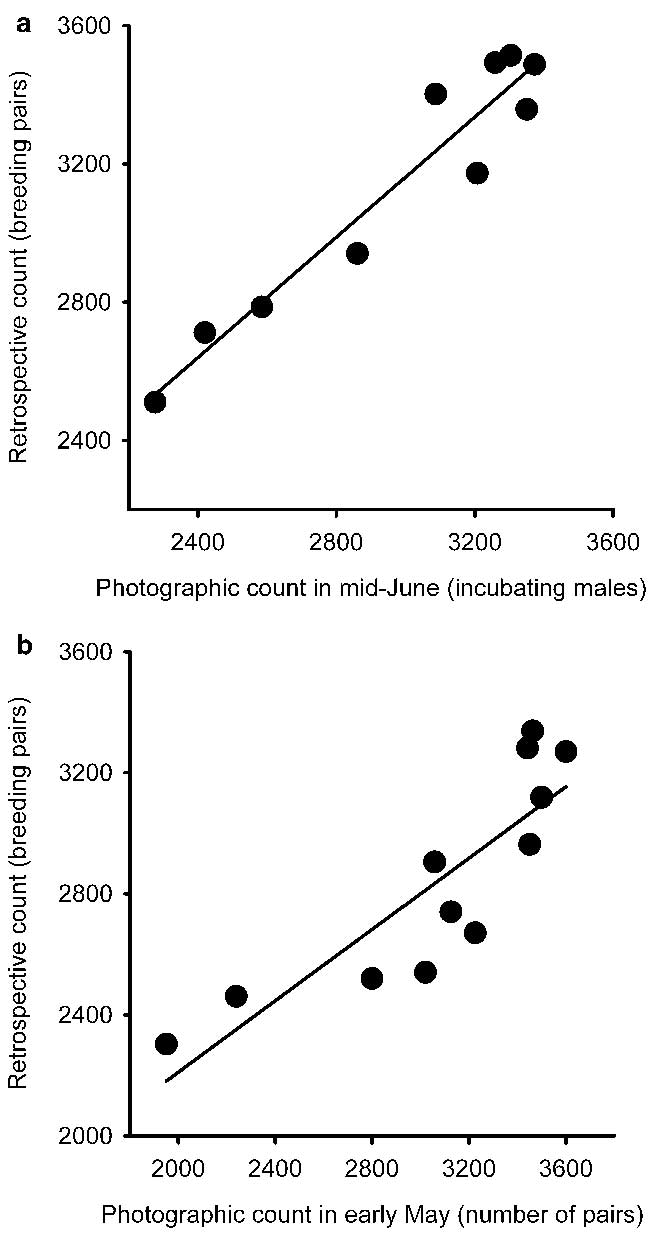
At Pointe Géologie, the number of breeding pairs estimated using the retrospective loss of eggs/chicks method was highly related to the number of incubating males estimated from photographic counts in mid-June (F1,8 = 91.87, P < 0.001, r 2 = 0.920; Fig. 2a), and to the number of individual pairs counted in early May (F1,10 = 28.30, P < 0.001, r 2 = 0.739; Fig. 2b). We thus used these regression equations to estimate the number of breeding pairs at Haswell Island from the raw count data, which were used thereafter.
a. Relationship between the photographic count of incubating males in mid-June and the number of breeding pairs estimated using the retrospective method for the Pointe Géologie emperor penguin colony. Plain line: regression line (y = 552.8 + 0.870 × x). b. the early May count of individuals paired and the number of breeding pairs estimated using the retrospective method for the Pointe Géologie emperor penguin colony. Plain line: regression line (y = 1030.5 + 0.590 × x).

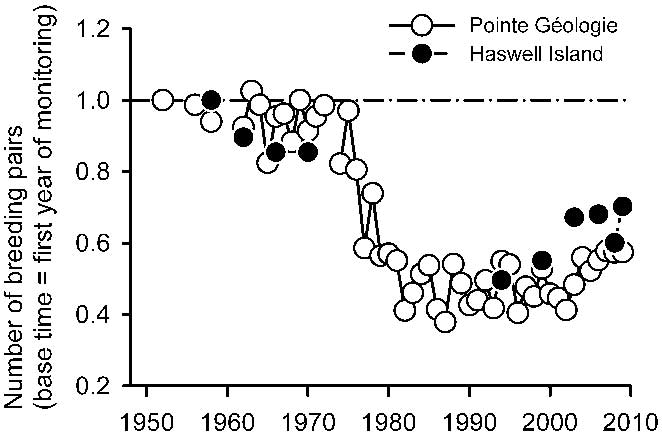
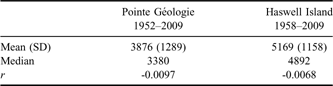
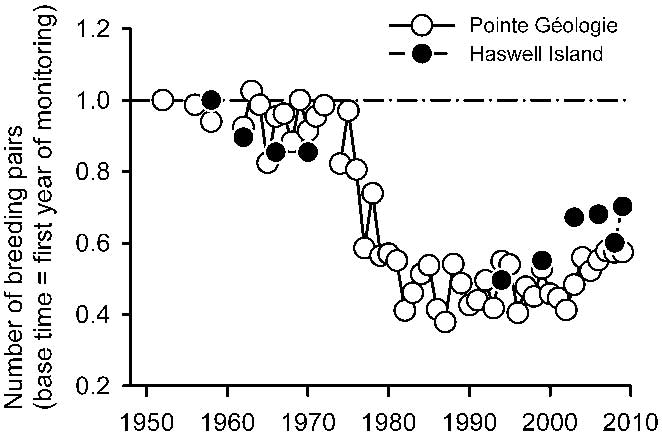
Pointe Géologie and Haswell colonies show a very similar pattern in the changes in their breeding population sizes over the past 50 years (Fig. 3). The mean and median numbers of breeding pairs and population growth rates for the two colonies are shown in Table I. For both colonies population growth rates were lower than zero (Fig. 3). Annual population growth rates were similar for both colonies before, during and after the hypothesized regime shift period, as well as during an identical (1958–2009) period (Pointe Géologie: -0.0095, Haswell: -0.0068).
Number of breeding pairs of emperor penguin for the Pointe Géologie and Haswell Island colonies. Numbers are scaled relative to the first year of monitoring for each colony. The dashed-dotted line indicates population stability.
Mean number of breeding pairs and annual population growth rate (r) for the Pointe Géologie and Haswell Island emperor penguin colonies.

For Haswell Island and Pointe Géologie colonies, there were marked differences in breeding population sizes before and after the supposed regime shift period (Table II), with 48.8% and 31.5% declines in mean population sizes, respectively. Before the early 1970s breeding population was nearly stable at Pointe Géologie, and slightly declining at Haswell Island. Annual breeding population growth rates decreased down to ∼6.5% at Pointe Géologie, and to ∼2.3% at Haswell Island. After the 1990s, growth rates became positive, indicating that both populations increased, although only slightly. Numbers of breeding pairs at Pointe Géologie and Haswell Island were highly correlated (Kendall τ = 0.674, P = 0.009).
Number of breeding pairs and annual population growth rate (r) for the Pointe Géologie and Haswell Island emperor penguin colonies before, during (1972–81) and after the hypothesized regime shift period identified in Jenouvrier et al. (Reference Jenouvrier, Caswell, Barbraud, Holland, Stroeve and Weimerskirch2009a).

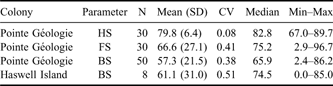
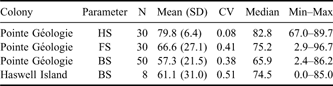
Although not correlated (Kendall τ = 0.265, P = 0.445), average breeding success was similar at both colonies as well as extreme values (Table III). At Pointe Géologie hatching success was much less variable than fledging and breeding success (Table III).
Summary statistics for hatching (HS), fledging (FS) and breeding success (BS) for the Pointe Géologie and Haswell Island emperor penguin colonies. N indicates the number of years.
Discussion
The strong relationships between the numbers of breeding pairs estimated from mid-June and early May counts and the retrospective estimates suggests that both methodologies are reliable for estimating population trends. In emperor penguins, chick mortality may be extremely variable from year to year (fledging success CV = 40.7% at Pointe Géologie) and thus chick counts may be poor indicators of the number of breeding pairs, whereas egg mortality is less variable from year to year (hatching success CV = 8.1% at Pointe Géologie, CV = 2.1% at Haswell Island). For example, the number of fledged chicks at Pointe Géologie was a poor predictor of the number of breeding pairs during the period 1980–2009 (r 2 = 0.11, F1,28 = 3.34, P = 0.08). This does not mean that chick monitoring of emperor penguins is not worth considering for inferring long-term population trends, but that results must be interpreted cautiously. Consequently, although mid-June counts of incubating males may slightly underestimate the breeding population size compared to the retrospective method due to egg failures before the count, we are confident that they provide reliable data for estimating population trends. Counts of adults in June provide a more accurate estimate of the size of the breeding population than counts conducted in May. This may be because it is much more difficult to estimate the number of breeding pairs when both males and females are present in the colony.
Long-term breeding population changes were observed for the two colonies of emperor penguins over the last 50 years. Although the decline in breeding populations at Pointe Géologie was previously reported (Barbraud & Weimerskirch Reference Barbraud and Weimerskirch2001), the decline observed at Haswell Island (Gavrilo & Mizin unpublished) brings new information to our understanding of the species population dynamics, and suggest that the large and sudden decline observed at Pointe Géologie is not unique. Remarkably, a severe decline was also observed for the Dion Islands colony, Antarctic Peninsula (Trathan et al. Reference Trathan, Fretwell and Stonehouse2011), in an area where sea ice is completely disappearing (Cavalieri & Parkinson Reference Cavalieri and Parkinson2008). As for the Pointe Géologie and Haswell Island colonies, the decline at Dion Islands started in the 1970s and the colony is now reported extinct (Trathan et al. Reference Trathan, Fretwell and Stonehouse2011). However this colony, because of its small size, might not be considered as a typical emperor colony compared to larger colonies, because breeding success of emperor penguins has been suggested to be sub optimal for smaller colonies (Jouventin Reference Jouventin1975). Haswell and Pointe Géologie are more likely to represent typical emperor colonies. Both the Haswell Island and Pointe Géologie colonies declined during the period between 1976–79 for Pointe Géologie, and between early 1970s and 1995 for Haswell, encompassing the hypothesized regime shift period previously identified for the Pointe Géologie colony (Jenouvrier et al. Reference Jenouvrier, Caswell, Barbraud, Holland, Stroeve and Weimerskirch2009a) and elsewhere in Antarctica and the Southern Ocean (Maslennikov Reference Maslennikov2003, Masson-Delmotte et al. Reference Masson-Delmotte, Delmotte, Morgan, Etheridge, van Ommen, Tartarin and Hoffmann2003, Weimerskirch et al. Reference Weimerskirch, Inchausti, Guinet and Barbraud2003, Ainley et al. Reference Ainley, Clarke, Arrigo, Fraser, Kato, Barton and Wilson2005). In addition, the magnitude of the decline and the population growth rates were similar between both colonies, and numbers of breeding pairs at both colonies were correlated. This suggests that a common large-scale environmental factor negatively affected both colonies. Although it has been hypothesized that the decline of the Pointe Géologie and Haswell Island colonies may have been caused by human disturbance (Jouventin et al. Reference Jouventin, Stahl, Weimerskirch and Mougin1984), excessive disturbance during incubation is reported to have occurred only in early years at Haswell Island (Kamenev Reference Kamenev1968), and there is to our knowledge no quantitative data to test this hypothesis. If disturbance may have partly affected the breeding success of colonies in the earlier years, it seems very unlikely that it has affected the size of both colonies in the 1970s in the same way. A more parsimonious explanation is that a large scale (and documented) climatic/oceanographic impact has synchronized the changes in growth rates of both populations. Similarly, although flipper banding may have affected some demographic parameters of the population of emperor penguins, it cannot account alone for the decline of the Pointe Géologie population, in view of the similar dynamics of the Haswell and Dion populations where no flipper banding occurred.
The population at Pointe Géologie has not recovered since its decline even though some environmental factors appear to have reverted to the state before the decline period (e.g. air temperatures). From a demographic point of view the relatively low and highly variable breeding success observed after the population decline was sufficient to have prevented the population recovery (Jenouvrier et al. Reference Jenouvrier, Barbraud, Weimerskirch and Caswell2009b). At Haswell Island the demographic information is too sparse for making such an inference but breeding success reached its lowest values during the early 2000s (33% in 1999 and 0% in 2003). From a feeding ecology point of view, the isotopic signature of feathers of emperor penguins before, during and after the 1970s shows little variations, indicating neither major dietary shift (δ15N) nor important changes in penguins’ foraging habitat and primary productivity of the ecosystem (δ13C) during the last decades (Jaeger & Cherel Reference Jaeger and Cherel2011). Since i) a decrease in sea ice extent occurred in Adélie Land (but also in other regions in East Antarctica and in the Bellingshausen Sea in West Antarctica) during the early 1970s (Curran et al. Reference Curran, van Ommen, Morgan, Phillips and Palmer2003, Abram et al. Reference Abram, Thomas, McConnell, Mulvaney, Bracegirdle, Sime and Aristarain2010), ii) a low sea-ice extent is known to negatively impact populations of Antarctic krill Euphausia superba Dana (Nicol Reference Nicol2006), and iii) emperor penguins feed mainly on prey (the Antarctic silverfish Pleuragramma antarcticum Boulenger) locally feeding on krill (DeWitt et al. Reference DeWitt, Heemstra and Gon1990, Cherel Reference Cherel2008) and on other ice-dependent species (Granata et al. Reference Granata, Zagami, Vacchi and Guglielmo2009), a lower biomass of penguin prey is a likely explanation for the population decline of emperor penguins in Pointe Géologie and Haswell Island. Interestingly, important changes in cyclicity in numbers of breeding pairs and breeding success were reported for snow petrels Pagodroma nivea Forster, which feeds on Pleuragramma (Ridoux & Offredo Reference Ridoux and Offredo1989) and southern fulmars Fulmarus glacialoides (Smith), which feeds on Pleuragramma and krill (Ridoux & Offredo Reference Ridoux and Offredo1989), during the late 1970s (Jenouvrier et al. Reference Jenouvrier, Barbraud and Weimerskirch2005).
A decrease in sea-ice extent has been hypothesized to negatively affect adult survival, or increase emigration (via a decrease of food resources) and breeding population size at Pointe Géologie (Barbraud & Weimerskirch Reference Barbraud and Weimerskirch2001, Jenouvrier et al. Reference Jenouvrier, Caswell, Barbraud, Holland, Stroeve and Weimerskirch2009a). Curran et al. (Reference Curran, van Ommen, Morgan, Phillips and Palmer2003) reported a regional decrease of sea ice extent based on a significant correlation between methanesulphonic acid (MSA) concentrations from a Law Dome ice core and satellite-derived sea ice extent for the 80°E to 140°E sector, which includes the Haswell Island and Pointe Géologie colonies. There is increasing evidence supporting MSA as a reliable sea ice extent proxy (Foster et al. Reference Foster, Curran, Smith, van Ommen and Morgan2006), with also consistent sea ice trends inferred from MSA-based reconstructions, satellite observations and model simulations in other parts of Antarctica (Abram et al. Reference Abram, Thomas, McConnell, Mulvaney, Bracegirdle, Sime and Aristarain2010). Satellite measurements of sea ice extent for the period 1978–2006 suggest slightly increasing sea ice extent for the sector including the Haswell Island and Pointe Géologie colonies (Cavalieri & Parkinson Reference Cavalieri and Parkinson2008). These patterns in sea ice extent (decrease in the early 1970s, increase since the early 1980s) coincide with the population growth rates observed at the two colonies during the satellite era (positive at Haswell Island and Pointe Géologie) and are coherent with the predicted response of emperor penguins to climate change (Jenouvrier et al. Reference Jenouvrier, Caswell, Barbraud, Holland, Stroeve and Weimerskirch2009a, Ainley et al. Reference Ainley, Russell, Jenouvrier, Woehler, Lyver, Fraser and Kooyman2010b). Finally, and importantly, long-term land-based observation of the onset of fast-ice break up at Mirny and Dumont d'Urville indicate early fast ice break up coinciding with the hypothesised regime shift period (Table IV).
Mean (± SD) ordinal day of sea-ice breakup observed at the Mirny and Dumont d'Urville stations. Number of years of data is indicated in parentheses.

Other sea ice physical properties than extent, but which may co-vary with sea ice extent, may also have played a role in the decline of these emperor penguin colonies. Since emperor penguin breeding success is dependent upon the stability of a stable sea ice platform until December, a thinning in sea ice thickness and instability of fast ice may cause massive breeding failures and contribute to population decline (Jouventin Reference Jouventin1975, Ainley et al. Reference Ainley, Russell, Jenouvrier, Woehler, Lyver, Fraser and Kooyman2010b). At Pointe Géologie, massive breeding failures due to early sea ice break-out occurred but very infrequently. From a demographic point of view a decrease in breeding success cannot explain the abrupt and important decrease in breeding pairs observed during the 1970s. We therefore suggest that, for the Pointe Géologie colony, the contribution of changes in sea ice thickness to the decline in breeding population via a negative effect on breeding success was small.
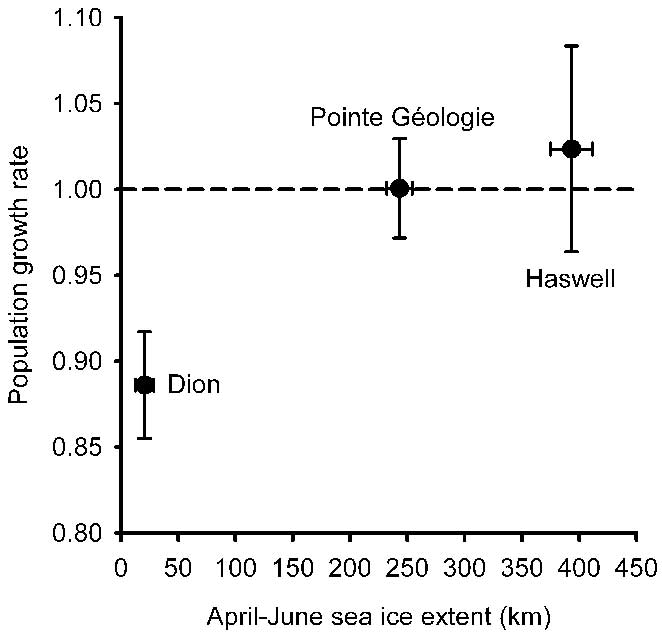
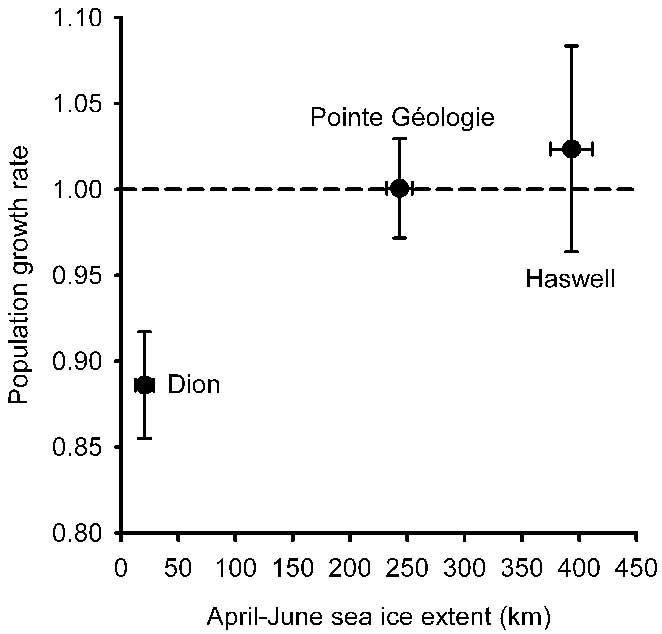
The “habitat optimum model” of population growth relative to sea ice proposed by Fraser & Trivelpiece (Reference Fraser and Trivelpiece1996) for the Adélie penguin Pygoscelis adeliae (Hombron & Jacquinot) might be useful in understanding the population growth rates of emperor penguin colonies on decennial time scales. This model assumes that population growth is highest during conditions of intermediate sea ice coverage, between extremes of excessive and insufficient sea ice coverage. According to this model colony location and long-term persistence are associated with several sea ice mediated factors on multiannual time scales. For emperor penguins these factors may be stable ice platforms to breed, ice thickness, sufficient prey within the foraging range, abundance of prey among others. Since Jenouvrier et al. (Reference Jenouvrier, Barbraud and Weimerskirch2005) showed that population size of breeding emperor penguins at Pointe Géologie was related to sea ice extent in April–June, we plotted the mean population growth rates of the two studied colonies against the mean sea ice extent in April–June obtained since the beginning of the satellite era (Fig. 4). We also plotted the Dion Islands colony population growth rate obtained from counts of incubating males published in the literature (Trathan et al. Reference Trathan, Fretwell and Stonehouse2011). The Dion Islands colony appears to be situated in below optimum sea ice conditions whereas the Pointe Géologie and Haswell Island colonies are at or slightly above optimum sea ice conditions. Note that a similar pattern was obtained when using sea ice extent in March–December, excluding the months when sea ice is minimal. Although population growth rates from other colonies are needed to test this habitat optimum model, it seems that emperor penguin colonies may have difficulties in maintaining stability unless sea ice extends beyond ∼150–200 km from the colony on average. According to this conceptual model the recently discovered colony at Snow Hill Island (Coria & Montalti 2000), which is the only other known emperor penguin colony in the Antarctic Peninsula, would be at or just below optimum conditions. Given the observed sea ice trends (extent and duration) in the Antarctic Peninsula (Parkinson Reference Parkinson2004, Trathan et al. Reference Trathan, Fretwell and Stonehouse2011) this colony is probably under serious threat considering the projected sea ice conditions for the 21st century.
Mean population growth rate and mean sea ice extent estimated during the satellite era for the two colonies of Pointe Géologie and Haswell Island, and for Dion Islands (Antarctic Peninsula). Bars indicate ± s.e.
This study highlights the similar trends of two distant colonies suggesting similar large-scale factors have affected them. More long-term surveys of emperor penguin colonies are needed to better understand the impact of climate fluctuations on the demographic parameters and population dynamics. Reliable surveys can be obtained using a count-back method, although this requires visiting the colony regularly during the entire breeding cycle, or using photographs of incubating males in early June. We recommend that when estimating population trends using only chick counts, care should be taken for inference about trends given the potentially important year-to-year variability in chick mortality in colonies. Additionally, emperor penguin colonies can now be detected from space, and satellite imagery may help estimating large changes in colony size (Barber-Meyer et al. Reference Barber-Meyer, Kooyman and Ponganis2007).
Acknowledgements
We thank all the wintering fieldworkers involved in the long-term monitoring programs of the emperor penguin population at Dumont d'Urville and at Mirny observatory (Alexander Belozor, Ivan Mizin and Dmitry Dorofeev). Sincere thanks to Dominique Besson and Karine Delord for their help in the database management. Sea ice break-up data at Dumont d'Urville were provided by Météo France. Thanks to Yves Cherel, Charly Bost and David Ainley for providing helpful comments on the manuscript. The study carried out at Pointe Géologie, Terre Adélie was supported since 1952 by Expéditions polaires Françaises, Institut Paul Emile Victor (programme IPEV no. 109) and Terre Australes et Antarctiques Françaises in France, and at Haswell by Russian Antarctic Expedition since 1999 and national scientific programme The World Ocean in Russia.